Abstract
Background:
Right ventricular (RV) function is an important determinant of outcomes in pulmonary hypertension (PH). RV-arterial coupling ratio using stroke volume to end-systolic volume (SV/ESV) has been shown to be an independent predictor of outcome in adults with PH. SV/ESV has not been used in pediatrics to predict outcomes. We compared SV/ESV between pediatric PH patients, controls, and among groups based on disease severity. We correlated SV/ESV to RV strain and evaluated SV/ESV as a predictor of outcomes in pediatric PH.
Methods and Results:
One hundred and twenty-five children with PH (8yrs (3–12yrs)) underwent three-dimensional echocardiography (3DE) from 2014–2017 and compared to 65 controls (9yrs (7–13yrs)). Offline analysis generated 3D end-diastolic volume (EDV), ESV, SV, and free wall RV longitudinal strain (LS). SV/ESV ratios were compared between PH patients, controls, and disease severity. Correlations between SV/ESV to free wall RVLS were assessed using general linear mixed models. Cox proportional hazards analysis assessed the predictive ability of SV/ESV. PH patients had lower SV/ESV compared to controls (0.88±0.18 vs 1.24±0.23, p<0.0001). There were significant associations between SV/ESV to free wall RVLS (r = −0.53, p<0.001). SV/ESV emerged as a strong predictor of adverse clinical event (HR (CI) 0.52 (0.38–0.69) per 0.1 increase in SV/ESV; p<0.0001).
Conclusions:
SV/ESV as a volume estimate of RV-arterial coupling ratio correlates with RV strain and is a strong predictor of adverse clinical events in pediatric PH.
Keywords: Pulmonary Hypertension, Echocardiography, Imaging, Clinical Studies, Prognosis
Keywords: echocardiography, 3-dimensional, outcomes research, pediatrics, pulmonary hypertension, right ventricular arterial coupling ratio
INTRODUCTION
Pediatric pulmonary hypertension (PH) is an incurable disease with a poor prognosis1. The main cause of mortality is right ventricular (RV) failure with inability of the RV to maintain cardiac output with increasing arterial afterload, thus decoupling of the ventricular-vascular system. The RV adapts to increasing afterload by enhancing contractility to maintain flow2, 3. RV- arterial coupling ratio has been evaluated by invasive cardiac catheterization measures using pressure-volume loop and single beat method4, 5. This ratio has also been evaluated using cardiac magnetic resonance imaging (CMRI)6–9. However, both cardiac catheterization and CMRI often require sedation in pediatric population and is not readily available at the bedside.
Three-dimensional echocardiography (3DE) is readily available and is noninvasive. 3DE determined RV volumes and ejection fraction (EF) correlate strongly with cardiac MRI when evaluating for RV volumes and function10, 11. Noninvasive measures of RV function include two-dimensional (2D) fractional area change (FAC), RV EF, and RV strain12–16. RV strain from prior studies have shown that it may be a potential early marker of prognosis before other RV functional indices are abnormal17, 18. However, these measures do not take into account the ventricular-arterial interaction in PH. In the presence of chronic increase afterload, the RV adapts by progressive increase in contractility to maintain cardiac output7. Thus, a determination of RV function must include estimations of contractility and afterload. RV contractility is determined by the slope of end-systolic pressure versus the end-systolic volume (ESV) and is called end-systolic elastance (Ees)5, 19–21. RV afterload can be estimated from the pressure-volume relation as arterial elastance (Ea) with end systolic pressure divided by the stroke volume (SV)19. Ees/Ea represents the ventriculoarterial coupling ratio that can be further simplified for pressure and expressed as SV/ESV ratio9. Using SV/ESV as a volume estimate of RV-arterial coupling ratio has been shown to be an independent predictor of outcome in adults with PH and has been shown to be more sensitive than RVEF to changes in function early in disease7–9, 22. SV/ESV ratio has not been used in pediatric PH patients to evaluate outcomes. We aimed 1) to compared SV/ESV between pediatric PH patients and controls, 2) to compare SV/ESV between different groups of PH patients and disease severity, 3) to evaluate the relationship of SV/ESV to RV longitudinal strain (LS), and 4) to evaluate SV/ESV for prediction of clinical outcomes in pediatric PH.
METHODS
The data, analytic methods, and study materials will not be made available to other researchers for purposes of reproducing the results or replicating the procedure.
Study population
The medical records were retrospectively reviewed for pediatric PH patients from 2014 to 2017. PH patients were evaluated for study inclusion if they had a diagnosis of idiopathic pulmonary arterial hypertension (IPAH) and associated pulmonary arterial hypertension with congenital heart disease (APAH-CHD) by cardiac catheterization with a mean pulmonary artery pressure >25mmHg and pulmonary vascular resistance > 3 Woods units, had a routine 2D echocardiogram in addition to 3DE, and were seen in the PH clinic. World Health Organization Functional Classifications (WHO-FC) were identified in each patient at clinic visits. Patients were excluded if they were greater than 18 years of age and if the echocardiographic images were poor for adequate tracing of the endocardial borders. Normal pediatric patients served as controls who had no cardiac defects or family history of cardiac disease or they were patients who were evaluated in the cardiology clinic for heart murmurs, chest pain, or syncope with normal structure hearts. This study was approved by the institutional review board at the University of Colorado.
Three-Dimensional Echocardiography
Single beat full volumes of 3D echocardiography RV datasets were acquired using the 4Z1c matrix-array transducer (frequency bandwidth, 1.5 – 3.5 MHz; maximum depth, 30cm; maximum field of view, 90°x90°) on the Siemens SC2000 cardiac ultrasound system (Siemens Healthcare, Erlangen, Germany). An apical 4 chamber view was acquired with the patient in the lateral decubitus position. The transducer position was modified for optimal simultaneous visualization of the tricuspid valve, cardiac apex, infundibulum, and right ventricular outflow tract (Video 1). 3DE RV datasets were digitally analyzed offline using the commercial software (4D RV-Function 2.0, TomTec Imaging Systems, Unterschleissheim, Germany) to generate RV volumes and functional indices automatically: 3D end-diastolic volume (EDV), 3D ESV, 3D SV, 3D EF, fractional area change (FAC), and free wall (FW) RV LS (Supplemental Figure 1). For clarity, we will refer FAC derived from the 3D datasets as 3D FAC to differentiate from 2D FAC that is traced from 2D echocardiograms.
Determination of RV-arterial coupling ratio
Using the Sanz method, the Ees/Ea ratio has a common pressure term and can thus be simplified in the following equation (see supplementary material for full equation)9:
Clinical Outcomes
Clinical outcomes were analyzed in all PH patients with predefined adverse clinical events. An adverse clinical event was defined as 1) new initiation of intravenous prostacyclin, 2) PAH related hospitalization with increased RV failure or hemoptysis, 3) creation of an atrial septostomy, 4) performance of a Pott’s shunt, 5) performance of lung transplantation, or 6) death. These adverse clinical outcomes were composite endpoints similar to previous medication trials in PAH.23 All patients were followed up until the clinical event or the end of the study period.
Statistical Analysis
Analyses were performed using SAS 9.4 and JMP 13.0. Variables were checked for the distributional assumption of normality using normal plots, in addition to Kolmogorov-Smirnov and Shapiro Wilks tests. All normally distributed group specific data sets are reported as mean with corresponding standard deviations. Non-normally distributed values are reported as median values with corresponding interquartile ranges.
RV volumes, EF, SV/ESV and FW RVLS were compared between controls, IPAH, and APAH-CHD PH patients using either one-way ANOVA or Kruskal-Wallis as dictated by distribution. RV volumes, EF, SV/ESV, and FW RVLS were also compared between PH patients with different WHO-FC. Correlations between SV/ESV to 2D FAC, 3D FAC, FW RVLS were assessed using general linear mixed models adjusted for age, sex, and body surface area. Mixed model analysis using subjects with at least two repeated measures were also performed.
Composite hard outcomes were defined as death, lung transplantation, initiation of intravenous/subcutaneous prostacyclin therapy, PAH related hospitalization with increased RV failure or hemoptysis, clinically indicated atrial septostomy or need for a Pott’s shunt. Kaplan-Meier survival curve was used to describe the survival behavior of time from echocardiographic study to this composite outcome. Association of SV/ESV with outcomes was assessed using Cox regression model while adjusting for age, BSA, and gender of patient. Discriminating ability of Cox regression model was assessed by time-dependent integrated area under receiver operating characteristics (ROC) curve and Uno’s c-statistic24. Integrated area under ROC curves is a summary statistic for area under ROC curves of the follow-up period and this was performed in all RV parameters (2D FAC, RV volumes, RV EF, 3D FAC, SV/ESV, and FW RVLS). Comparison of C-statistics with SV/ESV based on model adjusting for age, gender, and BSA was performed. All patients were followed up to the particular event or the end of the study (December 2017). A sub-analysis of outcomes using Kaplan Meier survival curve, Cox regression model (adjusted for age, BSA, and gender of patient), and ROC were performed in IPAH patients. Significance was based on an α-level of 0.05. The ICC for interobserver and intraobserver variability had been reported in our previous paper.25
RESULTS
PH patients and controls
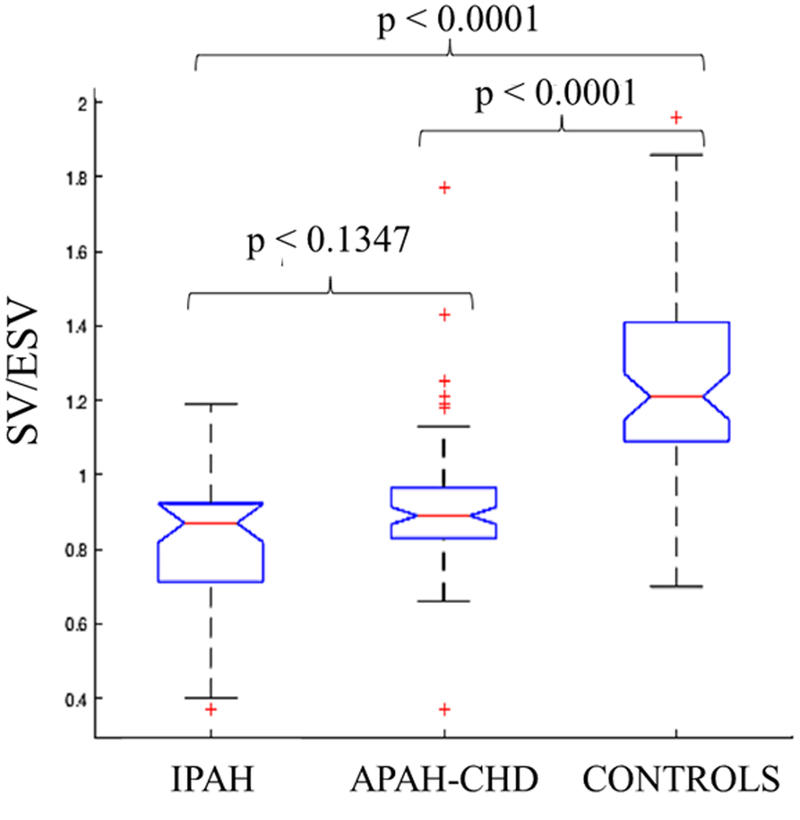
There were 125 PH patients with IPAH and APAH-CHD from 2014 to 2017 with 328 echocardiographic studies. There were 9 PH patients excluded due to poor image quality (7%). Sixty-five normal pediatric patients served as controls. Table 1 shows the clinical characteristics of PH patients and controls. There were 39 IPAH patients and 86 APAH-CHD patients. Majority of the patients were in WHO-FC I and II. There were 8 IPAH patients in the WHO-FC III-IV and 7 APAH-CHD patients in WHO-FC III-IV. More IPAH patients were on triple therapy compared to APAH-CHD patients. PH patients had lower SV/ESV ratio and FW RVLS compared to controls (0.88±0.18 vs 1.24±0.23, p<0.0001; −22±5 vs −28±4, p<0.0001 respectively) but there were no statistically significant differences between the IPAH and APAH-CHD groups (Table 2 and Figure 1). There was statistically significant difference between the RV volumes in IPAH, APAH-CHD, and controls (Table 2).
Table 1.
Patient Clinical Characteristics
| PH (n = 125) | Control (n = 65) | p-value | |
| Age (yrs.) | 8 (3–12) | 9 (7–13) | 0.1142 |
| Sex (female) | 61 (49%) | 37 (57%) | 0.2373 |
| BSA (m2) | 0.99 (0.63–1.41) | 1.14 (0.9–1.54) | 0.0101 |
| IPAH (39) | APAH-CHD (86) | p-value | |
| Medications | |||
| PDE5i | 34 (87.2%) | 51 (59.3%) | 0.0018 |
| IV Treprostinil | 9 (23.1%) | 1 (1.2%) | 0.0001 |
| SC Treprostinil | 1 (2.6%) | 4 (4.7%) | 0.5812 |
| Inhaled Treprostinil | 3 (7.7%) | 2 (2.3%) | 0.1560 |
| IV Epoprostenol | 1 (2.6%) | 0 (0.0%) | 0.1360 |
| ERA | 25 (64.1%) | 23 (26.7%) | 0.0001 |
| CCB | 7 (17.9%) | 7 (8.1%) | 0.1071 |
| WHO-FC | |||
| I | 14 (36.8%) | 43 (52.4%) | |
| II | 16 (42.1%) | 32 (39.0%) | |
| III | 6 (15.8%) | 6 (7.3%) | |
| IV | 2 (5.3%) | 1 (1.2%) | |
| Type of lesions for APAH-CHD | |||
| ASD s/p repair | 17 (14%) | ||
| VSD s/p repair | 17 (14%) | ||
| AVSD s/p repair | 13 (10%) | ||
| PDA s/p repair | 17 (14%) | ||
| CoA s/p repair | 4 (3%) | ||
| Absent RPA or LPA s/p repair | 6 (5%) | ||
| TGA s/p repair | 1 (1%) | ||
| PAPVR s/p repair | 2 (2%) | ||
| PVS s/p repair | 2 (2%) | ||
| Tricuspid valve dysplasia s/p repair | 1 (1%) | ||
| TAPVR s/p repair | 2 (1%) | ||
| Shone’s Complex s/p repair | 2 (1%) | ||
| Ductus Venosus Occlusion | 2 (1%) |
Data are represented as median (interquartile range), APAH = associated pulmonary arterial hypertension, ASD = atrial septal defect, AVSD = atrioventricular septal defect, CCB = calcium channel blockers, CHD = congenital heart disease, CoA = coarctation of the aorta, ERA = endothelin receptor antagonist, IPAH = idiopathic pulmonary arterial hypertension, LPA = left pulmonary artery, PAPVR = partially anomalous pulmonary venous return, PDA = patent ductus arteriosus, PDEi = phosphodiesterase enzyme inhibitors, PVS = pulmonary venous stenosis, RPA = right pulmonary artery, TGA = transposition of great arteries, VSD = ventricular septal defect, WHO-FC = world health organization – functional class.
Table 2:
Comparison of 3D Volumetric and Functional Indices Between Pulmonary Hypertension Patients and Controls
| IPAH | APAH-CHD | Control | P-value | |
|---|---|---|---|---|
| EDVi (mL/m2) | 85 (63 – 137)* ‡ | 59 (37 – 99)* | 57 (42 – 82) | < 0.0001 |
| ESVi (mL/m2) | 45 (34 – 62)* † | 39 (32 – 47)* | 23 (19 – 28) | < 0.0001 |
| SVi (mL/m2) | 37 (31 – 44)* | 36 (30 – 40)* | 28 (23 – 35) | < 0.0001 |
| EF (%) | 47 (42 – 48)* | 47 (45 – 49)* | 55 (52 – 58) | < 0.0001 |
| SV/ESV | 0.87 (0.72 – 0.92)* | 0.89 (0.83 – 0.96)* | 1.21 (1.09 – 1.41) | < 0.0001 |
| FW RVLS (%) | −21 ± 5* | −22 ± 5* | −28 ± 4 | < 0.0001 |
Data are reported as mean ± SD or median with corresponding IQR.
P < 0.001 from controls;
P < 0.001,
P < 0.01 from APAH-CHD. APAH = associated pulmonary artery hypertension. CHD = congenital heart disease, EDVi = end-diastolic volume indexed, EF = ejection fraction, ESVi = end-systolic volume indexed, FW RVLS = free wall right ventricular longitudinal strain, IPAH = idiopathic pulmonary arterial hypertension, SVi = stroke volume indexed.
Figure 1:
SV/ESV ratio between idiopathic pulmonary arterial hypertension (IPAH), associated pulmonary arterial hypertension with congenital heart disease (APAH-CHD), and controls. There are statistically significant differences between the groups.
RV-Arterial Coupling Ratio and Strain Relationship in PH patients
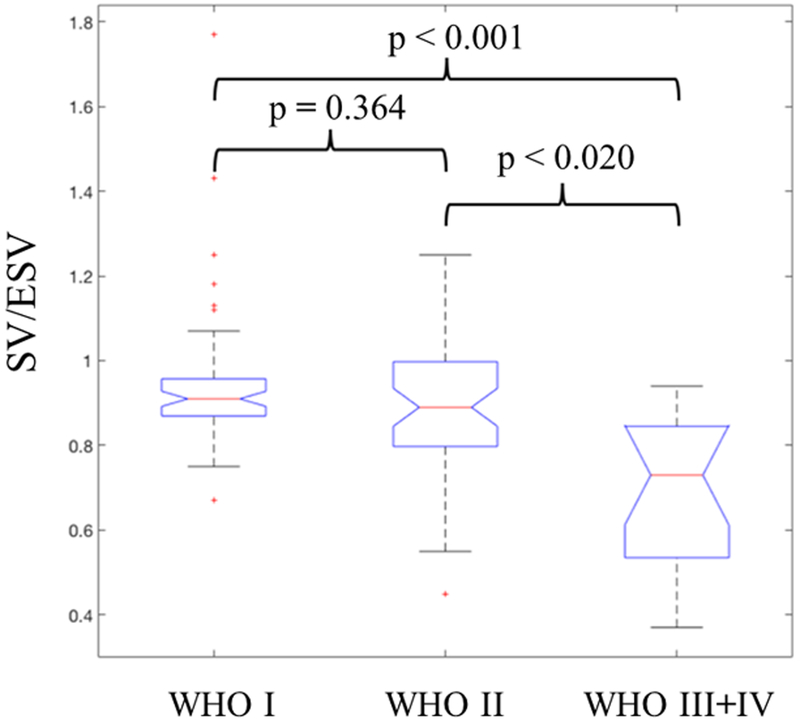
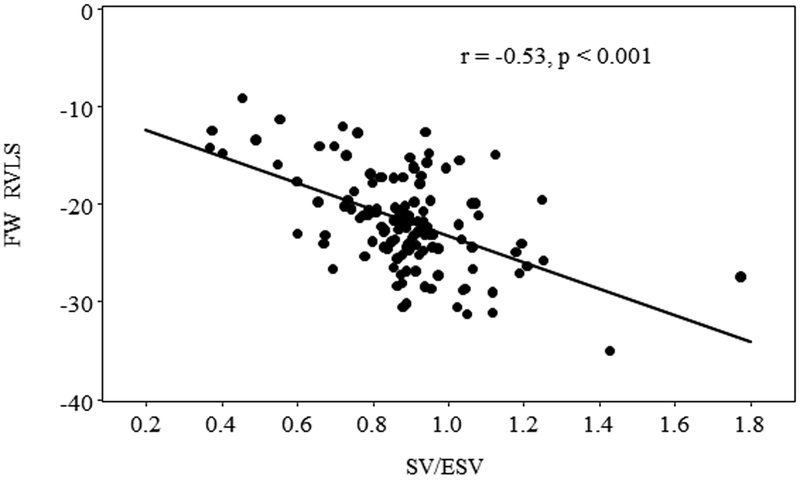
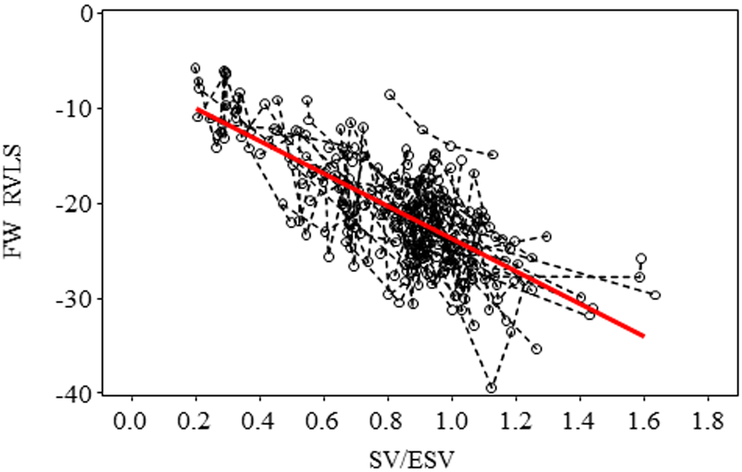
The SV/ESV ratio was found to be lower in PH patients with worse WHO-FC. Table 3 and Figure 2 showed that patients with WHO-FC III +IV had SV/ESV ratio significantly different from I and II (p<0.02 and p<0.001 respectively) but no statistically significant differences between patients of WHO-FC I compared to WHO-FC II (p = 0.364). Although there were statistically significant correlations of SV/ESV to 2D FAC, the correlation was poor (Table 4). 3D FAC had stronger correlation to SV/ESV compared to 2D FAC. There were statistically significant associations between RV SV/ESV to FW RVLS (r = −0.53, p<0.001) (Figure 3). Mixed model analysis using subjects with at least two repeated measures also found the significant negative association between FW RVLS and SV/ESV ratio (Figure 4). Specifically, for every 0.1 increase in SV/ESV, FW RVLS decreased by 1.74% (p <.001).
Table 3:
Comparison of 3D Volumetric and Functional Indices between World Health Organization - Functional Class
| WHO I | WHO II | WHO III+IV | P-value | |
|---|---|---|---|---|
| EDVi (mL/m2) | 67 (59 – 79)* || | 82 (71 – 100) | 112 (88 – 127) | < 0.0001 |
| ESVi (mL/m2) | 36 (30 – 42)* || | 44 (37 – 56) ‡ | 72 (46 – 80) | < 0.0001 |
| SVi (mL/m2) | 32 (26 – 39) †|| | 37 (34 – 45) | 42 (38 – 53) | 0.0008 |
| EF (%) | 48 (47 – 49)* | 47 (44 – 50) † | 42 (34 – 45) | 0.0001 |
| SV/ESV | 0.91 (0.87 – 0.95)* | 0.89 (0.80 – 1.00) † | 0.73 (0.52 – 0.82) | < 0.0001 |
| FW RVLS (%) | −23 ± 4† | −22 ± 5‡ | −18 ± 5 | 0.0087 |
Data are reported as mean ± SD or median with corresponding IQR.
P < 0.001,
P < 0.01,
P < 0.05 from WHO III+IV;
P < 0.01 from WHO II. EDVi end-diastolic volume indexed, EF = ejection fraction, ESVi = end-systolic volume indexed, FW RVLS = free wall right ventricular longitudinal strain, IPAH = idiopathic pulmonary arterial hypertension, SVi = stroke volume indexed, WHO-FC = world health organization functional class.
Figure 2:
SV/ESV ratio are statistically significant different in the respective World Health Organization functional class (WHO-FC) in pulmonary hypertension patients.
Table 4:
Correlation of SV/ESV to right ventricular functional indices
| Correlation with SV/ESV | Correlation with SV/ESV | |||
|---|---|---|---|---|
| Variable | Spearman R | p-value | Pearson R | p-value |
| 2D FAC (%) | 0.26 | 0.001 | 0.43 | 0.001 |
| 3D FAC (%) | 0.62 | 0.001 | 0.70 | 0.001 |
| FW RVLS (%) | −0.43 | 0.001 | −0.53 | 0.001 |
Please see abbreviation in Table 2.
Figure 3:
Pearson correlation of RV SV/ESV ratio to FW RVLS demonstrated inverse relationship.
Figure 4:
Mixed model analysis using subjects with at least two repeated measures also found the significant negative association between FW RVLS and SV/ESV ratio. Raw data of repeated measures from the same subject were connected with a dashed line. Specifically, for every 0.1 increase in SV/ESV, FW RVLS decreased by 1.74% (p <.001).
Clinical Outcome Analysis
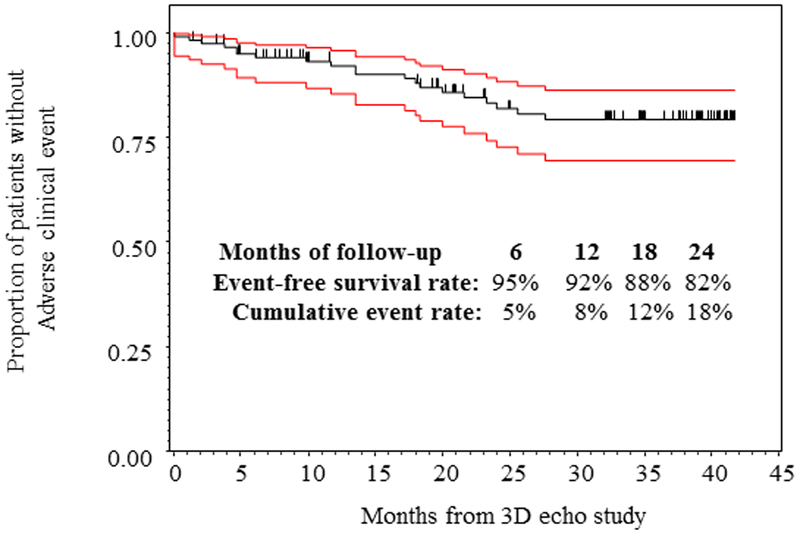
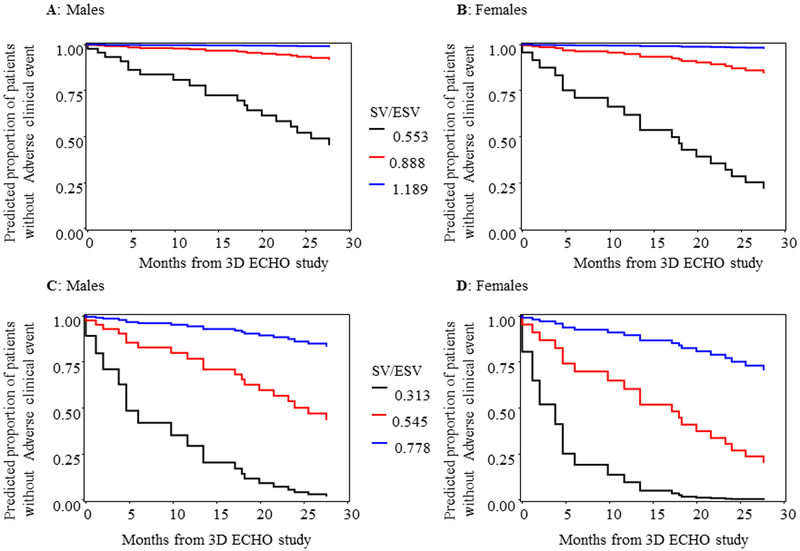
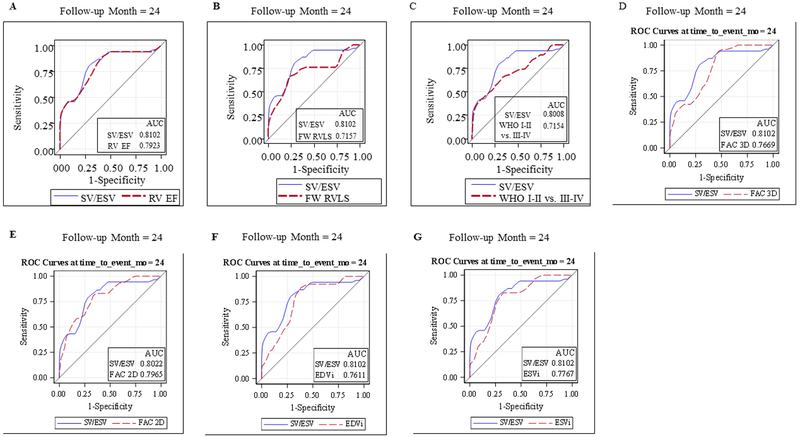
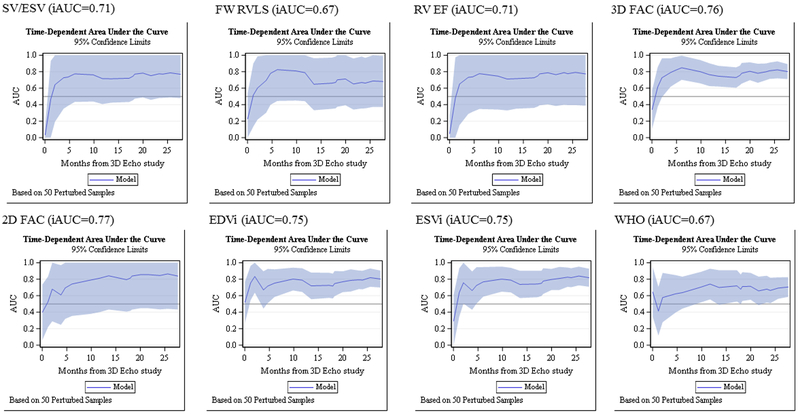
This cohort of 125 PH patients were followed for a median of 18.3 months, ranging 0.03 to 41.7 months. Of 125 enrolled subjects, 67 (54%) had repeated measures. The number of repeated measures range from 2 to 10 with median 3. There 20 adverse clinical events (11 in females and 9 in males). Two patients died, 3 underwent Pott’s shunt, 3 underwent clinically indicated septostomy, 7 were started on IV prostacyclin therapy, and 5 had PAH related hospitalization. Figure 5 demonstrated the Kaplan Meier survival curve of the entire cohort. SV/ESV was a significant predictor for adverse clinical event in Cox regression analysis after adjusting for age, BSA and gender (Figure 6). The adjusted hazard ratio was 0.52 (CI 0.38–0.69) per 0.1 increase in SV/ESV (p< 0.0001), indicating the risk for having an event decreased by 48% per 0.1 increase in SV/ESV. In other words, there is a 1.92-fold increase in risk of adverse clinical event for every 0.1 unit decrease of SV/ESV. Figure 6 depicted several survival curves predicted by Cox model to display different values of SV/ESV ratio after adjusting for age, BSA, and gender. The survival curves were similar in both male and female with different values of SV/ESV ratio (Figure 6). This model is of strong discriminating ability. The Uno’s c-statistic summary for SV/ESV ratio is 0.77 and for other RV parameters are listed in Table 5. Comparison of c-statistics between SV/ESV and each of the other RV parameters shows no significant evidence that SV/ESV is either superior or inferior to other predictors (Table 6). Supplemental Figure 2 depicts the ROC curves from the Cox regression of SV/ESV at time to event at 6, 12, 18, and 24 months. Figure 7 shows the comparison of ROC curves for the SV/ESV, RV EF, FW RVLS, WHO-FC I-II vs III-IV, 2D FAC, 3D FAC, and RV volumes at 24 months. The SV/ESV ratio had the highest area under the curve (AUC) when compared to the other RV measures (Figure 7). The integrated time dependent area under ROC curves is shown in Figure 8. The variability is less in 3D FAC, EDVi, ESVi, and WHO-FC compared to other parameters.
Figure 5:
Kaplan Meier curve demonstrates SV/ESV as a good ratio of adverse clinical events in all patients.
Figure 6:
Predicted survival curves by Cox model different values of SV/ESV after adjusting for age, BSA and gender. For each plot, age and BSA are held to be respective at 8.18 years and 1.0, corresponding to the mean values of PH patients in study data. For A and B, SV/ESV values corresponds to the 5% percentile, median, and 95 % percentile of PH patients. For C and D, SV/ESV values correspond to 2, 3 and 4 standard deviations lower than the mean of the normal subjects (Mean=1.221 and SD = 0.204).
Table 5:
Cox regression analysis and Uno’s concordance statistic of right ventricular parameters adjusted for age, body surface area, and gender
| RV parameters | Uno’s concordance statistic (SEM) | Integrated AUC of ROC curves | Adjusted Hazard Ratio (95% CI)* | Pr > ChiSq† |
|---|---|---|---|---|
| ESVi (mL/m2) | 0.79 (0.05) | 0.75 | 1.04 (1.02, 1.06) | 0.0000003 |
| 3D FAC (%) | 0.79 (0.06) | 0.76 | 0.84 (0.78, 0.90) | 0.0000010 |
| EDVi (mL/m2) | 0.76 (0.06) | 0.75 | 1.03 (1.02, 1.04) | 0.0000023 |
| RV EF (%) | 0.77 (0.06) | 0.71 | 0.83 (0.76, 0.90) | 0.0000060 |
| 2D FAC (%) | 0.80 (0.06) | 0.77 | 0.92 (0.89, 0.96) | 0.0000159 |
| SV/ESV | 0.77 (0.05) | 0.71 | 0.001 (0.00007, 0.03) | 0.0000168 |
| WHO-FC III-IV | 0.71 (0.09) | 0.67 | 5.87 (2.22, 15.50) | 0.0003511 |
| FW RVLS (%) | 0.69 (0.06) | 0.67 | 1.15 (1.04, 1.28) | 0.0048020 |
Hazard ratio per one-unit change in predictor. For WHO it is HR of WHO of 3 or 4 over WHO of 1 or 2.
p-values testing for HR=1 and sorted ascendingly
2D = two dimensional; EDVi end-diastolic volume indexed, EF = ejection fraction, ESVi = end-systolic volume indexed, FAC = fractional area change; FW RVLS = free wall right ventricular longitudinal strain, SVi = stroke volume indexed, WHO-FC = world health organization functional class.
Table 6:
Comparison of C-statistics with SV/ESV based on model adjusting for age, gender and body surface area
| Comparison | Difference in C-statistic | SEM | Chi-Square | P-value |
|---|---|---|---|---|
| SV/ESV -RV EF | −0.0026 | 0.0355 | 0.01 | 0.94 |
| SV/ESV -FW RVLS | 0.0735 | 0.0667 | 1.21 | 0.27 |
| SV/ESV -WHO-FC I-II vs. III-IV | 0.0479 | 0.083 | 0.33 | 0.56 |
| SV/ESV -EDVi | 0.0013 | 0.0613 | 0.00 | 0.98 |
| SV/ESV -ESVi | −0.0243 | 0.0525 | 0.21 | 0.64 |
| SV/ESV −2D FAC | −0.0492 | 0.0656 | 0.56 | 0.45 |
| SV/ESV −3D FAC | −0.0227 | 0.0393 | 0.33 | 0.56 |
2D = two dimensional; EDVi end-diastolic volume indexed, EF = ejection fraction, ESVi = end-systolic volume indexed, FAC = fractional area change; FW RVLS = free wall right ventricular longitudinal strain, SVi = stroke volume indexed, WHO-FC = world health organization functional class.
Figure 7:
Receiver Operating Curves showed that the area under the curve for SV/ESV was highest when compared to RV EF, FW RVLS, WHO I-II versus III-VI, 3D FAC, 2D FAC, EDVi, and ESVi.
Figure 8:
The integrated time-dependent area under the curve is shown for SV/ESV, FW RVLS, RV EF, 3D FAC, 2D FAC, EDVi, ESVi, and WHO-FC.
Further sub-analysis on outcomes was performed in IPAH patients which showed similar outcomes as the entire cohort. There were 15 adverse clinical events in 39 IPAH patients. Supplemental Figure 3 shows the overall survival rate in IPAH patients. The event-free survival rates were 90%, 84%, 74%, and 61% for 6, 12, 18,24 months respectively. After adjusting for age, BSA, and gender, SV/ESV was statistically significant correlated with the event-free survival (Supplemental Figure 4). The hazard ratio was 0.53 (95% CI: 0.37, 0.74) per 0.1 increase in SV/ESV. In other words, the risk to have an event decreased by 47% percent per 0.1 increment in SV/ESV. The integrated time-dependent AUC was 0.84 and the Uno’s concordance statistic is 0.78. The pattern of relationship between event-free survival and SV/ESV ratio was similar to analysis of the entire PH cohort. APAH-CHD patients could not be examined as there are few events in this subgroup.
DISCUSSION
This study demonstrated 1) that pediatric PH patients have worse RV-arterial coupling ratio compared to controls, 2) that they have worse SV/ESV with increasing disease severity, 3) that this ratio has an inverse relationship with RV strain, and 4) SV/ESV can be a predictor of adverse clinical events in pediatric PH. The RV initially adapts to increased afterload by increasing its contractility5, 7, 9. The pulmonary vascular resistance may increase by factor of 4- to 5- fold and coupling is maintained by a 4- to 5- fold increase in contractility of the RV3. An important mechanism to achieve this increase is to increase Ees by ventricular hypertrophy3. The normal adaptation of the RV in the early stages of PH is RV hypertrophy which is beneficial for the systolic function of the RV with only a slight decrease in RV-arterial coupling ratio26. But this adaptation ceases in late stages because of progressively rise in afterload and the SV decreases3. In order to maintain the SV, the RV will dilate3. However, an attempt to maintain cardiac output with decreasing SV, the heart rate will increase. Because Ea = pulmonary vascular resistance x heart rate, the Ea will increase resulting in an Ees/Ea ratio to decrease3. This maladaptation and ventricular-vascular mismatch occur with severe fall in RV-arterial coupling ratio leading to RV failure and death27. Our study using SV/ESV as a volume estimate of RV-arterial coupling ratio demonstrated that PH patients have lower SV/ESV ratio when compared to controls. Although we separated the PH patients into IPAH and APAH-CHD, we did not see a difference in the SV/ESV ratio between these subgroups. PH patients with worse WHO-FC also have lower SV/ESV ratio indicating that SV/ESV can be used as a marker for disease severity.
We demonstrated that the SV/ESV ratio is associated with free wall RVLS. As RV-arterial coupling ratio decrease, so does the function of the RV. This inverse relationship is maintained over time with repeated measures as shown in Figure 4. Previous studies have shown that RV strain may be a potential early marker of prognosis before other RV functional indices are abnormal17, 18. The association of SV/ESV with RV strain may also indicate that SV/ESV ratio may also be an early marker of prognosis. Further as PH progresses, SV/ESV is a better predictor of adverse events than free wall RVLS as demonstrated in Figure 7. We found poor correlation of SV/ESV to 2D FAC likely because SV/ESV is a volume estimate of the RV-arterial coupling whereas 2D FAC is an estimated measure of RV function. The FAC derived from 3D dataset had better correlation to SV/ESV because the cut plane of the 2D image derived from the 3D dataset is constant whereas the angulation of the probe while acquiring 2D image of the 4-chamber view may vary between sonographers when obtaining 2D FAC.
SV/ESV ratio can be a predictor of adverse clinical events in our pediatric PH patients. Vanderpool et al described using this ratio derived from CMRI to predict outcomes in adults with PH7. Truong et al described using this ratio from CMRI in 17 pediatric PH patients and demonstrated that this ratio was feasible from CMRI when compared to cardiac catheterization single beat method6. Because cardiac catheterization is invasive and CMRI requires anesthesia in children, a noninvasive evaluation of the cardiopulmonary vascular unit using 3DE is desirable and could provide earlier detection of RV failure. 3DE can be obtained at the bedside and is easily performed. Our study demonstrated that for every increase in 0.1 unit of SV/ESV ratio, there is a decrease of 48% of having adverse clinical events. This ratio is also sensitive and specific in detecting adverse clinical events in pediatric PH patients. Similar results were found when stratifying PH patients to IPAH group when evaluating for outcomes.
Although RV EF and RV strain allow for quantification of RV function, an understanding of the afterload effect on the RV is valuable and may add incremental value to RV functional measures alone. Both RV EF and RV strain are load dependent measures whereas Ees is a load independent measure of ventricular function and Ea is a measure of afterload faced by the RV2, 3, 28. Coupling can be assessed from the ratio between Ees/Ea and is a measure of energy transfer from the RV to the pulmonary arteries3. The volume method using SV/ESV as an estimate of RV-arterial coupling ratio of Ees/Ea was demonstrated by Sanz et al and subsequently by Vanderpool et al7, 9. In Vanderpool’s study, the SV/ESV was prognostically superior to invasive measurements provided by right heart catheterization7. Brewis et al subsequently demonstrated that SV/ESV predicted outcomes better in adult PH patients than using invasive measurements8. Our study is the first to use 3DE to evaluate RV-arterial coupling ratio in pediatric PH. Although we demonstrated in our prior work that RV EF and strain are good predictors of outcome in pediatric PH, the AUCs are not as high as it is for SV/ESV ratio in the current study as demonstrated in Figure 8 and in our prior study25. Vanderpool et al found that SV/ESV may be more sensitive than EF to changes in RV function in more severe PH22. This ratio includes the information about RV EF but in a less preload dependent manner29, 30. This ratio also allows for understanding of cardiopulmonary vascular unit as a whole system and the effect of afterload to the RV in PH patients. Further studies to use this SV/ESV ratio to evaluate treatment effectiveness and to follow patients over time would need to be explored in pediatric PH.
Limitations:
This study has the following limitations. First, we used a big size probe of the Siemens machine and single beat 3DE because it does not require breath hold in pediatric patients. Despite this limitation, single beat 3DE acquisition generated from the Siemens machine has a higher volume rate than other vendor machines and is advantageous over traditional disk summation that require serial heartbeat acquisitions resulting in stitch artifacts. The development of a pediatric 3D transthoracic probe for single beat acquisition could help resolve the technical limitations. Second, limitations to this study include those inherent to a retrospective study. Third, the volume method of SV/ESV is an Ees/Ea ratio simplified for pressure. This ratio assumes that RV volume at zero filling pressure would be equal to zero which is unrealistic and SV/ESV will underestimate the true Ees/Ea31. However, studies have shown that SV/ESV have outperformed pressure measurements of RV-arterial coupling ratio in predicting outcomes in PH patients7, 8.
CONCLUSIONS
Progressive increase in afterload causes RV dysfunction in pediatric PH patients. SV/ESV as a volume estimate of RV-arterial coupling ratio correlates with RV strain and is a strong predictor of adverse clinical events in pediatric PH.
Supplementary Material
Clinical Summary.
We investigated right ventricular (RV) -arterial coupling ratio using stroke volume to end-systolic volume (SV/ESV) in pediatric pulmonary hypertension (PH) patients compared to normal controls and to disease severity. We correlated SV/ESV to RV strain and evaluated SV/ESV as a predictor of outcomes in pediatric PH. Our results demonstrated that SV/ESV ratio is decreased compared to controls and with disease severity. SV/ESV as a volume estimate of RV-arterial coupling ratio correlates with RV strain and is a strong predictor of adverse clinical events in pediatric PH. This ratio may provide incremental value to RV functional measures alone because it allows for understanding of cardiopulmonary vascular unit as a whole system and the effect of afterload to the RV in PH patients.
Acknowledgments
Sources of Funding: This study is support by the Jayden DeLuca Foundation; the Leah Bult Foundation; the Frederick and Margaret L Weyerhaeuser Foundation. This study is also supported by NIH/NCATS Colorado CTSA Grant Number UL1 TR001082.
Footnotes
Disclosures: None
REFERENCES:
- 1.Ivy DD, Abman SH, Barst RJ, Berger RM, Bonnet D, Fleming TR, Haworth SG, Raj JU, Rosenzweig EB, Schulze Neick I, Steinhorn RH, Beghetti M. Pediatric pulmonary hypertension. J Am Coll Cardiol. 2013;62:D117–126 [DOI] [PubMed] [Google Scholar]
- 2.Vonk Noordegraaf A, Haddad F, Bogaard HJ, Hassoun PM. Noninvasive imaging in the assessment of the cardiopulmonary vascular unit. Circulation. 2015;131:899–913 [DOI] [PubMed] [Google Scholar]
- 3.Vonk Noordegraaf A, Westerhof BE, Westerhof N. The relationship between the right ventricle and its load in pulmonary hypertension. J Am Coll Cardiol. 2017;69:236–243 [DOI] [PubMed] [Google Scholar]
- 4.Fraisse A, Jais X, Schleich JM, di Filippo S, Maragnes P, Beghetti M, Gressin V, Voisin M, Dauphin C, Clerson P, Godart F, Bonnet D. Characteristics and prospective 2-year follow-up of children with pulmonary arterial hypertension in france. Arch Cardiovasc Dis. 2010;103:66–74 [DOI] [PubMed] [Google Scholar]
- 5.Brimioulle S, Wauthy P, Ewalenko P, Rondelet B, Vermeulen F, Kerbaul F, Naeije R. Single-beat estimation of right ventricular end-systolic pressure-volume relationship. Am J Physiol Heart Circ Physiol. 2003;284:H1625–1630 [DOI] [PubMed] [Google Scholar]
- 6.Truong U, Patel S, Kheyfets V, Dunning J, Fonseca B, Barker AJ, Ivy D, Shandas R, Hunter K. Non-invasive determination by cardiovascular magnetic resonance of right ventricular-vascular coupling in children and adolescents with pulmonary hypertension. J Cardiovasc Magn Reson. 2015;17:81. [DOI] [PMC free article] [PubMed] [Google Scholar]
- 7.Vanderpool RR, Pinsky MR, Naeije R, Deible C, Kosaraju V, Bunner C, Mathier MA, Lacomis J, Champion HC, Simon MA. Rv-pulmonary arterial coupling predicts outcome in patients referred for pulmonary hypertension. Heart. 2015;101:37–43 [DOI] [PMC free article] [PubMed] [Google Scholar]
- 8.Brewis MJ, Bellofiore A, Vanderpool RR, Chesler NC, Johnson MK, Naeije R, Peacock AJ. Imaging right ventricular function to predict outcome in pulmonary arterial hypertension. Int J Cardiol. 2016;218:206–211 [DOI] [PMC free article] [PubMed] [Google Scholar]
- 9.Sanz J, Garcia-Alvarez A, Fernandez-Friera L, Nair A, Mirelis JG, Sawit ST, Pinney S, Fuster V. Right ventriculo-arterial coupling in pulmonary hypertension: A magnetic resonance study. Heart. 2012;98:238–243 [DOI] [PubMed] [Google Scholar]
- 10.Jone PN, Patel SS, Cassidy C, Ivy DD. Three-dimensional echocardiography of right ventricular function correlates with severity of pediatric pulmonary hypertension. Congenit Heart Dis. 2016;11:562–569 [DOI] [PubMed] [Google Scholar]
- 11.Lu X, Nadvoretskiy V, Bu L, Stolpen A, Ayres N, Pignatelli RH, Kovalchin JP, Grenier M, Klas B, Ge S. Accuracy and reproducibility of real-time three-dimensional echocardiography for assessment of right ventricular volumes and ejection fraction in children. J Am Soc Echocardiogr. 2008;21:84–89 [DOI] [PubMed] [Google Scholar]
- 12.Okumura K, Humpl T, Dragulescu A, Mertens L, Friedberg MK. Longitudinal assessment of right ventricular myocardial strain in relation to transplant-free survival in children with idiopathic pulmonary hypertension. J Am Soc Echocardiogr. 2014;27:1344–1351 [DOI] [PubMed] [Google Scholar]
- 13.Hardegree EL, Sachdev A, Villarraga HR, Frantz RP, McGoon MD, Kushwaha SS, Hsiao JF, McCully RB, Oh JK, Pellikka PA, Kane GC. Role of serial quantitative assessment of right ventricular function by strain in pulmonary arterial hypertension. Am J Cardiol. 2013;111:143–148 [DOI] [PubMed] [Google Scholar]
- 14.Jone PN, Schafer M, Pan Z, Bremen C, Ivy DD. 3d echocardiographic evaluation of right ventricular function and strain: A prognostic study in paediatric pulmonary hypertension. Eur Heart J Cardiovasc Imaging. 2018;19:1026–1033 [DOI] [PubMed] [Google Scholar]
- 15.Badagliacca R, Poscia R, Pezzuto B, Papa S, Reali M, Pesce F, Manzi G, Gianfrilli D, Ciciarello F, Sciomer S, Biondi-Zoccai G, Torre R, Fedele F, Vizza CD. Prognostic relevance of right heart reverse remodeling in idiopathic pulmonary arterial hypertension. J Heart Lung Transplant. 2017. October 2 pii: S1053–2498(17)32041–7. doi: 10.1016/j.healun.2017.09.026 [DOI] [PubMed] [Google Scholar]
- 16.Haddad F, Spruijt OA, Denault AY, Mercier O, Brunner N, Furman D, Fadel E, Bogaard HJ, Schnittger I, Vrtovec B, Wu JC, de Jesus Perez V, Vonk-Noordegraaf A, Zamanian RT. Right heart score for predicting outcome in idiopathic, familial, or drug- and toxin-associated pulmonary arterial hypertension. JACC Cardiovasc Imaging. 2015;8:627–638 [DOI] [PMC free article] [PubMed] [Google Scholar]
- 17.Motoji Y, Tanaka H, Fukuda Y, Ryo K, Emoto N, Kawai H, Hirata K. Efficacy of right ventricular free-wall longitudinal speckle-tracking strain for predicting long-term outcome in patients with pulmonary hypertension. Circ J. 2013;77:756–763 [DOI] [PubMed] [Google Scholar]
- 18.Sato T, Ambale-Venkatesh B, Lima JAC, Zimmerman SL, Tedford RJ, Fujii T, Hulme OL, Pullins EH, Corona-Villalobos CP, Zamanian RT, Minai OA, Girgis RE, Chin K, Khair R, Damico RL, Kolb TM, Mathai SC, Hassoun PM. The impact of ambrisentan and tadalafil upfront combination therapy on cardiac function in scleroderma associated pulmonary arterial hypertension patients: Cardiac magnetic resonance feature tracking study. Pulm Circ. 2018;8:2045893217748307. [DOI] [PMC free article] [PubMed] [Google Scholar]
- 19.Suga H, Sagawa K, Shoukas AA. Load independence of the instantaneous pressure-volume ratio of the canine left ventricle and effects of epinephrine and heart rate on the ratio. Circ Res. 1973;32:314–322 [DOI] [PubMed] [Google Scholar]
- 20.Sunagawa K, Yamada A, Senda Y, Kikuchi Y, Nakamura M, Shibahara T, Nose Y. Estimation of the hydromotive source pressure from ejecting beats of the left ventricle. IEEE Trans Biomed Eng. 1980;27:299–305 [DOI] [PubMed] [Google Scholar]
- 21.Senzaki H, Chen CH, Kass DA. Single-beat estimation of end-systolic pressure-volume relation in humans. A new method with the potential for noninvasive application. Circulation. 1996;94:2497–2506 [DOI] [PubMed] [Google Scholar]
- 22.Vanderpool RR, Rischard F, Naeije R, Hunter K, Simon MA. Simple functional imaging of the right ventricle in pulmonary hypertension: Can right ventricular ejection fraction be improved? Int J Cardiol. 2016;223:93–94 [DOI] [PMC free article] [PubMed] [Google Scholar]
- 23.Galie N, Barbera JA, Frost AE, Ghofrani HA, Hoeper MM, McLaughlin VV, Peacock AJ, Simonneau G, Vachiery JL, Grunig E, Oudiz RJ, Vonk-Noordegraaf A, White RJ, Blair C, Gillies H, Miller KL, Harris JH, Langley J, Rubin LJ. Initial use of ambrisentan plus tadalafil in pulmonary arterial hypertension. N Engl J Med. 2015;373:834–844 [DOI] [PubMed] [Google Scholar]
- 24.Uno H, Cai T, Pencina MJ, D’Agostino RB, Wei LJ. On the c-statistics for evaluating overall adequacy of risk prediction procedures with censored survival data. Stat Med. 2011;30:1105–1117 [DOI] [PMC free article] [PubMed] [Google Scholar]
- 25.Jone PN, Schafer M, Pan Z, Bremen C, Ivy DD. 3d echocardiographic evaluation of right ventricular function and strain: A prognostic study in paediatric pulmonary hypertension. Eur Heart J Cardiovasc Imaging. 2017 [DOI] [PubMed] [Google Scholar]
- 26.Aversano T, Maughan WL, Sunagawa K, Becker LC. Effect of afterload resistance on end-systolic pressure-thickness relationship. Am J Physiol. 1988;254:H658–663 [DOI] [PubMed] [Google Scholar]
- 27.Sano M, Minamino T, Toko H, Miyauchi H, Orimo M, Qin Y, Akazawa H, Tateno K, Kayama Y, Harada M, Shimizu I, Asahara T, Hamada H, Tomita S, Molkentin JD, Zou Y, Komuro I. P53-induced inhibition of hif-1 causes cardiac dysfunction during pressure overload. Nature. 2007;446:444–448 [DOI] [PubMed] [Google Scholar]
- 28.Champion HC, Michelakis ED, Hassoun PM. Comprehensive invasive and noninvasive approach to the right ventricle-pulmonary circulation unit: State of the art and clinical and research implications. Circulation. 2009;120:992–1007 [DOI] [PubMed] [Google Scholar]
- 29.Naeije R, Brimioulle S, Dewachter L. Biomechanics of the right ventricle in health and disease (2013 grover conference series). Pulm Circ. 2014;4:395–406 [DOI] [PMC free article] [PubMed] [Google Scholar]
- 30.Vonk-Noordegraaf A, Westerhof N. Describing right ventricular function. Eur Respir J. 2013;41:1419–1423 [DOI] [PubMed] [Google Scholar]
- 31.Trip P, Kind T, van de Veerdonk MC, Marcus JT, de Man FS, Westerhof N, Vonk-Noordegraaf A. Accurate assessment of load-independent right ventricular systolic function in patients with pulmonary hypertension. J Heart Lung Transplant. 2013;32:50–55. [DOI] [PubMed] [Google Scholar]
Associated Data
This section collects any data citations, data availability statements, or supplementary materials included in this article.


