

Abstract
Ageing results in loss of tissue homeostasis across taxa1. In the intestine of Drosophila melanogaster, ageing is correlated with an increase in intestinal stem cell (ISC) proliferation, a block in terminal differentiation of progenitor cells, activation of inflammatory pathways, and increased intestinal permeability2. However, causal relationships between these phenotypes remain unclear. Here, we demonstrate that ageing results in altered localization and expression of septate junction proteins in the posterior midgut, which is quite pronounced in differentiated enterocytes (ECs) at tricellular junctions (TCJs). Acute loss of the TCJ protein Gliotactin (Gli) in ECs results in increased ISC proliferation and a block in differentiation in intestines from young flies, demonstrating that compromised TCJ function is sufficient to alter ISC behaviour in a non-autonomous manner. Blocking the Jun N-terminal kinase signalling pathway is sufficient to suppress changes in ISC behaviour, but has no effect on loss of intestinal barrier function, as a consequence of Gli depletion. Our work demonstrates a pivotal link between TCJs, stem cell behaviour, and intestinal homeostasis and provides insights into causes of age-onset and gastrointestinal diseases.
The intestinal epithelium provides a selective barrier that permits nutrient and water transport, while preventing uptake of harmful environmental toxins and microbial contamination of interstitial tissues3. In addition to its barrier function, the intestinal epithelium serves essential roles in metabolism and immunity. Highly specialized intercellular occluding junctions, referred to as tight junctions in chordates and septate junctions (SJs) in arthropods, maintain this critical barrier. The Drosophila midgut epithelium is composed of intestinal stem cells (ISCs) that self-renew to maintain the ISC pool and produce daughter cells, known as enteroblasts (EBs), which can differentiate into either secretory enteroendocrine (EE) cells or absorptive enterocytes (ECs) (Supplementary Fig. 1A)4,5. In the Drosophila midgut, SJs exist between adjacent ECs and between ECs and EE cells, both of which are located apically and are in contact with the intestinal lumen (Fig. 1a and Supplementary Fig. 1A). Therefore, we hypothesized that age-related changes in SJs could directly contribute to loss of intestinal barrier function. Furthermore, given the significant role that differentiated cells play in regulating ISC behaviour in the intestine6,7, we speculated that changes in SJs could contribute in a non-autonomous manner to altered ISC behaviour over time.
Figure 1.
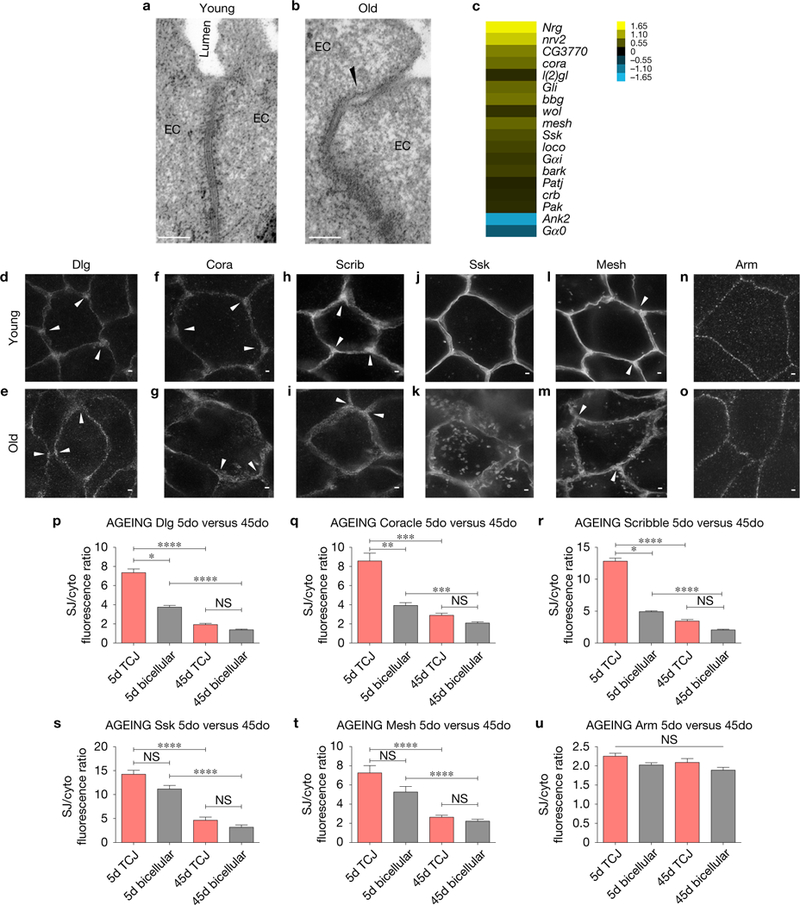
Age-related changes in SJs in posterior midguts from aged flies. (a,b) Electron micrographs showing a gap at the SJ (arrowhead) between ECs in an intestine from a 45do fly (b) compared with the SJ between adjacent ECs in a gut from a 5do fly (a); 6 midguts per condition (10 EC/EC SJs were observed per midgut). Scale bars, 0.1 μm. (c) Expression heatmap of representative changes in gene expression (old/young) of genes encoding SJs or SJ assembly components that change with age. (d–o) Stimulated emission depletion (STED) images comparing SJ protein localization in ECs in young (10do) or aged (45do) midguts. SJ protein mis-localization is observed in old ECs, represented by thicker bicellular junctions, disappearance of enriched SJ protein localization at TCJs (arrowheads, d,f,h,l compared with e,g,i,m respectively) and an increase in cytoplasmic localization (k,m compared with j,l respectively). (n,o) STED images showing the AJ protein Arm is not affected by ageing. >14 midguts per condition; 10 ECs were observed per midgut. Samples were dissected and stained in parallel under the same conditions, pictures were taken at the same laser intensity. (p–u) TCJ/cytoplasm (red) and bicellular SJ/cytoplasm (grey) fluorescence ratios for different SJ and AJ components. Data were analysed with one-way ANOVA/Tukey’s multiple comparisons test and the error bars represent the s.e.m. range of those averages. ****, P <0.0001, ***, P <0.001,**, P <0.01, *, P <0.05 represent a statistically significant difference. NS, not significant. (p) Discs large (5do n = 20; 45do n = 19). (q) Coracle (5do n = 27; 45do n = 22). (r) Scribble (5do n = 20; 45do n = 21). (s) Snakeskin (5do n = 21; 45do n = 20). (t) Mesh (5do n = 21; 45do n = 21). (u) Armadillo (5do n = 20; 45do n = 21). Each data point (n = midguts) represents an average fluorescence intensity ratio from 2–7 independent measurements per midgut and the error bars represent the s.e.m. of those averages. Scale bars, 1 μm.
Consistent with the loss of barrier function in older animals8,9, electron microscopy revealed distinct gaps in SJs between adjacent ECs in midguts from old wild-type (WT) flies, which were not observed in midguts from young flies (Fig. 1a,b). To determine whether the compromised SJ function in aged intestines could be due to decreased gene expression, RNA-seq analysis was performed on posterior midguts from young (5-day-old (5do)) and old (45do) flies. These data revealed that 38% (18/48) of genes annotated as being involved in SJs or SJ assembly (Gene Ontology terms GO:0005918 and GO:00019991) exhibited changes in expression (Fig. 1c and Supplementary Table 1), and an enriched analysis of the data set revealed that the ‘cell adhesion’ gene ontology (GO) category was one of the most representative GO categories that change with age (Supplementary Table 1). The expression level of the majority of these genes (16 of 18) was upregulated in old flies, indicating that decreased transcription is not a primary mechanism contributing to age-related changes in SJs in the midgut.
In Drosophila, SJs are divided into two classes based on morphological appearance: pleated SJs are found in ectodermally derived tissues, such as the hindgut, while smooth SJs are observed in endodermally derived tissues, including the midgut10. To evaluate possible age-related changes in SJ protein localization or expression, confocal and super-resolution immunofluorescence microscopy were used to visualize smooth and pleated SJ proteins in midguts and hindguts, respectively (Fig. 1d–m and Supplementary Fig. 1B–O,R,S). In 45do flies, significant changes in the SJ proteins Discs large (Dlg), Coracle (Cora), Scribble (Scrib), Snakeskin (Ssk) and Mesh were observed in the midgut: Dlg, Cora and Scrib showed decreased staining intensity, due to an apparent separation of adjacent cell membranes, while Ssk and Mesh appeared to accumulate in the cytoplasm (Fig. 1d–m). These changes were quantified by measuring the ratio of staining intensities at the membrane (SJ/cytoplasm) (Fig. 1p–t). In contrast, Dlg, Cora and Scrib levels were not decreased in the hindgut (Supplementary Fig. 1J–O). Furthermore, levels of Armadillo (Arm), an adherens junction (AJ) component, did not appear affected by age in midguts or hindguts (Fig. 1n,o,u and Supplementary Fig. 1R,S).
One striking and consistent age-related change in SJs was observed at tricellular junctions (TCJs) (arrowheads, Fig. 1d–i,l,m; quantified in p–t), the specialized junction at the conjunction of three cells11. Gliotactin (Gli) is one of two SJ proteins that have been described in Drosophila to localize to the TCJ12–14, and Gli has been demonstrated to play a role in the developing nervous system15 and imaginal discs12,16. However, a role in the adult intestine has not yet been evaluated.
In the adult posterior midgut, Gli co-localized with Dlg (Fig. 2a–b′ and Supplementary Fig. 2A-A″), as described previously in wing discs16,17. Gli protein was clearly detected at EC–EC and EC–EE cell TCJs (Fig. 2a,c,f); however, no Gli protein was detected in ISCs/EBs (Fig. 2d). In midguts from aged flies, Gli localization was largely absent from the TCJ, and protein levels were increased in the cytoplasm (Fig. 2f–h). In hindguts, no changes in Gli localization or protein levels were observed, similar to our observation for other SJ proteins (Supplementary Fig. 1P,Q). Interestingly, Dlg showed strong localization to both the plasma membrane and cytoplasm in ISC/EB ‘nests’, but Dlg did not appear to localize apically within the membrane in these cells, suggesting that definitive SJs may be absent between ISC/EBs and that formation of SJs is coordinated with differentiation. Consistent with this hypothesis, SJs were not apparent between ISCs and EBs via electron microscopy (Fig. 2e).
Figure 2.
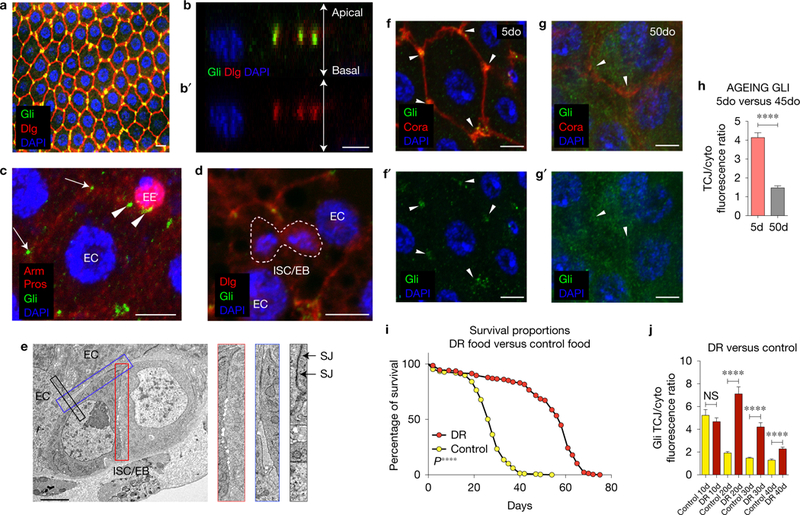
Gliotactin is located at the TCJ in differentiated cells in the intestine. (a) Confocal image of posterior midgut showing the localization of Gli-GFP (green) at the TCJ. Scale bar, 10 μm; image representative of 11 samples. (b,b′) Protein localization along the apical-basal axis; note co-localization of Gli-GFP (green) with Dlg (red). Scale bar, 5 μm. (c) Gli (green) is localized at the TCJ of ECs (arrows) and in EEs (arrowheads, marked by Prospero in red). Arm (red) localizes to the AJ in all cells. Scale bar, 5 μm; image representative of 10 samples. (d) Gli does not co-localize with Dlg, which appears cytoplasmic, in ISC/EB nests (dashed line). Scale bar, 5 μm; image representative of 10 samples. (e) Electron micrograph of an ISC/EB nest. SJs are apparent between ECs (black box), but not between ISC/EBs (red box). Blue box, ISC/EB-EC contacts. Image representative of 11 midguts (5 ISC/EB nests were observed per midgut), Scale bar, 1 μm. (f–g′) Gli is mis-localized from TCJs (arrowheads) in posterior midguts from 50do flies; scale bars, 5 μm. Samples were dissected and stained in parallel under the same conditions; pictures were taken at the same laser intensity. (h) Fluorescence intensity ratio of Gli at TCJ/cytoplasm in ECs from young and old flies (n = 27 5do, n = 22 45do midguts). Asterisks represent a statistically significant difference using an unpaired Student’s t-test, two tailed (****, P < 0.0001). Error bars represent the s.e.m. range of those averages. (i) Lifespan curves for female flies raised on conventional food (yellow) (n = 294) or DR food (red) (n = 223). T50 and total lifespan were significantly lower in controls compared with DR. Data were analysed with a non-parametric log-rank (Mantel-Cox) test; ***P <0.0001, represents a statistically significant difference. (j) TCJ/cytoplasm fluorescence ratio for Gli shows a slower decrease in DR flies (red) than in control (yellow). 10do Ctrl n = 20 midguts; 10do DR n D 18; 20do Ctrl n D 35; 20do DR n = 29; 30do Ctrl n = 22; 30do DR n = 22; 40do Ctrl n = 15; 40do DR n = 23. Data were analysed with unpaired Student’s t-test, two tailed; error bars represent the s.e.m. range of those averages., ***P < 0.0001. NS, not significant. Each data point (n = midguts) represents an average fluorescence intensity ratio from 2–7 independent measurements per midgut; error bars represent the s.e.m. range of those averages.
Given the significant changes in TCJs (Fig. 1d–m,p–t) and the striking loss of Gli from TCJs in older animals (Fig. 2g,h), we tested whether these changes were, indeed, a consequence of ageing. Dietary restriction (DR) is the most robust and reproducible intervention known to slow ageing across species18. Changes in Gli localization were delayed in long-lived, DR flies, when compared with controls, indicating that physiological age was a significant factor contributing to changes in TCJs (Fig. 2i,j).
To determine whether compromised TCJ function could contribute to age-related changes in the intestine, Gli was depleted from TCJs using a drug-inducible version of the GAL4-UAS system19,20. Targeted gene expression using the 5966GS GAL4 ‘driver’ is observed in adult ECs when flies are fed the progesterone analogue RU486; addition of ethanol is used as a control, providing cohorts of isogenic individuals with or without induction of a GliRNAi transgene. Efficacy of GliRNAi was confirmed by immunostaining and quantitative PCR with reverse transcription (RT–qPCR; (Supplementary Fig. 2B–D).
Depletion of Gli from ECs resulted in an accelerated loss of barrier integrity (Fig. 3a and Supplementary Fig. 2E). Integrity of the intestinal barrier can be assayed by feeding flies a non-absorbable blue food dye. When the intestinal barrier is intact, the dye is retained within the intestine, whereas loss of barrier integrity results in spreading of blue dye throughout the haemolymph (generating ‘Smurf’ flies)8,9. Reduced Gli expression in ECs led to a significant increase in ‘Smurf’ flies as early as 12 days after GliRNAi expression, when compared with age-matched controls (Fig. 3a and Supplementary Fig. 2E). Electron microscopy analysis of midguts from 23do flies revealed no noticeable changes in SJ structure at bicellular junctions when Gli was depleted from ECs (Supplementary Fig. 2F,G), indicating that loss of barrier function was due to disruption of TCJs, rather than disruption of the entire SJ. At 40 days, 94.7% of the GliRNAi population exhibited the ‘Smurf ‘ phenotype, compared with 57.1% of controls (Fig. 3a), with a concomitant decrease in median lifespan (Supplementary Fig. 2H).
Figure 3.
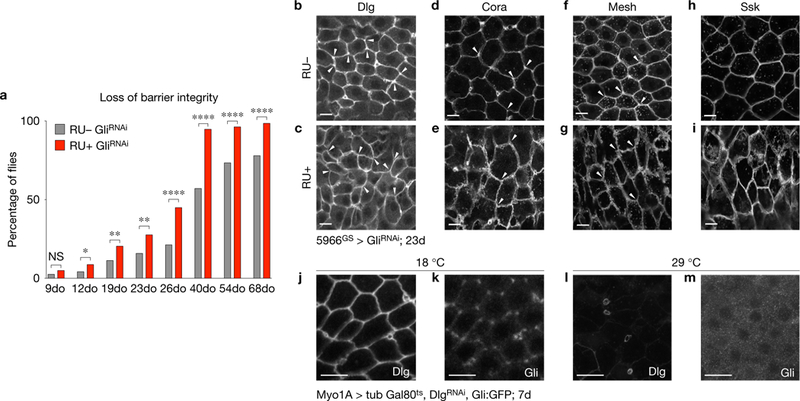
Loss of Gliotactin in ECs leads to loss of intestinal barrier integrity. (a) Flies with reduced Gli expression (5966GS GAL4/UAS-GliRNAi, RUC, n = 265) show acceleration of loss of barrier integrity, when compared with controls (5966GS GAL4/UAS-GliRNAi ethanol-fed, RU, n = 240 flies). Asterisks represent a statistically significant difference in pairwise post-test comparisons, indicated by the corresponding bars (***P < 0.0001; **P <0.001 and *P < 0.05; Fisher’s exact test; two tailed; NS, not significant). (b–i) Confocal images of posterior midguts from 23do flies. Loss of Gli in ECs did not affect the levels of SJ proteins Dlg (c), Cora (e), Mesh (g) or Ssk (i), although disruption of the TCJ and mis-localization of SJ proteins was observed, compared with respective controls (b,d,f,h) (TCJ marked by arrowheads in b–g). Samples were dissected and stained in parallel under the same conditions; pictures were taken at the same laser intensity. Images are representative of at least 16 midguts. (j–m) Depletion of dlg induced in ECs with Myo1A-GAL4 GAL80ts UAS-dlgRNAi for 7 days. At 29 °C Dlg is reduced from ECs but maintained in EEs (l), while Gli is completely lost from TCJs (m) compared with controls maintained at 18 °C (j,k). Scale bars, 10 μm.
Following Gli depletion from ECs for 23 days, the localization of SJ proteins was altered similar to what was observed in intestines from aged flies (compare Fig. 1d–m with Fig. 3c,e,g,i). Neither protein levels nor localization was affected in controls (Fig. 3b,d,f,h). In epithelia of imaginal discs, Dlg is needed to recruit Gli into TCJs, but not vice versa16. This relationship is maintained in the midgut, as depletion of Gli had only a modest affect on TCJ Dlg enrichment (arrowheads, Fig. 3b,c), whereas depletion of Dlg from ECs led to a complete loss of Gli from TCJs (Fig. 3j m). Altogether, these data indicate that depletion of Gli from the TCJ, rather than mis-localization of Dlg and complete disruption of SJs, is sufficient to trigger loss of barrier integrity.
In the Drosophila midgut, ageing, stress, or increased inflammation promotes an increase in ISC proliferation, combined with an accumulation of mis-differentiated daughter cells that express hallmarks of both ISCs and terminally differentiated enterocytes2,6,7,21,22. A statistically significant increase in the number of cells expressing the ISC/EB marker Esg was observed following Gli depletion from ECs for 9 days (Fig. 4c–e). In addition, an increase in ISC proliferation was observed, based on the mitosis marker phosphorylated histone H3 (PH3) (Fig. 4d,f). Similar results were obtained using two additional GliRNAi lines (Supplementary Fig. 3A–D). After 9 days of Gli depletion, flies were shifted onto RU – food to re-initiate Gli expression for 11 days. Re-expression of Gli in ECs resulted in resumption of normal ISC behaviour (Supplementary Fig. 3G–K), indicating that changes in ISCs are directly correlated with the presence of Gli and that loss of TCJ integrity is reversible under these conditions. Depletion of Gli specifically from EEs did not result in any changes in ISC behaviour (Supplementary Fig. 3L). Reduced expression of Dlg in ECs resulted in similar effects on ISC behaviour (Supplementary Fig. 3E,F). However, as noted above, depletion of Dlg resulted in a complete loss of Gli from TCJs; therefore, the effects of Dlg depletion cannot be uncoupled from an effect on Gli. These data indicate that depletion of Gli from differentiated ECs is sufficient to induce age-related phenotypes, including loss of barrier function and changes in ISC behaviour, in intestines of young flies.
Figure 4.
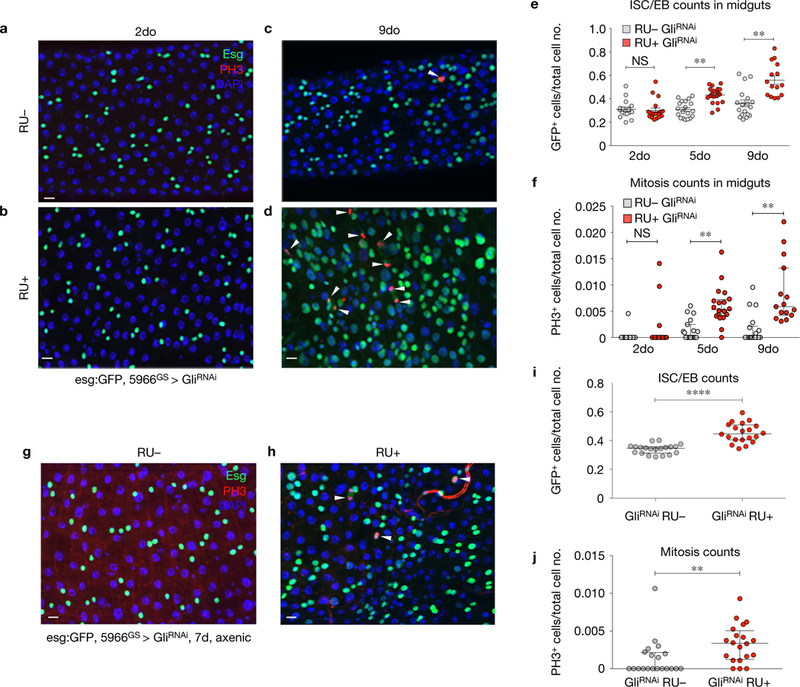
Loss of Gliotactin in ECs induces ISC proliferation and accumulation of esg+ cells. (a–f) Posterior midguts from Su(H)LacZ; 5966GS GAL4, esg:GFP/UAS-GliRNAi flies after 2d (a,b) or 9d (c,d). Gli knockdown causes an increase in esg+ ISC/EBs (marked by esg:GFP, green) and ISC proliferation (marked by arrowheads PH3, red) after 9 days (d), compared with RU controls (c). (e,f) Graphical summary showing changes in ISC/EB number (e) and mitosis counts (f) after 5 days. (e) RU UAS-GliRNAi n = 16 2do, n = 19 5do, n = 18 9do; RUC UAS-GliRNAi n = 19 2do, n = 17 5do, n = 15 9do. Each data point is an average proportion calculated from four independent images per midgut and the error bars represent the mean s.e.m. of those averages (one-way ANOVA/Tukey’s multiple comparisons test), P < 0.01, represents a statistically significant difference. NS, not significant. (f) RU UAS-GliRNAi n = 16 2do, n = 19 5do, n = 18 9do; RUC UAS-GliRNAi n = 19 2do, n = 17 5do, n = 15 9do. Each data point is an average proportion calculated from four independent images per midgut and the error bars represent the median with interquartile range of those averages (Kruskal-Wallis/Dunn multiple comparisons test). **, P <0.01, represents a statistically significant difference. (g–j) Posterior midguts from Su(H)LacZ; 5966GS GAL4, esg:GFP/UAS-GliRNAi flies raised under axenic conditions. After 7 days of Gli depletion, effects on esgC cell number and ISC mitoses were still observed. (g,h) Gli knockdown caused an increase in the ISC/EBs cell number (marked by esg:GFP, green) and proliferation (marked by arrowheads PH3, red) after 7 days (h), compared with RU controls (g). (i–j) Graphical summary showing the statistical significance in ISC/EB number (i) and mitosis counts (j) after 7 days. (i) RU− UAS-GliRNAi n = 20, RUC UAS-GliRNAi n = 20. Each data point is an average proportion calculated from four independent images per midgut and the error bars represent the mean s.e.m. of those averages (unpaired Student’s t-test, two tailed) ***, P < 0.0001, represents a statistically significant difference. (j) RU− UAS-GliRNAi n = 20, RU+ UAS-GliRNAi n = 20. Each data point is an average proportion calculated from four independent images per midgut; error bars represent the median with interquartile range of those averages (Mann-Whitney non-parametric test). **, P < 0.01, represents a statistically significant difference. Scale bars, 10 m.
Finally, to address whether increased ISC proliferation, in response to Gli depletion, was due to death of ECs via apoptosis, the antiapoptotic factors dIAP and P35 were individually co-expressed with GliRNAi in ECs. Co-expression of dIAP or P35 with GliRNAi was not sufficient to suppress the increase of esg+ cells or ISC proliferation; no effect on ISC behaviour was observed in controls (Supplementary Fig. 4A–F). Therefore, our data indicate that apoptosis does not play a critical role downstream of Gli to trigger non-autonomous changes in ISC behaviour.
Increased microbial loads and a disruption in the composition of commensal bacteria in aged flies, collectively referred to as dysbiosis, has been shown to contribute to cellular changes in the ageing intestine, including an increase in ISC proliferation23–26. To test whether the presence of bacteria could impact ISC behaviour, following Gli depletion, we generated 5966GSGAL4/UAS-GliRNAi flies under axenic conditions and examined ISC behaviour in young flies (Supplementary Fig. 4I). Axenic flies in which Gli was depleted exclusively from ECs showed a similar increase in the number of cells expressing the ISC/EB marker Esg, as well as an increase in ISC mitoses, when compared with flies reared under conventional, non-sterile conditions (Fig. 4g–j). Altogether, our data suggest that changes in bacterial populations are not a major contributing factor to accelerated ISC proliferation and intestinal dysplasia observed following depletion of Gli.
To determine possible mechanisms by which Gli depletion could elicit alterations in stem cell behaviour, changes in gene expression were assessed in posterior midguts from control flies or flies depleted of Gli for 2 or 9 days via RNA-seq analysis. At the 9-day time point, Gli expression was decreased and esg expression increased, presumably due to an increase in esg+ cells, when compared with controls (Supplementary Table 2). Comprehensive analysis of the RNA-seq data set revealed an increase in activity of pathways known to stimulate ISC proliferation in response to damage, infection, or stress, including the Jun N-terminal kinase (JNK), Hippo, Epidermal growth factor (EGF), Wingless (Wg) and Janus kinase–Signal transducer and activator of transcription (JAK/STAT) pathways2 (Supplementary Table 2). Upregulation of genes encoding SJ proteins, such as dlg, mesh, cora and Ssk, was observed, similar to the age-related changes in expression detected in midguts from aged flies (Fig. 1c and Supplementary Tables 1 and 2). However, an increase in expression of AMPs was not detected, suggesting that the increase in ISC proliferation is not due to an inflammatory response as a result of bacterial dysbiosis23,26 (Supplementary Fig. 3M,N and Supplementary Table 2).
The JNK pathway is a highly conserved stress-sensing pathway that regulates gene expression, regeneration, apoptosis and metabolic adaptation in response to both extrinsic and intrinsic stressors27. In the intestine, activation of the JNK pathway in ECs leads to increased expression of cytokine-like molecules that, in turn, activate the JAK-STAT pathway in ISCs to stimulate ISC proliferation2,6,7,28. Therefore, we wanted to determine whether JNK pathway activation could be responsible for driving the ISC response downstream of Gli depletion.
Activation of the JNK pathway was observed in ECs as early as 2 days after Gli depletion, in comparison with controls, as determined by expression of a downstream target of the pathway, puckered (puc) (Fig. 5a–f′). Similar results were observed when the experiment was conducted under axenic conditions (Supplementary Fig. 4G-H′). An increase in puc expression following Gli depletion was confirmed by RT–qPCR and RNA-seq analysis (Supplementary Fig. 4J and Supplementary Table 2). Suppression of JNK signalling in ECs, achieved by ectopic expression of a dominant-negative version of the single Drosophila JNK, basket (bskDN), had no effect on ISC behaviour (Fig. 5, compare k,l with g,h; quantified in o,p). However, expression of bskDN was sufficient to suppress the increase in esg-expressing cells and ISC proliferation in response to EC-specific Gli depletion (Fig. 5, compare m,n with i,j; quantified in o,p). In contrast, co-expression of bskDN was not sufficient to suppress the loss of barrier integrity, nor the decrease in survival, observed following GliRNAi (Fig. 5q and Supplementary Fig. 4K), suggesting that activation of JNK at early time points does not contribute to loss of barrier function. Altogether, these data indicate that JNK signalling is activated downstream of TCJs to drive changes in ISC behaviour in a non-autonomous manner.
Figure 5.
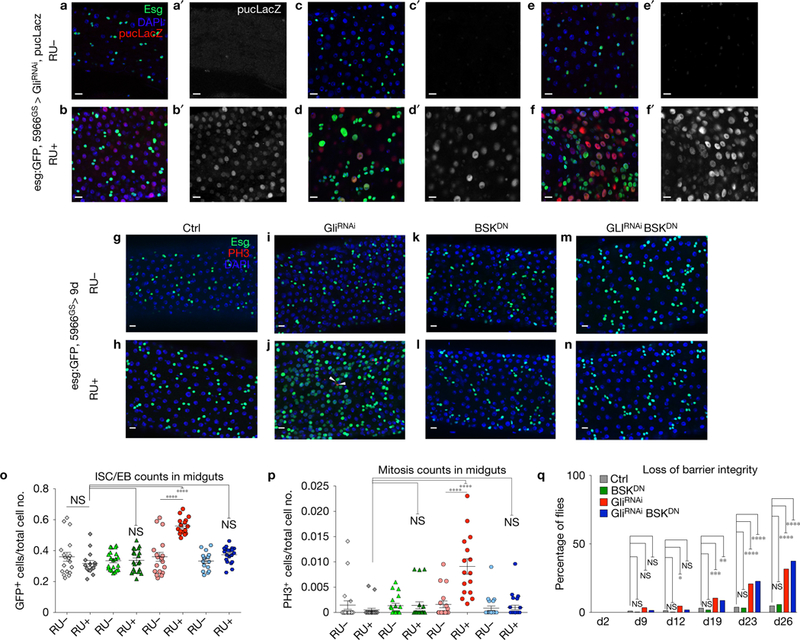
JNK signalling is activated downstream of Gli to drive changes in ISC behaviour in a non-autonomous manner. (a–f′) Reduction of Gli expression in ECs using 5966 GAL4GS triggers JNK pathway activation, reported by puc-lacZ expression (red or grey) in ECs 2 (b,b′; 11 midguts), 5 (d,d′; 8 midguts) and 9 (f,f′; 8 midguts) days after reducing Gli expression, compared with RU controls (a,a′, 7 midguts; c,c′, 8 midguts; e,e′, 7 midguts). ISC/EB is marked by esg-GFP (green), cell nuclei by DAPI (blue). (g–q) Epistasis analysis between Gli (GliRNAi) and Bsk (BSKDN). Midguts were stained with DAPI (nuclei, blue), GFP (esg+ cells, green) and PH3 (mitotic cells marked by arrowheads, red) following 9 days of incubation in RU+ or RU−. We observe that blocking JNK signalling (BskDN) (5966GS GAL4/UAS-GliRNAi UAS-BskDN, RU+) (n–p) rescues the non-autonomous effect on ISC proliferation produced by GliRNAi (5966GS GAL4/UAS-GliRNAi, RU+) (j,o,p). (g–n) Four representative images were taken per midgut, of at least sixteen midguts. (o) ISC/EB counts in midguts. Left to right: Ctrl RU− n = 20, Ctrl RU+ n = 20, BskDN RU− n = 18, BskDN RU+ n = 16, GliRNAi RU− n = 19, GliRNAi RU+ n = 20, GliRNAi BskDNRU− n = 22, GliRNAi BskDN RU+ n = 24. Each data point is an average proportion calculated from four independent images per midgut and error bars represent the mean s.e.m. of those averages (one-way ANOVA/Tukey’s multiple comparisons test). ****, P < 0.0001, represents a statistically significant difference. NS, not significant. (p) Quantification of mitotic ISCs. Left to right: Ctrl RU− n = 20, Ctrl RU+ n = 20, BskDN RU− n = 18, BskDN RU+ n = 16, GliRNAi RU− n = 19, GliRNAi RU+ n = 20, GliRNAi BskDN RU+ n = 22, GliRNAi BskDN RU+ n = 24. Each data point is an average proportion calculated from four independent images per midgut, and the error bars represent the median with interquartile range of those averages (Kruskal-Wallis/Dunn multiple comparisons test). ****, P <0.0001, represents a statistically significant difference. NS, not significant. (q) Quantification of loss of barrier function. Flies with reduced Gli expression (5966GS GAL4/UAS-GliRNAi, RU+, n = 259) present the same increase in Smurf proportion as the combination GliRNAi BskDN (5966GS GAL4/UAS-GliRNAi UAS-BskDN, RU+, n = 264), compared with BskDN (5966GS GAL4/UAS-BskDN, RU+, n = 277) and control flies (5966GS GAL4/UAS-GliRNAi ethanol, RU−, n = 290). Fisher’s exact test; two tailed. ****, P <0.0001,***, P <0.001, **, P <0.01, *, P <0.05 represent a statistically significant difference. NS, not significant. Scale bars, 10 μm.
Our data indicate that ageing results in changes to occluding junctions that are likely to contribute to the loss of barrier integrity described previously8,9. However, acute depletion of the TCJ protein Gli in young flies quickly leads to changes considered to be hallmarks of ageing, including an increase in ISC proliferation and a block in terminal differentiation. Surprisingly, changes in ISC behaviour were observed prior to loss of the permeability barrier, activation of AMPs, and increases in bacterial populations (Figs 3 and 4). While not all phenotypes associated with ageing are observed following downregulation of Gli at early time points, our data suggest that altered TCJ function during the course of normal ageing could contribute directly to the changes in ISC behaviour observed in older animals.
Although age-dependent remodelling of epithelial junctions has been described in mammalian models29–31, no prior link between changes in occluding junctions and age-related changes in stem cell behaviour has been established in other systems. If this connection is conserved in mammalian systems, epithelial remodelling could be a driver of a host of intestinal diseases, including colon cancer. Furthermore, if age-related changes to occluding junctions also occur within tissues in which low or no cell turnover takes place, loss of barrier function could be a substantial contributing factor to age-onset or degenerative diseases in tissues such as the nervous system, ear, or the kidney.
METHODS
Fly food and husbandry.
Flies were cultured in vials containing standard cornmeal medium (1% agar, 3% brewer’s yeast, 1.9% sucrose, 3.8% dextrose, and 9.1% cornmeal; all concentrations given in wt/vol). Dietary restriction diet9: 1% agar, 0.55% brewer’s yeast, 5% sucrose, and 8.6% cornmeal; all concentrations given in wt/vol. Control food for DR diet: 1% agar, 5.5% brewer’s yeast, 5% sucrose, and 8.6% cornmeal; all concentrations given in wt/vol. Two inducible GAL4/UAS systems were used in this study: the GeneSwitch system19,20, and the Target system32. All crosses with the GeneSwitch driver were carried out at 25 ºC. Crosses with the TARGET system were set up and maintained at 18 ºC until eclosion. In both cases, adults were kept for an additional 2–3 days, and induced at 3–4 days after eclosion by placement on food containing the steroid hormone mifepristone (RU486; Sigma M8046) in a 25 µg ml−1 concentration, and flipped every 2 days thereafter. All analyses for these studies were performed on female flies, as age-related gut pathology has been well established in females6,9.
Fly stocks used.
Unless otherwise stated, crosses were done at 25 ºC. Lines not described in the text can be found in Flybase. UAS-BskDN, UAS-dIAP, UAS-P35 and puc-lacZ33. Gal4 lines: Su(H)lacZ; esg:GFP,5966GAL4GS (gift from B. Ohlstein, Columbia University, USA); Myo1A-GAL4, UAS-GAL80TS; SalEP GAL4 (ref. 34, gift from J. F. de Celis); Rab3GAL4, tubGAL80TS. Lines used for RNAi-mediated knockdown: UAS-GliRNAi (37115GD,VDRC); UAS-GliRNAi (37116GD,VDRC); UAS-GliRNAi (107258KK, DSRC); UAS-SskRNAi (11906GD,VDRC); UAS-meshRNAi (11906GD,VDRC); UAS-bbg RNAi (15975GD,VDRC); UAS-coraRNAi (9787GD, VDRC); UAS-scribRNAi (29552, BDCS); UAS-dlg RNAi (25780, BDSC). GFP protein trap lines: Gli:GFP (115–332, DGRC); Scribble:GFP, Neuroglian:GFP, NeurexinIV:GFP, Nervana:GFP (gifts from G. Tanentzapf, University of British Columbia, Canada).
Transmission electron microscopy.
Tissues were fixed in 2.5% glutaraldehyde, in 0.1 M phosphate buffer, 0.9% sodium chloride (PBS) and washed. The tissues were treated with 1% OsO4 with 0.3% potassium ferrocyanide in PB for 1 h, followed by 2% UA for 1 h. The tissues then were dehydrated in a graded series of ethanol, treated with propylene oxide and embedded in Eponate 12 (Ted Pella). Approximately 50–60-nm-thick sections were cut on a TMC ultramicrotome and picked up on formvar-coated copper grids. The sections were stained with uranyl acetate and Reynolds lead citrate and examined on a JEOL 100CX electron microscope at 60 kV. ISC/EBs are easily recognizable because they are small cells immediately adjacent to the basement membrane and have no exposure to the lumen5.
Fluorescence microscopy and antibody staining.
Our observations were carried out in the P3–P4 regions of the Drosophila intestine located by centring the pyloric ring in a × 40 field of view (fov) and moving 1–2 fov toward the anterior. Posterior midguts were dissected into ice-cold PBS/4% formaldehyde and incubated for 1 h in fixative at room temperature. Samples were then washed three times, for 10 min each, in PBT (PBS containing 0.5% Triton X-100), 10 min in Na-deoxycholate (0.3%) in PBT (PBS with 0.3% Triton X-100), and incubated in block (PBT-0.5% bovine serum albumin) for 30 min. Samples were immunostained with primary antibodies overnight at 4 ºC, washed 4 × 5 min at room temperature in PBT, incubated with secondary antibodies at room temperature for 2 h, washed three times with PBT and mounted in Vecta-Shield/DAPI (Vector Laboratories, H-1200).
The following antibodies were obtained from the Developmental Studies Hybridoma Bank, developed under the auspices of the NICHD and maintained by The University of Iowa, Department of Biology, Iowa City, IA 52242. Discs large (mouse, 1:20, 4F3) and Coracle (mouse, 1:20, C615.16). GFP (rabbit, 1:3,000, Molecular Probes A-11122); GFP (mouse, 1:200, Molecular Probes A-11120); GFP (chicken, 1:500, Aves Labs GFP-1010); β-GAL (rabbit, 1:2,000, Cappel/MPbio 559761); Phospho-histone3 (rabbit, 1:200, Millipore 06–570). Gliotactin (mouse, 1:50, gift from V. Auld); Snakeskin (rabbit, 1:1,000) and Mesh (rabbit, 1:1,000) (gifts from M. Furuse).
Images were acquired on a Zeiss LSM710 inverted confocal microscope, and on a Zeiss Axio Observer Z1 and processed with Fiji/ImageJ and Zen from Zeiss. Super-resolution images were obtained from a custom-built stimulated emission depletion (STED) super-resolution microscope currently reaching a resolution of about 30–40 nm (ref. 35). The STED system was built in the Department of Anesthesiology, UCLA, supported by an NIH grant from the National Heart, Lung, and Blood Institute BRG R01 HL088640. Final figures were assembled using Adobe Photoshop.
TCJ and bicellular septate junction fluorescence quantification.
To measure and compare the TCJ or bicellular SJ fluorescence intensity of Gli-GFP, Dlg, Cora, Scribble-GFP, Mesh and Ssk in posterior midgut ECs, ×100 + ×3 of digital magnification confocal z-stack maximum projections at the level of the TCJ and SJ were generated using Zen 2 pro Blue software edition (Zeiss). TCJs were manually localized using Gli-GFP and a SJ marker (Ssk, Cora, Dlg or Mesh). TCJ and SJ fluorescence intensity were measured using a mask of 25.5 pixels in diameter. Then cytoplasm fluorescence intensity was calculated using the same mask. Average fluorescence intensity at TCJs or SJs was divided by the cytoplasmic average intensity. Between 3 to 7 measurements were taken per picture and a minimum of 20 posterior midguts were analysed per experimental condition.
Quantification using CellProfiler.
For statistical significance four images were taken as z-stacks with a typical slice thickness of 750 nm per posterior midgut; two on each side (top and bottom); from contiguous fov, starting at 1 fov from the pylorus (using a minimum of 20 guts). The images were then processed using the CellProfiler36 pipeline developed in the Jones laboratory. ISC number and mitotic events were obtained from esg:GFP/total cell and PH3/total cell ratios respectively. Average ratios from the four images corresponding to a single gut were used in subsequent statistical analyses.
Statistics and reproducibility.
Statistical analysis and graphical display of the data were performed using Prism6 (GraphPad). Significance, expressed as P values, was determined with a two-tailed test; the following parametric or non-parametric tests were used as indicated in the figure legends: ANOVA/Tukey’s multiple comparisons test or Student’s t-test were used when data met criteria for parametric analysis (normal distribution, equal variances), Kruskal–Wallis/Dunn multiple comparisons test was used when data were non-parametric, Fisher’s exact test, log-rank (Mantel–Cox) test. Experiments were repeated at least two times. No statistical method was used to predetermine sample size. The experiments were not randomized and investigators were not blinded to allocation during experiments and outcome assessment.
Barrier integrity assays (‘Smurf’ assay).
Flies were maintained on standard medium prepared with FD&C Blue Dye no 1 from Spectrum added at a concentration of 2.5% (wt/vol). Loss of intestinal barrier function was determined when dye was observed outside the digestive tract as described in refs 8,9.
Generation of axenic flies.
Embryos were treated as described previously26,37. Eight- to fourteen-hour-old embryos were collected on grape agar plates using commercially available cages (flystuff.com). Embryos were dechorionated in 3% sodium hypochlorite (50% v/v regular bleach) for 20 min, rinsed in 70% ethanol for 5 min, and then washed three times in PBS C + 0.01% Triton X-100. Axenic embryos were transferred to autoclaved medium (50 embryos per vial) in a laminar flow cabinet. Axenic conditions were confirmed via plating fly homogenate, as well as by plating of swabs from spent vials, on de Man, Rogosa, Sharpe (MRS) bacterial agar, prior to each time point. Microbe-associated controls were generated by adding 60 μl whole-fly homogenate (1 fly equivalent, from a glycerol stock of conventionally reared flies) per vial to embryos post sterilization, as described previously26.
RNA extraction.
Seventy-five female posterior midguts or five whole flies per condition after dissection were frozen at −80 ºC in fresh Trizol buffer (TRizol Reagent, Life Technologies, 15596026; 5 μg Linear Poly-Acrylamide Sigma 56575, 100 ng of tRNA). Total RNA was extracted from pooled midgut samples, followed by five rounds of freezing (liquid nitrogen)/thawing at 37 ºC in a water bath. Samples then underwent five rounds of vortexing at room temperature for 30 seconds, letting them stand at room temperature for 5 min to disrupt all RNA–protein complexes. Finally, RNA was isolated by phenol/chloroform extraction. Purified RNA was treated with DNase Q1 (Promega, M610A).
Quantitative RT–PCR and PCR.
RNA (2 μg) from posterior midguts dissected from RU486 (RU+)- or ethanol (RU−)-fed flies (genotypes: Su(H)lacZ; esg-GFP, 5966GAL4GS crossed to UAS-GliRNAi) was reverse-transcribed using the iScriptkit (Bio-Rad, 170–8841). Standard qPCRs were carried out on a Bio-Rad CFX96/C1000 Touch system (Bio-Rad), using Sso Advanced SYBR Green (Bio-Rad, 1725–264). The following primer sequences were used: RpL32 Fwd: 5′-ATCGTGAAGAAGCGCACCAA3′; RpL32 Rev: 5′-TGTCGATACCCTTGGGC TTG-3′; Gli Fwd: 5′-GCCGAATCGTCCAATTACAG-3′; Gli Rev: 5′-ACTTTAAA GAAAAATTCCAGGAGAAA-3′; Puc Fwd: 5′-CGACTTTATCGAAGATGCACG G-3′ Puc Rev: 5′-CAGGGAGAGCGACTTGTACC-3′. Expression levels of targets analysed were calculated relative to RpL32 expression, using the ∆∆Ct method.
Transcriptome analysis (RNA sequencing).
RNA-Seq libraries were prepared from three biological replicates for each experimental condition. The NEBNext poly(A)-mRNA magnetic isolation kit (NEB E7490S) was used to isolate poly(A)-mRNA from 4 μg of whole mRNA. cDNA libraries were generated using the NEBNext RNA Library Prep Kit for Illumina (NEB E6110S), and NEBNext Multiplex Oligos for Illumina (NEB E7335S) were used for multiplexing. All steps were performed according to the manufacturer’s directions. RNA sequencing was performed on a Hi-Seq2000 (Illumina) with 50 bp single-end read length.
Bioinformatics analysis.
Genomatix software from was used for mapping spliced reads, making transcript assemblies, and for differential expression analysis. Reads were first trimmed by removing adapter and Illumina-specific sequences. Next, trimmed reads were aligned against the Drosophila genome (NCBI el dorado version 08.2011) with default settings. Finally, a differential expression analysis was performed using the DESeq package method with a P-value threshold of P <0.05. Differentially expressed genes were interrogated for over-represented biological themes using database for annotation visualization and integrated discovery (DAVID) and categorized on the basis of GO terms. The DAVID functional annotation clustering tool highlights the most relevant GO terms associated with a differentially expressed gene list. Details of the DAVID algorithm can be found at http://david.abcc.ncifcrf.gov.
Supplementary Material
ACKNOWLEDGEMENTS
The authors thank H. Jasper (The Buck Institute for Research on Aging, USA), V. Auld (University of British Columbia, Canada), J. F. de Celis (CBMSO, Spain), M. Furuse (Kobe University, Japan), the Vienna Drosophila RNAi Center (VDRC), and Bloomington Stock Center for reagents, M. Cilluffo from the Brain Research Institute at UCLA EM core facility, and the Jones and Walker laboratories for comments on the manuscript. In addition, we would like to thank Y. Wu and E. Stefani for their sharing their time, expertise, and STED technology. This work was supported by the Eli and Edythe Broad Center of Regenerative Medicine and Stem Cell Research at the University of California, Los Angeles and the Rose Hills Foundation (D.L.J.), and the NIH: AG028092 (D.L.J.), AG040288 (D.L.J. and D.W.W.), AG049157 (D.W.W.), and a training grant that supports the UCLA-Caltech Medical Scientist Training Program, GM08042 (S.L.).
Footnotes
COMPETING FINANCIAL INTERESTS
The authors declare no competing financial interests.
Data availability. RNA sequencing data that support the findings of this study have been deposited in the Gene Expression Omnibus (GEO) under the accession numbers GSE74168, GSE74171 and GSE74172. Source data for Fig. 1c have been provided as Supplementary Table 1. All other data supporting the findings of this study are available from the corresponding author on request.
References
- 1.Jones DL & Rando TA Emerging models and paradigms for stem cell ageing. Nat. Cell Biol 13, 506–512 (2011). [DOI] [PMC free article] [PubMed] [Google Scholar]
- 2.Li H & Jasper H Gastrointestinal stem cells in health and disease: from flies to humans. Dis. Models Mech 9, 487–499 (2016). [DOI] [PMC free article] [PubMed] [Google Scholar]
- 3.Marchiando AM, Graham WV & Turner JR Epithelial barriers in homeostasis and disease. Annu. Rev. Pathol 5, 119–144 (2010). [DOI] [PubMed] [Google Scholar]
- 4.Micchelli CA & Perrimon N Evidence that stem cells reside in the adult Drosophila midgut epithelium. Nature 439, 475–479 (2006). [DOI] [PubMed] [Google Scholar]
- 5.Ohlstein B & Spradling A The adult Drosophila posterior midgut is maintained by pluripotent stem cells. Nature 439, 470–474 (2006). [DOI] [PubMed] [Google Scholar]
- 6.Biteau B, Hochmuth CE & Jasper H JNK activity in somatic stem cells causes loss of tissue homeostasis in the aging Drosophila gut. Cell Stem Cell 3, 442–455 (2008). [DOI] [PMC free article] [PubMed] [Google Scholar]
- 7.Jiang H et al. Cytokine/Jak/Stat signaling mediates regeneration and homeostasis in the Drosophila midgut. Cell 137, 1343–1355 (2009). [DOI] [PMC free article] [PubMed] [Google Scholar]
- 8.Rera M et al. Modulation of longevity and tissue homeostasis by the Drosophila PGC-1 homolog. Cell Metab 14, 623–634 (2011). [DOI] [PMC free article] [PubMed] [Google Scholar]
- 9.Rera M, Clark RI & Walker DW Intestinal barrier dysfunction links metabolic and inflammatory markers of aging to death in Drosophila. Proc. Natl Acad. Sci. USA 109, 21528–21533 (2012). [DOI] [PMC free article] [PubMed] [Google Scholar]
- 10.Tepass U & Hartenstein V The development of cellular junctions in the Drosophila embryo. Dev. Biol 161, 563–596 (1994). [DOI] [PubMed] [Google Scholar]
- 11.Fristrom DK Septate junctions in imaginal disks of Drosophila: a model for the redistribution of septa during cell rearrangement. J. Cell Biol 94, 77–87 (1982). [DOI] [PMC free article] [PubMed] [Google Scholar]
- 12.Schulte J, Tepass U & Auld VJ Gliotactin, a novel marker of tricellular junctions, is necessary for septate junction development in Drosophila. J. Cell Biol 161, 991–1000 (2003). [DOI] [PMC free article] [PubMed] [Google Scholar]
- 13.Byri S et al. The triple-repeat protein anakonda controls epithelial tricellular junction formation in Drosophila. Dev. Cell 33, 535–548 (2015). [DOI] [PubMed] [Google Scholar]
- 14.Hildebrandt A et al. Bark beetle controls epithelial morphogenesis by septate junction maturation in Drosophila. Dev. Biol 400, 237–247 (2015). [DOI] [PubMed] [Google Scholar]
- 15.Auld VJ, Fetter RD, Broadie K & Goodman CS Gliotactin, a novel transmembrane protein on peripheral glia, is required to form the blood-nerve barrier in Drosophila. Cell 81, 757–767 (1995). [DOI] [PubMed] [Google Scholar]
- 16.Schulte J et al. Gliotactin and Discs large form a protein complex at the tricellular junction of polarized epithelial cells in Drosophila. J. Cell Sci 119, 4391–4401 (2006). [DOI] [PubMed] [Google Scholar]
- 17.Padash-Barmchi M, Charish K, Que J & Auld VJ Gliotactin and Discs large are co-regulated to maintain epithelial integrity. J. Cell Sci 126, 1134–1143 (2013). [DOI] [PubMed] [Google Scholar]
- 18.Fontana L, Partridge L & Longo VD Extending healthy life span–from yeast to humans. Science 328, 321–326 (2010). [DOI] [PMC free article] [PubMed] [Google Scholar]
- 19.Osterwalder T, Yoon KS, White BH & Keshishian H A conditional tissue-specific transgene expression system using inducible GAL4. Proc. Natl Acad. Sci. USA 98, 12596–12601 (2001). [DOI] [PMC free article] [PubMed] [Google Scholar]
- 20.Roman G, Endo K, Zong L & Davis RLP [Switch], a system for spatial and temporal control of gene expression in Drosophila melanogaster. Proc. Natl Acad. Sci. USA 98, 12602–12607 (2001). [DOI] [PMC free article] [PubMed] [Google Scholar]
- 21.Choi YJ et al. Age-related upregulation of Drosophila caudal gene via NF- KB in the adult posterior midgut. Biochim. Biophys. Acta 1780, 1093–1100 (2008). [DOI] [PubMed] [Google Scholar]
- 22.Park JS, Kim YS & Yoo MA The role of p38b MAPK in age-related modulation of intestinal stem cell proliferation and differentiation in Drosophila. Aging 1, 637–651 (2009). [DOI] [PMC free article] [PubMed] [Google Scholar]
- 23.Buchon N, Broderick NA, Chakrabarti S & Lemaitre B Invasive and indigenous microbiota impact intestinal stem cell activity through multiple pathways in Drosophila. Genes Dev 23, 2333–2344 (2009). [DOI] [PMC free article] [PubMed] [Google Scholar]
- 24.Buchon N, Broderick NA & Lemaitre B Gut homeostasis in a microbial world: insights from Drosophila melanogaster. Nat. Rev. Microbiol 11, 615–626 (2013). [DOI] [PubMed] [Google Scholar]
- 25.Guo L, Karpac J, Tran SL & Jasper H PGRP-SC2 promotes gut immune homeo-stasis to limit commensal dysbiosis and extend lifespan. Cell 156, 109–122 (2014). [DOI] [PMC free article] [PubMed] [Google Scholar]
- 26.Clark RI et al. Distinct shifts in microbiota composition during Drosophila aging impair intestinal function and drive mortality. Cell Rep 12, 1656–1667 (2015). [DOI] [PMC free article] [PubMed] [Google Scholar]
- 27.Biteau B, Karpac J, Hwangbo D & Jasper H Regulation of Drosophila lifespan by JNK signaling. Exp. Gerontol 46, 349–354 (2011). [DOI] [PMC free article] [PubMed] [Google Scholar]
- 28.Staley BK & Irvine KD Warts and Yorkie mediate intestinal regeneration by influencing stem cell proliferation. Curr. Biol 20, 1580–1587 (2010). [DOI] [PMC free article] [PubMed] [Google Scholar]
- 29.Meier J & Sturm A The intestinal epithelial barrier: does it become impaired with age? Dig. Dis 27, 240–245 (2009). [DOI] [PubMed] [Google Scholar]
- 30.Ren WY et al. Age-related changes in small intestinal mucosa epithelium architecture and epithelial tight junction in rat models. Aging Clin. Exp. Res 26, 183–191 (2014). [DOI] [PubMed] [Google Scholar]
- 31.Tran L & Greenwood-VanMeerveld B Age-associated remodeling of the intestinal epithelial barrier. J. Gerontol. A Biol. Sci. Med. Sci 68, 1045–1056 (2013). [DOI] [PMC free article] [PubMed] [Google Scholar]
- 32.McGuire SE, Mao Z & Davis RL Spatiotemporal gene expression targeting with the TARGET and gene-switch systems in Drosophila. Sci. STKE 2004, pl6 (2004). [DOI] [PubMed] [Google Scholar]
- 33.Martin-Blanco E et al. Puckered encodes a phosphatase that mediates a feedback loop regulating JNK activity during dorsal closure in Drosophila. Genes Dev 12, 557–570 (1998). [DOI] [PMC free article] [PubMed] [Google Scholar]
- 34.Cruz C, Glavic A, Casado M & de Celis JF A gain-of-function screen identifying genes required for growth and pattern formation of the Drosophila melanogaster wing. Genetics 183, 1005–1026 (2009). [DOI] [PMC free article] [PubMed] [Google Scholar]
- 35.Mitchell-Jordan S et al. Features of endogenous cardiomyocyte chromatin revealed by super-resolution STED microscopy. J. Mol. Cell. Cardiol 53, 552–558 (2012). [DOI] [PMC free article] [PubMed] [Google Scholar]
- 36.Carpenter AE CellProfiler: image analysis software for identifying and quantifying cell phenotypes. Genome Biol 7, R100 (2006). [DOI] [PMC free article] [PubMed] [Google Scholar]
- 37.Bakula M The persistence of a microbial flora during postembryogenesis of Drosophila melanogaster. J. Invertebr. Pathol 14, 365–374 (1969). [DOI] [PubMed] [Google Scholar]
Associated Data
This section collects any data citations, data availability statements, or supplementary materials included in this article.