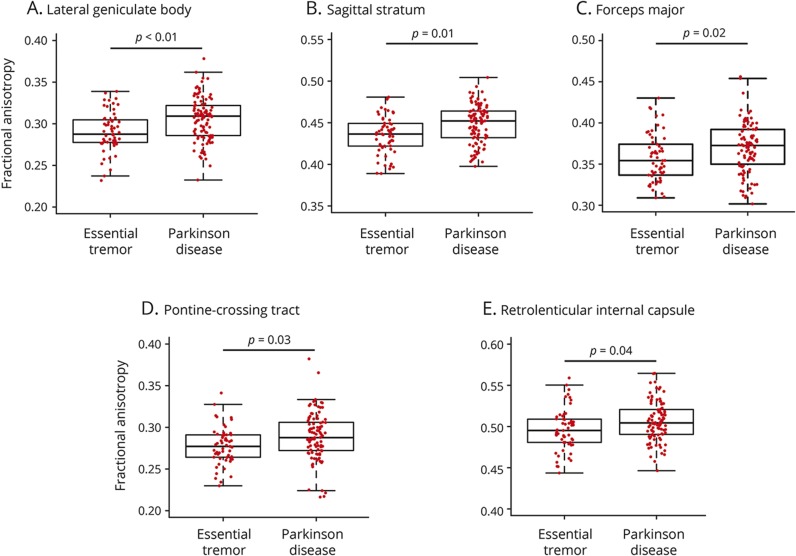
Figure 2. Fractional anisotropy.
Box-and-whisker plots are shown for all participants with essential tremor and Parkinson disease, and the middle line, box, and whiskers represent the median, 25th and 75th percentiles, and 1.5 times the interquartile range, respectively. Fractional anisotropy values are displayed for the lateral geniculate body (A), sagittal stratum (B), forceps major (C), pontine-crossing tract (D), and retrolenticular internal capsule (E).

