Abstract
Purpose:
The purpose of this study is to investigate the utility of contrast-enhanced magnetic resonance imaging (CE-MRI), diffusion-weighted MRI (DW-MRI), and 68Ga-DOTATOC positron emission tomography/computer tomography (68Ga-DOTATOC PET/CT) in the assessment of response to loco-regional peptide receptor radiotherapy (PRRT) with 90Y-/177Lu-DOTATOC in patients with hepatic metastases from gastro-entero-pancreatic neuroen-docrine tumors (GEP-NET).
Procedures:
CE-MRI, DW-MRI, and 68Ga-DOTATOC-PET/CT images were acquired before and 3 months after one to two cycles of intra-arterial 90Y-/177Lu-DOTATOC therapy in 14 patients (nine female, five male; mean age, 54±9 years; range, 41–69 years) with hepatic metastases from GEP-NET. A total of 38 liver metastases were defined as target lesions for which the longest diameter, mean apparent diffusion coefficient (ADCmean) and maximum standardized uptake value (SUVmax) were assessed. Based on changes in size on follow-up imaging, target lesions were classified as responding (RL) or nonresponding (NRL). Relative changes in tumor size, ADCmean, and SUVmax were compared between the two subgroups.
Results:
A total of 27 responding and 11 nonresponding lesions were successfully evaluated. Mean ADCmean increased significantly in RL (p=0.011) as well as NRL (p=0.025). A significant correlation was found between baseline ADCmean and both the percent ADCmean change (p= 0.033) and decrease in lesion size after therapy (diameter p =0.006; volume p=0.002). SUVmax of RL declined significantly by 24.1 % (p =0.014) and remained nearly unchanged in NRL. The change of SUVmax correlated significantly with the pretreatment SUVmax (p<0.001) and the change in lesion diameter (p=0.009). NRL with an ADCmean change >0.31×10⁻³ mm2/s on first follow-up imaging showed a decrease in size in the long-term course.
Conclusion:
These results suggest that both DW-MRI and DOTATOC-PET imaging provide potential biomarkers for early assessment of treatment and stratification of therapy response, but that DW-MRI should be interpreted only in combination with SSTR expression and morphologic changes.
Keywords: Peptide receptor-targeted radiotherapy, Multimodal imaging, Neuroendocrine cancer, Response monitoring, 68Ga-DOTATOC PET, DW-MRI
Introduction
Although rare, neuroendocrine tumors (NET) have steadily increased in frequency over the last 30 years, mainly due to raised awareness and improved diagnostics [1–6]. Gastro-entero-pancreatic neuroendocrine tumors (GEP-NET) represent approximately 75 % of all NET [7]. This entity often presents with liver metastases, which is a strongly negative prognostic indicator [8, 9]. Thus, in the recent years many efforts have been made to optimize the therapy of inoperable focal GEP-NET liver metastases [10–12]. Besides the advancements in conventional therapeutic procedures such as percutaneous ablative therapies, surgical resection or trans-arterial chemotherapy, there has been notable progress in customized palliative therapies for metastatic GEP-NET utilizing targeted therapeutic radio-pharmaceuticals [13–16].
A relatively new approach in this domain is to utilize peptide receptor radionuclide therapy (PRRT) by chelating 90Y or 177Lu to DOTA(0)-Phe(1)-Tyr(3)-octreotide (DOTA-TOC) and injecting it selectively into the hepatic artery [17, 18]. Most GEP-NET primaries and metastases demonstrate increased expression of somatostatin receptor [19, 20]. Thus, the radiolabeled somatostatin analog DOTATOC targets malignant tissue with relatively minor damage to surrounding healthy structures. However, the assessment of response to this treatment remains a challenging task, as it primarily induces tumor lysis and a loss of cellular integrity which may not immediately result in reduced tumor size [21]. Thus, additional methods are needed to determine early responses to this locoregional therapy. In this study, we analyzed diffusion-weighted magnetic resonance imaging (DW-MRI) and 68Ga-DOTATOC positron emission tomography/computer tomography (68Ga-DOTATOC PET/CT) images to determine if functional imaging could provide an early indicator of tumor response to PRRT.
Patients and Methods
Thirty-six patients with refractory hepatic metastases from GEP-NET were treated with intra-arterial 90Y-/177-Lu-DOTATOC. Institutional review board approval was obtained. All patients provided informed consent. Fourteen of these patients (nine female, five male; mean age, 54±9 years; range, 41–69 years) underwent DW-MRI before and after one to two cycles of intra-arterial PRRT and were thus included in this retrospective study. For 11 of these 14 patients, PET/CT images at the same time points were also available for review. Of the 14 patients, eight had a neuroendocrine tumor of the pancreas, four of the intestine, one of the stomach, and one patient had a neuroendocrine tumor of unknown primary. Eight of the 14 patients had already undergone one to three cycles of conventional intravenous PRRT without sufficient response. In order to minimize bias, no more than three hepatic lesions (>2 cm longest diameter) per patient were analyzed. The measurement of mean apparent diffusion coefficient (ADCmean) values had to be possible on at least three consecutive sections for each metastasis on the baseline DW-MRI. During the follow-up period, none of the patients received concomitant treatments except symptomatic therapy with somatostatin analogs.
Catheter Placement and Treatment Regimen
A 4-French catheter (Sidewinder S1) was placed in the celiac artery via transfemoral access using the Seldinger technique with local anesthesia. Subsequently, a microcatheter (Progreat) was inserted coaxially and advanced to the common hepatic artery or proper hepatic artery. In cases of anatomic variation, the largest arterial feeder was cannulated. The catheter was used to deliver90Y- and/or 177Lu-DOTATOC. To minimize renal toxicity, 1,000 ml of a nephroprotective solution containing 30 g lysine and 30 g arginine was applied simultaneously.
MR Imaging Technique and Analysis
Magnetic resonance examinations were performed on a 1.5-T MR system (Avanto, Siemens Medical Systems, Erlangen, Germany). Unenhanced T1-weighted (gradient echo, TR=192 ms, TE= 4.76 ms, 256×154 matrix) and T2-weighted (HASTE, TR= 801 ms, TE=69 ms, 384×213 matrix) fast spin echo axial imaging was performed before DW-MRI and Gd-EOB-DTPA (Primovist®, Bayer Schering, Berlin, Germany) administration for contrast-enhanced magnetic resonance imaging (CE-MRI). DW-MRI was performed with a breath-hold single-shot echo planar sequence (TR=12,200 ms; TE=67 ms; FOV 430 cm; section thickness5 mm; b values 50, 300, and 600 s/mm2; voxel 3.3×3.3×5, EPI factor 112).
The acquisition of delayed postcontrast MR data started with the i.v. administration of 0.1 mmol/kg body weight of the contrast agent Gd-EOB-DTPA with an infusion rate of 1.5 ml/s followed by a 30-ml saline bolus. Imaging was performed with a T1w volumetric interpolated breath hold examination (VIBE) with 3.41 ms TR, 1.18 ms TE, 4 mm slice thickness, 320× 180 matrix, and 72 axial slices with an acquisition time of 20 s for each dataset.
Two to three target lesions per patient were selected in the hepatocyte specific contrast phase 15 min p.i. (late enhanced) which was considered the gold standard for lesion delineation on the baseline examination and then were followed on the later MRI [5]. Because of the favorable tumor to liver contrast, the longest diameter (LD) of each lesion was manually measured on late-enhanced MR images. For the assessment of tumor volume, the workstation Ziostation® (Ziosoft Inc., Redwood City, USA) was used. After manual delineation of the lesions’ borders on several slices, an automatic interpolation and calculation of tumor volume in cubic centimeters was acquired by the software.
DW-MRI data was analyzed using in-house developed software (DKFZ, Heidelberg, Germany) based on Interactive Data Language (IDL, Exelis Visual Information Solutions, Boulder, CO, USA). For each target metastasis, regions of interest (ROI) were placed in three different layers, covering as much of the lesion as possible. For each layer, the ADCmean was calculated by the software using the formula S=S0 exp(−b·ADC). Using the three b values (b=50, 300, and 600 s/mm2), a nonlinear Levenberg–Marquardt fit was used to calculate S0 and ADCmean. The mean value of the three measurements per lesion was taken as the representative value for further analysis. Additionally, ADCmean values of normal-appearing liver parenchyma and spleen were assessed in the same manner for every patient. ADC is a marker for the diffusion of water molecules based on Brownian motion. As it is inversely proportional to the cellularity of biological tissue, ADC values are high in necrotic areas with unrestricted diffusion and are low in vital tissues with high cell density and intact cell membranes such as viable tumor. After anticancer therapies, fibrotic remodeling can also lead to a decrease in ADC, whereas apoptosis and therapy-induced necrosis increase the ADC.
PET/CT Imaging Technique and Image Analysis
The PET studies were acquired with a Biograph 6 PET/CT (Siemens Medical Systems, Erlangen, Germany). Imaging was started 40±10 min after the i.v. injection of 84–196 MBq of 68Ga-DOTATOC. Static emission scans—corrected for dead time, scatter, and decay—were acquired from the vertex to the proximal legs, requiring eight bed positions (4 min each). Contrast-enhanced CT (CE-CT) was performed as a part of the PET/CT. The iodinated contrast medium (Imeron 400, Bracco Diagnostics, Milan, Italy) was injected at a flow rate of 4 ml/s. The liver and abdomen were initially examined without contrast media (130 keV, 30 mAs, CareDose), followed by an arterial phase (25 s delay) and a portal venous phase (60 s delay). The low-dose CT without contrast agent was used for attenuation correction. Slice collimation was 6×1.0 mm, pitch factor 1.5, 110 keV, 95 mAs (CareDose), matrix 512×512, rotation time 0.6 s, reconstructed to a slice thickness of 1.25- and 0.8-mm increment with a B30-kernel. Secondary raw data were reformatted to a slice thickness of 5 mm with a 2.5 mm increment in the coronal and axial view. The images were iteratively reconstructed with the ordered subset expectation maximization (OSEM) algorithm using four iterations with eight subsets and Gaussian filtering to achieve an in-plane spatial resolution of 5 mm at full-width half-maximum. Calculation of the maximum standardized uptake value (SUVmax) of a target lesion was performed after identification of the lesion on both PET/CT and MRI. Circular ROIs were drawn around these areas of increased uptake in transaxial slices and automatically adapted by e.soft software (Siemens Medical Systems, Erlangen, Germany) to a three-dimensional volume, in which the SUVmax was determined automatically by the software. Analogously, the SUVmax of normal-appearing liver parenchyma and spleen was evaluated after placing a ROI into a region without tumor infiltration (the region for normal liver parenchyma was selected after double checking with MRI, CT, and PET).
Assessment of Therapeutic Response
For each metastatic lesion, the following data was assessed: tumor volume (TV), LD, ADCmean, and SUVmax before and after treatment. Response to therapy was determined on a lesion-by-lesion basis by evaluating changes in metastasis size between baseline and follow-up MRI. A metastasis was classified as responding lesion (RL) if its LD decreased or did not change and nonresponding lesion (NRL) if the tumor diameter increased.
Statistical Analysis
All statistical analysis was carried out with the free software environment “R”. A p value of 0.05 was considered statistically significant. The quantified variables are described as median and interquartile range (IQR) or as percentages for discrete variables. For data comparison within the same groups, the Wilcoxon signed-rank test for related samples was applied. Intergroup comparisons were performed with the Mann–Whitney test for independent samples. Correlations between the assessed parameters (LD, TV, SUV, and ADCmean) and between their percent changes from baseline were determined using Spearman’s rank correlation coefficient.
Results
Thirty-eight metastases were defined based on delayed enhanced MRI as target lesions. Thirty-seven of these target lesions could be identified and analyzed on baseline DW-MR images. Of the 11 patients with PET/CT data available, all 29 of their target lesions as identified on CE-MRI were present on the baseline PET/CT. Due to therapy response, two of 37 target lesions could not be identified on DW-MRI after PRRT. According to changes in lesion size, 27 metastases (71 %) were classified as RL and 11 metastases (29 %) as NRL. Before therapy, LD of RL was 30.4 mm (IQR, 13.4) and the LD of NRL 33.2 mm (IQR, 18.2). There was no significant difference between the median pretreatment size of the two groups (p=0.159). Baseline TV of RL was 9.6 cm3 (IQR, 7.9) and for NRL was 18.1 cm3 (IQR, 39.9; p=0.147). On follow-up MRI 3 months after the last treatment cycle, the LD of RL decreased significantly by 11.2 % (IQR, 21.5; p<0.001), whereas NRL showed a LD increased significantly by 8.5 % (IQR, 16.4; p<0.001).
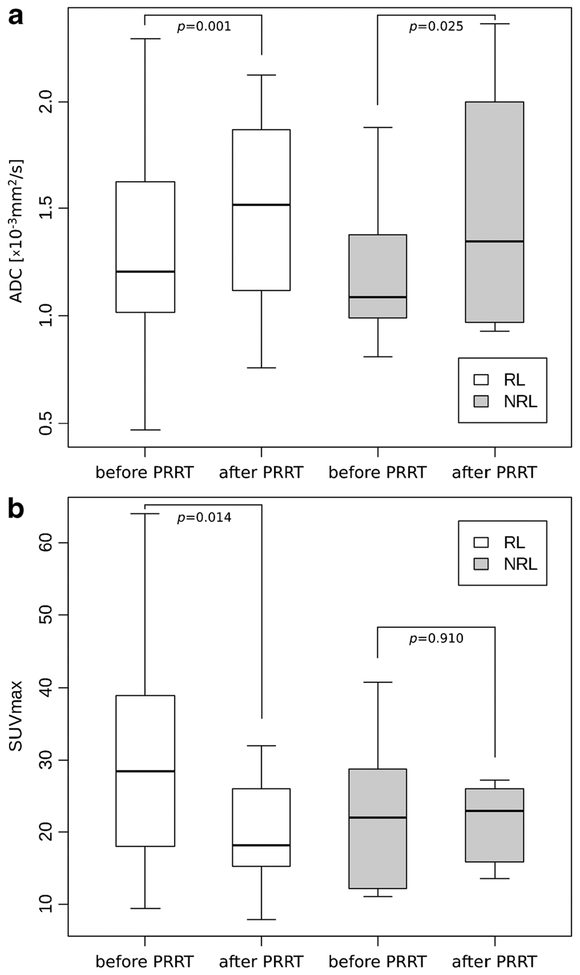
The initial ADCmean of RL was 1.21×10⁻³ mm2/s (IQR, 0.61) and of NRL 1.09×10⁻³ mm2/s (IQR, 0.35; p=0.392). On follow-up DW-MRI, ADCmean increased significantly both in RL (+10.6 %; IQR, 38.8; p=0.011) and in NRL (+18.1 %; IQR, 27.3; p=0.025) with the percentage of change in ADCmean values of NRL being higher than those of RL (Figs. 1a and 2). Baseline ADCmean of all lesions correlated weakly but significantly negative both with LD (r=−0.441; p=0.006) and TV (r=−0.500; p=0.002).
Fig. 1.
a–b Box-and-whisker plots (box first and third quartile, whisker minimum and maximum of all data) showing comparison of ADCmean values before and after PRRT (a) and maximal SUVs of 68Ga-DOTATOC before and after PRRT (b) in responding and nonresponding hepatic lesions of 14 patients suffering frommetastasized GEP-NET. No significant change of SUVmax could be observed in NRL after therapy.
Fig. 2.
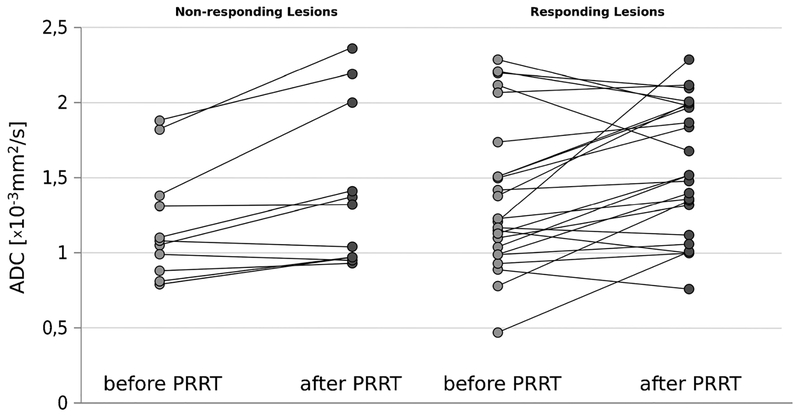
ADCmean of nonresponding lesions before and after PRRT (left) and responding lesions before and after PRRT (right). In both presented subgroups, the median ADCmean value was found to be lower prior to PRRT compared to the ADCmean value after intervention. Seven target lesions in the responding subgroup declined in ADCmean after therapy (mean change, −26.8 %).
Although most RL demonstrated an increase in ADCmean after PRRT, seven lesions were found to decrease in ADCmean value by a mean of −26.8 % (Fig. 2).
Additionally, the ADCmean of normal liver parenchyma (n =14) and of the spleen (n = 11) was assessed. Three patients had undergone prior splenectomy. Neither the ADCmean values of normal liver parenchyma nor of spleen tissue showed a significant change after therapy (p>0.05).
On PET/CT images, 29 of the target metastases could be analyzed before and 27 after therapy. Baseline median SUVmax of RL was 28.48 and decreased by 24.1 % on follow-up PET/CT (p=0.014), whereas SUVmax of NRL (baseline, 22.03) increased by 3.9 % (p=0.910; n.s.; Fig. 1b). Baseline SUVmax of the two subgroups did not show a significant difference. A negative correlation was observed between pretreatment SUVmax and the percent change of SUVmax after therapy (r=−0.769; p<0.001) as well as with the percent change of LD (r=−0.482; p=0.009) and TV (r=−0.516; p=0.005).
The SUVmax of spleen tissue increased significantly by a median of 24.3 % (p=0.039) during the observation period, whereas the SUVmax of normal liver parenchyma showed no significant changes. The change of SUVmax in the spleens did not correlate significantly with change of SUVmax in the target lesions.
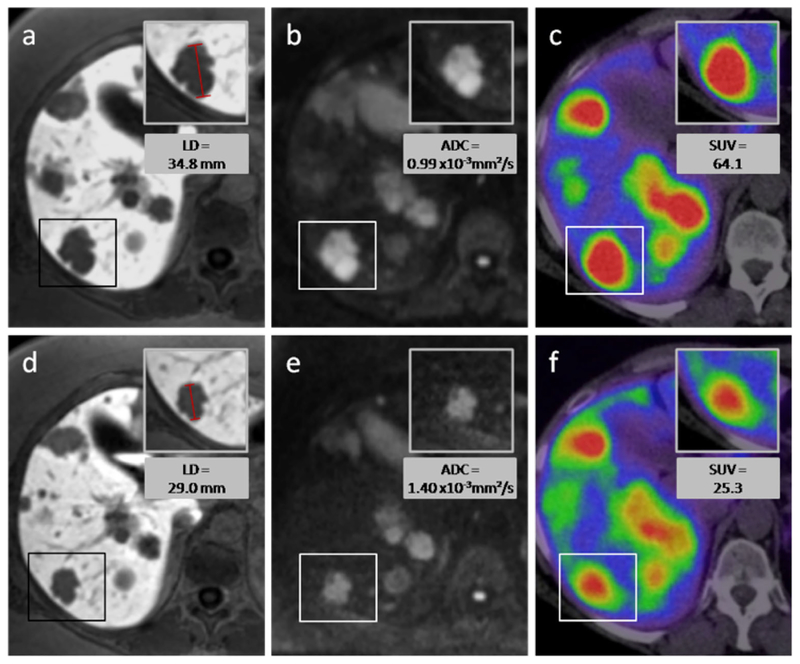
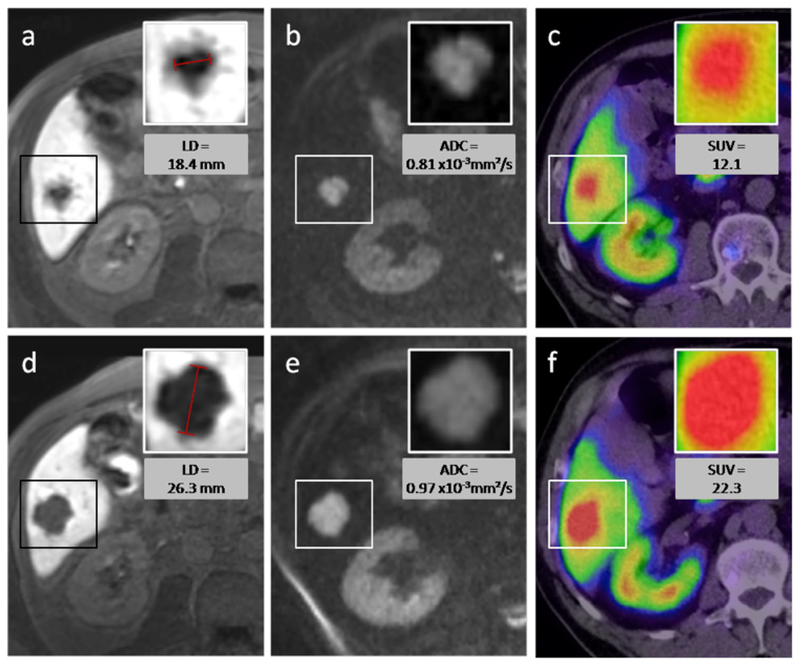
Table 1 provides a short overview over the results listed above. Figures 3 and 4 show an example of a responding lesion and of a nonresponding lesion, respectively, before and after PRRT.
Table 1.
Overview over changes in LD, Vol, ADCmean, and SUVmax during therapy in RL and NRL
| LD/Vol | ADCmean | SUVmax | |
|---|---|---|---|
| ↓ | ↑ | ↓ | |
| Nonresponding lesions NRL | ↑ | ↑ |
No significant changes in SUVmax between baseline and follow-up PET/CT of NRL
Arrows significant changes
Fig. 3.
Responding lesion—a 54-year-old female with hepatic metastases from a pancreatic NET. After two cycles of intraarterial PRRT with 4 GBq 90Y- and 177Lu-DOTATOC, the longest diameter of the target lesion (box) decreased as can be seen on MR images with the hepatocyte-specific contrast agent Gd-EOB-DTPA (a, d). The volume of the lesion decreased from 11.0 to 5.0 cm3. On diffusion-weighted MRI (b, e) an increase of ADCmean from 0.99×10 to 1.40×10⁻³ mm2/s was measured, while the SUVmax on 68Ga-DOTATOC-PET/CT decreased from 64.0 to 25.3. Upper row of figures images before PRRT, lower row images after PRRT.
Fig. 4.
Nonresponding lesion—a 65-year-old male patient with caecal NET and hepatic metastasis. After one cycle of intraarterial PRRT with 4 GBq 90Y- and 177Lu-DOTATOC, the longest diameter of the target lesion (box) increased as seen on MR images with the hepatocyte-specific contrast agent (a, d). The volume of the lesion increased from 2.4 to 8.0 cm3. On diffusion-weighted MRI (b, e), an increase of ADCmean from 0.81×10⁻³ to 0.97×10⁻³ mm2/s was measured, while the SUVmax in 68Ga-DOTATOC-PET/CT increased from 12.1 to 22.3. Upper row of figures images before PRRT, lower row images after PRRT.
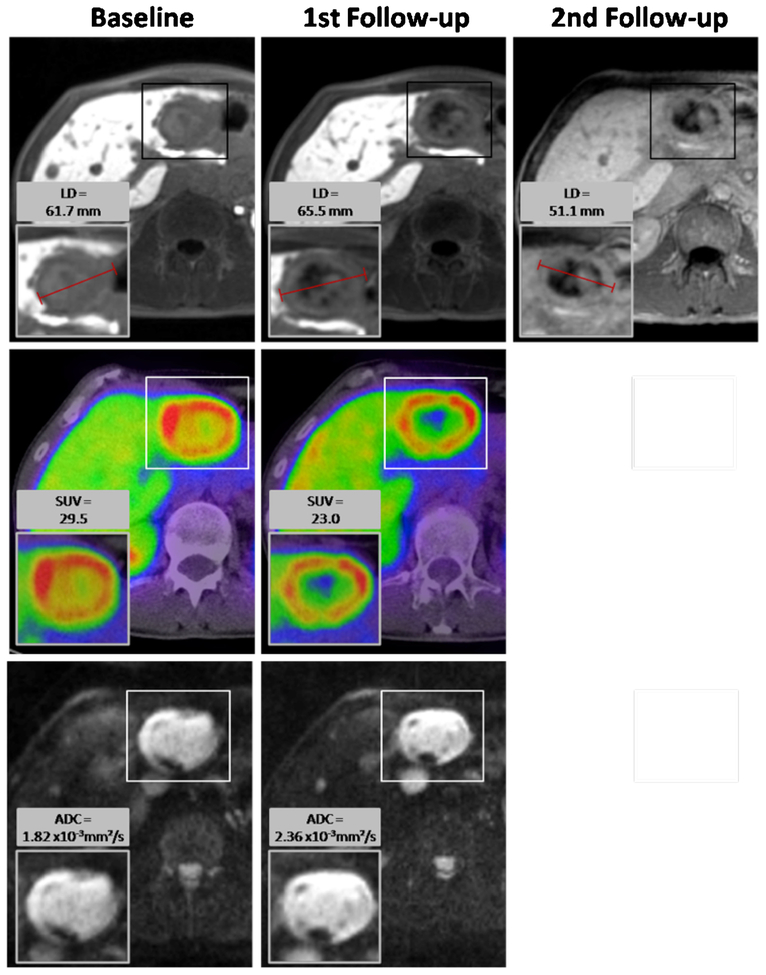
As our results showed a stronger increase of ADCmean in NRL than in RL after the first follow-up, we analyzed the 11 NRL again later in the course of treatment. All of the 11 NRL could be analyzed on a second follow-up imaging with CEMRI in mean 6 months after first follow-up. The examined patients had undergone further intra-arterial DOTATOC therapy in the interval. Three of the NRL finally decreased in size, while eight had grown compared to the baseline LD.
In the three lesions that demonstrated a decrease in size and volume, a mean ADCmean increase of 29.0 % from baseline to first follow-up and a mean decrease in SUVmax of 19.0 % was observed (Fig. 5). The eight growing lesions demonstrated an increase in ADCmean of 12.0 % from baseline to first follow-up. In five of these eight lesions, PET/CT data was available (baseline and follow-up). Here, a mean increase of SUVmax of 22.4 % was measured. Due to the small number of cases, we refrained from a statistical analysis of this finding.
Fig. 5.
Neuroendocrine liver metastasis in a 44-year-old male. After one cycle of PRRT (first follow-up), the LD and the volume of the target lesion increased and it was thus categorized as nonresponding lesion. ADCmean increased from 1.82×10⁻³ to 2.36×10⁻³ mm2/s. Remarkably, there was a decrease in maximal SUV of 68Ga-DOTATOC in this first follow-up imaging from 29.5 to 23.0. To confirm if this decrease was followed by a later decline in LD and volume of the metastasis after further PRRT, a second follow-up examination was analyzed 11 months after baseline imaging. Here, the size of the target lesion had decreased below its baseline values.
Discussion
In this retrospective study, the ADCmean of neuroendocrine liver metastases increased significantly both in RL and in NRL. Before therapy, there was no significant difference in the ADCmean of the two groups. Baseline-ADCmean of the assessed target lesions correlated inversely with the percent change of LD (r=−0.44; p=0.006) and volume (r=−0.50; p=0.002) under PRRT. This shows that the higher the ADCmean before therapy, the more the metastases decreased in size. In other studies, patients with a higher baseline ADC showed a worse response to therapy. Koh et al. [22] investigated hepatic metastases of colorectal cancer under chemotherapy and noted a significantly higher ADC in nonresponding lesions before therapy than in responding lesions (p=0.002). They also found an inverse correlation of baseline ADC and percent reduction in lesion size (r=−0.58; p=0.03). Cui et al. [23] also showed an inverse correlation of these values for the same tumor entity but under concomitant chemoradiotherapy (r=−0.293; p=0.006). It is assumed that tumors with higher baseline ADC have some necrotic areas, which could indicate hypoxia mediated radioresistance. However, this hypothesis cannot be generalized for all tumor entities. In a study by DeVries et al. [24], no differences between baseline ADC value was found for responders and nonresponders in rectal carcinoma, as is also the case in our study.
Seven responding lesions had decreased ADCmean values after PRRT. Further assessment of these target lesions demonstrated that they had a high mean pretherapy ADCmean of 1.81×10⁻³ mm2/s with four of the lesions having a baseline ADCmean of >2.0×10⁻³ mm2/s. It is possible that the ADCmean change is related to fibrosis as these lesions also exhibited marked reductions in size.
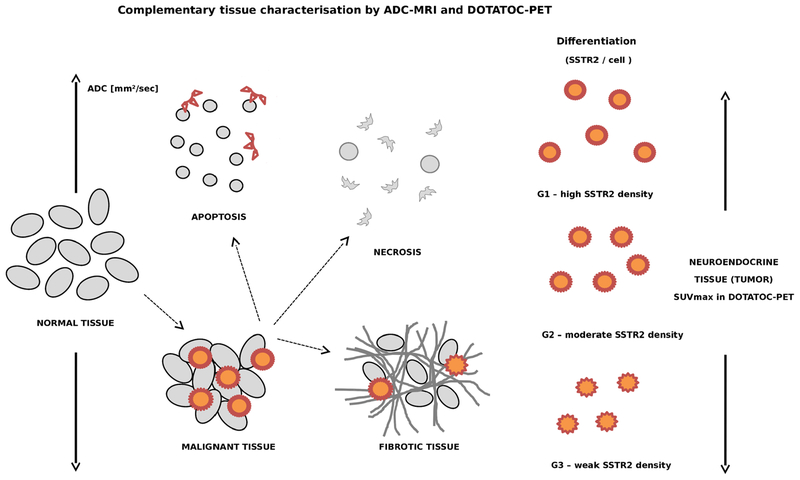
In general, a low ADC is associated with high cell density [25, 26] and low water diffusivity (Fig. 6). This could negatively affect the saturation of somatostatin-receptors (SSTR) with 90Y-/177Lu-DOTATOC because the ability of the radiopeptide to diffuse in densely packed cells could be hindered. As the uptake of radiolabeled DOTATOC is essential for inducing radiation damage in tumor tissue [17, 27, 28], this could explain why there was a minor response in lesions with high cell density. This thesis is supported by the significant correlation of ADCmean and SUVmax before therapy (r=0.50; p=0.007). At higher baseline ADCmean—and thus lower cell density—we found a higher uptake of 68Ga-DOTATOC in PET/CT. In future studies, the additional evaluation of minimum ADC (ADCmin) could be of interest, as this value has shown a correlation to SUVmax in a very recent study [29]. Further investigation will be needed to determine the impact of ADCmin assessment.
Fig. 6.
Complementary tissue characterisation by DW-MRI and DOTATOC-PET—ADC depends on cell density. Changes with apoptosis or necroses to higher values whereas high density of tumor cells or fibrotic tissue can translate to low ADC values. In contrast, the SUVmax in DOTATOC-PET depends on the density of SSTR on cell surface (correlates to grading), the density of tumor cells within a given tumor volume and accessibility of the receptors for the tracer (depends on intratumoral pressure).
In our study, the ADCmean of RL and NRL increased significantly under PRRT. This increase can either be ascribed to therapy-induced cell damage or to new intrametastatic necrotic areas which spontaneously arise in proliferating tumors. The differentiation between these two options is challenging [30, 31]. In RL, the increase in ADCmean was accompanied by a decrease in SUVmax, which implies a cell loss due to PRRT. In NRL, the rise of ADCmean came along with tumor growth and an increase in SUVmax. Conceivably, there can be a combination of newly formed necrotic areas that increase the ADCmean and proliferating vital tumor tissue which causes the lesions’ growth and the higher uptake of 68Ga-DOTATOC.
The ADCmean of normal liver tissue and spleen showed no significant differences after therapy. This speaks for the specific impact of the PRRT on tumor tissue while sparing healthy surrounding structures.
Before therapy, the SUVmax of RL was higher than the SUVmax of NRL; however, the difference was not significant. Gabriel et al. [32] also found no significant difference in baseline SUVmax of responders and nonresponders in their study evaluating the efficacy of intravenous PRRT with 68Ga-DOTATOC-PET. Campana et al. [33] investigated the role of 68Ga-DOTANOC uptake as a prognostic factor in neuroendocrine tumors. Patients with partial remission or stable disease showed a significantly higher SUVmax than patients with progressive disease.
In our study, the baseline SUVmax of the target lesions correlated inversely with the percent change of LD, volume, and SUVmax under PRRT. A higher pretreatment SUVmax was associated with a greater decrease of lesion size and SUVmax during therapy. These results are endorsed by the report of Koukouraki et al. [34], in which an elevated baseline SUVmax was associated with higher binding of 68Ga-DOTATOC on SSTR2 and thus with a favorable effect of PRRT.
SUVmax of RL decreased by 24.1 % whereas it increased by 3.9 % in NRL. A significant correlation was found between percent change of LD/volume and percent change of SUVmax under PRRT. Therefore, a decrease in lesion size often was accompanied by a decrease of SUVmax and vice versa. Kroiss et al. [35] also found a lower SUVmax in hepatic metastases under PRRT, and Gabriel et al. [32] reported a higher relative decrease of 68Ga uptake under systemic PRRT in responders than in nonresponders.
However, Gabriel et al. [32] could not find clear correlations of SUV values with outcome parameters. In this study, the decrease in SUVmax under PRRT with concomitant shrinking of the target lesions can probably be ascribed to necrosis and apoptosis of tumor cells. The second follow-up of the nonresponding lesions showed that lesions with a decrease in SUVmax after the first follow-up also eventually decreased in size after longer time periods. The percentage decrease of SUVmax under PRRT could thus suggest therapy response.
In this study, the SUVmax of the spleen (n=8) rose by 34.0 % in the observation period, whereas the 68Ga-DOTATOC uptake in the liver remained stable. Haug et al. [36] reported already that PRRT can influence the 68Ga-DOTATATE uptake in neuroendocrine tumors and the spleen with the SUVmax in the spleen being lower before therapy. The leading thought here is that a successful PRRT reduces the tracer uptake specifically in the tumor and hence more tracer is left in the blood stream for physiological uptake in the spleen and other organs. This is supported by the observation of an unchanged ADCmean in the spleen.
Conclusion
High initial SUVmax values in 68Ga-DOTATOC-PET as well as high ADCmean values in DW-MRI both suggest better therapeutic response to PRRT. A decrease in SUVmax in DOTATOC-PET is a good surrogate for early response assessment after one to two cycles of therapy. In contrast, DW-MRI presents both treatment-induced tumor necrosis and a higher tumor cellularity due to continuing tumor growth resulting in the same changes of ADCmean values. Therefore, in the setting of NET, the ADCmean value—while a promising biomarker—should be interpreted only in combination with SSTR expression or imaging morphology.
Acknowledgements.
We highly appreciate the support of PD Dr. S. Ley in DWI sequence adaptation and Dr. T. Kuder in DWI sequence analysis.
Footnotes
Conflict of Interest. There is no conflict of interest from the authors of this scientific work.
References
- 1.Schimmack S, Svejda B, Lawrence B et al. (2011) The diversity and commonalities of gastroenteropancreatic neuroendocrine tumors. Lan-genbecks Arch Surg 396:273–298 [DOI] [PubMed] [Google Scholar]
- 2.Lawrence B, Gustafsson BI, Chan A et al. (2011) The epidemiology of gastroenteropancreatic neuroendocrine tumors. Endocrinol Metab Clin North Am 40:1–18, vii [DOI] [PubMed] [Google Scholar]
- 3.Oberg K, Castellano D (2011) Current knowledge on diagnosis and staging of neuroendocrine tumors. Cancer Metastasis Rev 30(Suppl 1):3–7 [DOI] [PubMed] [Google Scholar]
- 4.Yao JC, Hassan M, Phan A et al. (2008) One hundred years after “carcinoid”: epidemiology of and prognostic factors for neuroendocrine tumors in 35,825 cases in the United States. J Clin Oncol 26:3063–3072 [DOI] [PubMed] [Google Scholar]
- 5.Giesel FL, Kratochwil C, Mehndiratta A et al. (2012) Comparison of neuroendocrine tumor detection and characterization using DOTATOC-PET in correlation with contrast enhanced CT and delayed contrast enhanced MRI. Eur J Radiol 81:2820–2825 [DOI] [PubMed] [Google Scholar]
- 6.Giesel FL, Wulfert S, Zechmann CM et al. (2013) Contrast-enhanced ultrasound monitoring of perfusion changes in hepatic neuroendocrine metastases after systemic versus selective arterial 177Lu/90Y-DOTATOC and 213Bi-DOTATOC radiopeptide therapy. Exp Oncol 35:122–126 [PubMed] [Google Scholar]
- 7.Pape UF, Bohmig M, Berndt U et al. (2004) Survival and clinical outcome of patients with neuroendocrine tumors of the gastroenter-opancreatic tract in a german referral center. Ann N Y Acad Sci 1014:222–233 [DOI] [PubMed] [Google Scholar]
- 8.Modlin IM, Lye KD, Kidd M (2003) A 5-decade analysis of 13,715 carcinoid tumors. Cancer 97:934–959 [DOI] [PubMed] [Google Scholar]
- 9.Ghevariya V, Malieckal A, Ghevariya N et al. (2009) Carcinoid tumors of the gastrointestinal tract. South Med J 102:1032–1040 [DOI] [PubMed] [Google Scholar]
- 10.Roche A, Girish BV, de Baere T et al. (2003) Trans-catheter arterial chemoembolization as first-line treatment for hepatic metastases from endocrine tumors. Eur Radiol 13:136–140 [DOI] [PubMed] [Google Scholar]
- 11.Pitt SC, Knuth J, Keily JM et al. (2008) Hepatic neuroendocrine metastases: chemo- or bland embolization? J Gastrointest Surg 12:1951–1960 [DOI] [PMC free article] [PubMed] [Google Scholar]
- 12.Vogl TJ, Naguib NN, Zangos S et al. (2009) Liver metastases of neuroendocrine carcinomas: interventional treatment via transarterial embolization, chemoembolization and thermal ablation. Eur J Radiol 72:517–528 [DOI] [PubMed] [Google Scholar]
- 13.Nazario J, Gupta S (2010) Transarterial liver-directed therapies of neuroendocrine hepatic metastases. Semin Oncol 37:118–126 [DOI] [PubMed] [Google Scholar]
- 14.Mayo SC, de Jong MC, Pulitano C et al. (2010) Surgical management of hepatic neuroendocrine tumor metastasis: results from an international multi-institutional analysis. Ann Surg Oncol 17:3129–3136 [DOI] [PubMed] [Google Scholar]
- 15.Strosberg JR, Cheema A, Kvols LK (2011) A review of systemic and liver-directed therapies for metastatic neuroendocrine tumors of the gastroenteropancreatic tract. Cancer Control 18:127–137 [DOI] [PubMed] [Google Scholar]
- 16.McStay MK, Maudgil D, Williams M et al. (2005) Large-volume liver metastases from neuroendocrine tumors: hepatic intraarterial 90Y-DOTA-lanreotide as effective palliative therapy. Radiology 237:718–726 [DOI] [PubMed] [Google Scholar]
- 17.Kratochwil C, Giesel FL, Lopez-Benitez R et al. (2010) Intraindividual comparison of selective arterial versus venous 68Ga-DOTATOC PET/CT in patients with gastroenteropancreatic neuroendocrine tumors. Clin Cancer Res 16:2899–2905 [DOI] [PubMed] [Google Scholar]
- 18.Kratochwil C, Lopez-Benitez R, Mier W et al. (2011) Hepatic arterial infusion enhances DOTATOC radiopeptide therapy in patients with neuroendocrine liver metastases. Endocr Relat Cancer 18:595–602 [DOI] [PMC free article] [PubMed] [Google Scholar]
- 19.Reubi JC, Waser B (2003) Concomitant expression of several peptide receptors in neuroendocrine tumours: molecular basis for in vivo multi-receptor tumour targeting. Eur J Nucl Med Mol Imaging 30:781–793 [DOI] [PubMed] [Google Scholar]
- 20.de Herder WW, Hofland LJ, van der Lely AJ et al. (2003) Somatostatin receptors in gastroentero-pancreatic neuroendocrine tumours. Endocr Relat Cancer 10:451–458 [DOI] [PubMed] [Google Scholar]
- 21.Forner A, Ayuso C, Varela M et al. (2009) Evaluation of tumor response after locoregional therapies in hepatocellular carcinoma: are response evaluation criteria in solid tumors reliable? Cancer 115:616–623 [DOI] [PubMed] [Google Scholar]
- 22.Koh DM, Scurr E, Collins D et al. (2007) Predicting response of colorectal hepatic metastasis: value of pretreatment apparent diffusion coefficients. AJR Am J Roentgenol 188:1001–1008 [DOI] [PubMed] [Google Scholar]
- 23.Cui Y, Zhang XP, Sun YS et al. (2008) Apparent diffusion coefficient: potential imaging biomarker for prediction and early detection of response to chemotherapy in hepatic metastases. Radiology 248:894–900 [DOI] [PubMed] [Google Scholar]
- 24.DeVries AF, Kremser C, Hein PA et al. (2003) Tumor microcirculation and diffusion predict therapy outcome for primary rectal carcinoma. Int J Radiat Oncol Biol Phys 56:958–965 [DOI] [PubMed] [Google Scholar]
- 25.Herneth AM, Guccione S, Bednarski M (2003) Apparent diffusion coefficient: a quantitative parameter for in vivo tumor characterization. Eur J Radiol 45:208–213 [DOI] [PubMed] [Google Scholar]
- 26.Patterson DM, Padhani AR, Collins DJ (2008) Technology insight: water diffusion MRI—a potential new biomarker of response to cancer therapy. Nat Clin Pract Oncol 5:220–233 [DOI] [PubMed] [Google Scholar]
- 27.Kaltsas GA, Papadogias D, Makras P et al. (2005) Treatment of advanced neuroendocrine tumours with radiolabelled somatostatin analogues. Endocr Relat Cancer 12:683–699 [DOI] [PubMed] [Google Scholar]
- 28.Reubi JC (2004) Somatostatin and other peptide receptors as tools for tumor diagnosis and treatment. Neuroendocrinology 80(Suppl 1):51–56 [DOI] [PubMed] [Google Scholar]
- 29.Rakheja R, Chandarana H, Demello L et al. (2013) Correlation between standardized uptake value and apparent diffusion coefficient of neoplastic lesions evaluated with whole-body simultaneous hybrid PET/MRI. AJR Am J Roentgenol 201:1115–1119 [DOI] [PubMed] [Google Scholar]
- 30.Cha J, Kim ST, Kim HJ et al. (2013) Analysis of the layering pattern of the apparent diffusion coefficient (ADC) for differentiation of radiation necrosis from tumour progression. Eur Radiol 23:879–886 [DOI] [PubMed] [Google Scholar]
- 31.Thoeny HC, Ross BD (2010) Predicting and monitoring cancer treatment response with diffusion-weighted MRI. J Magn Reson Imaging 32:2–16 [DOI] [PMC free article] [PubMed] [Google Scholar]
- 32.Gabriel M, Decristoforo C, Kendler D et al. (2007) 68Ga-DOTA-Tyr3-octreotide PET in neuroendocrine tumors: comparison with somatostatin receptor scintigraphy and CT. J Nucl Med 48:508–518 [DOI] [PubMed] [Google Scholar]
- 33.Campana D, Ambrosini V, Pezzilli R et al. (2010) Standardized uptake values of (68)Ga-DOTANOC PET: a promising prognostic tool in neuroendocrine tumors. J Nucl Med 51:353–359 [DOI] [PubMed] [Google Scholar]
- 34.Koukouraki S, Strauss LG, Georgoulias V et al. (2006) Evaluation of the pharmacokinetics of 68Ga-DOTATOC in patients with metastatic neuroendocrine tumours scheduled for 90Y-DOTATOC therapy. Eur J Nucl Med Mol Imaging 33:460–466 [DOI] [PubMed] [Google Scholar]
- 35.Kroiss A, Putzer D, Decristoforo C et al. (2013) (68)Ga-DOTA-TOC uptake in neuroendocrine tumour and healthy tissue: differentiation of physiological uptake and pathological processes in PET/CT. Eur J Nucl Med Mol Imaging 40(4):514–523 [DOI] [PubMed] [Google Scholar]
- 36.Haug AR, Auernhammer CJ, Wangler B et al. (2010) 68Ga-DOTA-TATE PET/CT for the early prediction of response to somatostatin receptor-mediated radionuclide therapy in patients with well-differentiated neuroendocrine tumors. J Nucl Med 51:1349–1356 [DOI] [PubMed] [Google Scholar]


