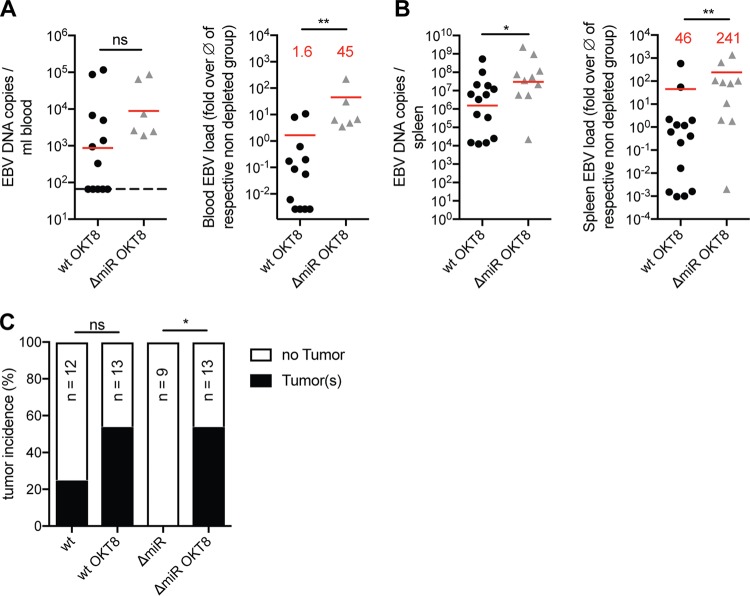
FIG 5.
CD8 depletion rescues impaired viral infectious capacity of EBV devoid of its miRNAs. (A and B) Blood (A) and spleen (B) DNA viral loads determined by qPCR of huNSG mice (n = 5 to 14/group) infected with either wt or ΔmiR EBV and treated with OKT8 for CD8+ T cell depletion (left) or the matching relative viral loads normalized to the mean of the corresponding nondepleted groups (n = 8 to 12/group) with the indication of the fold difference (red) for the different infection groups (right) 5 weeks p.i. (A) Horizontal dashed line indicates the lower limit of quantification (LLOQ). Values below the LLOQ were raised to the LLOQ and plotted on the LLOQ line. (C) Frequency of tumor formation observed in mice infected with wt or ΔmiR EBV nontreated or treated with OKT8. (A and B) Pooled data from 4 experiments with geometric mean (left) and arithmetic mean (right). *, P ≤ 0.05; **, P ≤ 0.01, Mann-Whitney U test. (C) Pooled data from 4 experiments. *, P ≤ 0.05, Fisher’s exact test.

