

Abstract
Objectives:
While one third or more of critically ill patients in the U.S. are obese, obesity is not incorporated as a contributing factor in any of the commonly used severity of illness scores. We hypothesize that selected severity of illness scores would perform differently if BMI categorization was incorporated, and that the performance of these score models would improve after consideration of BMI as an additional model feature.
Design:
Retrospective cohort analysis from a multicenter ICU database which contains de-identified data for more than 200,000 ICU admissions from 208 distinct ICUs across the USA between 2014 and 2015.
Setting:
First ICU admission of patients with documented height and weight.
Patients:
108,402 patients from 189 different ICUs across USA were included in the analyses, of whom 4,661 (4%) were classified as underweight, 32,134 (30%) as normal weight, 32,278 (30%) as overweight, 30,259 (28%) as obese and 9,070 (8%) as morbidly obese.
Interventions:
None
Measurements and main results:
To assess the effect of adding BMI as a risk adjustment element to the APACHE IV and OASIS scoring systems, we examined the impact of this addition on both discrimination and calibration. We performed three assessments based upon: (1) the original scoring systems, (2) a recalibrated version of the systems, and (3) a recalibrated version incorporating BMI as a covariate. We also performed a subgroup analysis in groups defined using WHO guidelines for obesity. Incorporating BMI into the models provided a minor improvement in both discrimination and calibration. In a subgroup analysis, model discrimination was higher in groups with higher BMI, but calibration worsened.
Conclusion:
The performance of ICU prognostic models utilizing BMI category as a scoring element was inconsistent across BMI categories. Overall, adding BMI as a risk adjustment variable led only to a minor improvement in scoring system performance.
Keywords: body mass index, severity of illness score, outcome, obesity, hospital mortality
INTRODUCTION
Obesity, defined as a body mass index (BMI) ≥ 30 kg/m2, is a global pandemic with steadily increasing incidence (1). In 2015, it was estimated that over 2.3 billion people were overweight (BMI of 25 to 29 kg/m2), and more than 700 million were obese (2). Moreover, the prevalence of morbid obesity (BMI ≥40 kg/m2) in some ethnic groups increased by 76% between 2000 and 2012 (3).
Due to the rising prevalence of obesity along with high rates of associated comorbidities, obese patients are common in the intensive care unit (ICU) and account for almost one-third of all ICU admissions (4). This number is expected to increase as the prevalence of obesity continues to rise (5).
Despite its potential importance, none of the commonly used severity of illness scoring systems incorporate BMI in their risk adjustment; these include the Acute Physiology and Chronic Health Evaluation IV (APACHE IV) system (6), the Oxford Acute Severity of Illness Score (OASIS) (7), the Sequential Organ Failure Assessment (SOFA) score (8) and the Simplified Acute Physiology Score (SAPS) 3 (9).
Usually the performance of prognostic models is evaluated by two properties: discrimination and calibration, both necessary for most clinical applications of a model (10,11). Discrimination quantifies the score’s ability to distinguish the two populations, most commonly measured by the area under the receiver operator characteristic curve (AUROC). Calibration measures the level of agreement between the predicted risk of a model and the observed frequency of occurrence either by visual inspection of a calibration curve, or the Hosmer-Lemeshow test and the standardized mortality ratio (SMR) (11).
However, it is also well known that the performance of any predictive model may deteriorate over time (12–15). The resulting suboptimal performance is mainly due to changes in clinical practice and in the case mix of the population that necessitate updates to the models using contemporary data (16). When the discrimination of a model is high but the calibration is poor then a relatively simple recalibration, consisting of shifting and scaling the original score by fixed amounts, may sufficiently improve the calibration (17). As obesity has newly emerged as a global health issue, it seems essential that we determine whether adding this variable into the models would improve their performance.
In a recent study, we showed that critically ill obese patients could be misclassified by severity of illness scores (18). In that study, we demonstrated that a fundamental assumption of these prognostic models may be flawed in that identical ICU severity scores may reflect changes from disparate baselines when non-identical populations are considered. Obese and normal weight ICU patients demonstrated different laboratory deviations from baseline which could potentially lead to errors in predicted mortality (18). In the absence of prior studies on the effect of BMI on severity scores, we hypothesized that these scores would perform differently if BMI was included as a scoring value. To investigate these questions, we analyzed a large multicenter ICU database and compared the performance of the original and recalibrated APACHE IV and OASIS mortality predictions among critically ill patients within different BMI categories. We then evaluated the impact of adding BMI as a covariate on the performance of the scores.
METHODS
The present study is reported in accordance with the STrengthening the Reporting of Observational studies in Epidemiology (STROBE) statement (19).
Study design
We performed a secondary analysis of electronic health records of patients included in the eICU Collaborative Research Database (eICU-CRD), which contains de-identified data for more than 200,000 ICU admissions from 208 distinct ICUs across the USA, between 2014 and 2015. The eICU-CRD contains high resolution patient data, including information about patient admission, discharge, demographic data, physiologic data (from bedside monitors, ventilators, and other devices), laboratory results, severity scores, procedures and medications (20).
Ethical approval
This study was exempt from institutional review board approval due to the retrospective design, lack of direct patient intervention, and the security schema for which the re-identification risk was certified as meeting safe harbor standards by Privacert (Cambridge, MA) (Health Insurance Portability and Accountability Act Certification no. 1031219-2).
Study population
All patients in the eICU-CRD were eligible for inclusion. Only the first ICU admission from all hospitalizations, for adult patients (age ≥ 16 years) was included. Patients were required to fulfill all criteria for having an APACHE IV score and have available documentation of height and weight on admission to the ICU. We excluded patients with pregnancy-related diagnoses.
Data extraction
The following patient characteristics were collected: age, gender, ethnicity, Charlson comorbidity index (21), APACHE IV mortality prediction (6), OASIS (7) and SOFA score on ICU admission (8), APACHE IV comorbidity variables (6), APACHE IV admission diagnosis, type of ICU admission (emergency, urgent, elective), ICU admission source (emergency department, operating room, floor), ICU admission unit, presence of mechanical ventilation in the first 24 hours of ICU admission, length of stay (both ICU and hospital), and information about patient diagnoses and specific treatments documented closely to admission using International Classification of Diseases (ICD-9) codes. Hospital characteristics collected included geographical region of the hospital, teaching status, and hospital capacity (number of beds). In our final cohort, all data was complete except for 1% of ethnicity data.
Data preparation and definitions
The data was assessed for completeness and consistency. Obesity was classified using the World Health Organization (WHO) scale (22) adopting the patient’s BMI (calculated using the hospital admission weight in kilograms divided by the square of the hospital admission height in meters). Patients were stratified into five categories according to their BMI: underweight (BMI < 18.5 kg/m2), normal weight (18.5 ≤ BMI < 25 kg/m2), overweight (25 ≤ BMI < 30 kg/m2), obese (30 ≤ BMI < 40 kg/m2) and morbid obesity (BMI of ≥ 40 kg/m2).
Outcomes
The primary outcome was in–hospital mortality. Secondary outcomes included ICU and hospital lengths of stay.
Statistical analysis and new scoring system models
In all analyses, patients were categorized into groups according to their BMI group as described above. We used quantile-quantile normal plots to assess the appropriateness of assuming normality. Continuous variables are presented as means and standard deviations if normally distributed, or medians with 25th and 75th percentiles otherwise. Categorical variables are presented as total number and percentage. Proportions are compared using the χ2 or Fisher exact tests, while continuous variables are compared using the ANOVA or the Kruskal-Wallis test, as appropriate. Two-sided p values <0.05 were considered statistically significant.
We tested the performance, as determined by discrimination and calibration, of both original scores (APACHE IV and OASIS) within BMI categories and across the entire cohort. To test discrimination, the area under the receiver operator characteristic curve (AUC) with its 95% confidential interval (CI) was calculated. The AUC was classified as excellent, very good, good, fair, and poor when AUCs were ≥ 0.9, 0.8 to 0.89, 0.7 to 0.79, 0.6 to 0.69 or < 0.6, respectively (23). The calibration was assessed with the standard mortality ratio (SMR) of observed to predicted mortality rates, including 95% confidence intervals (CI), as well as the calibration belt with p < 0.05 indicating good model calibration (24). The Hosmer-Lemeshow test was not performed as its interpretation may not be reliably helpful for larger datasets (25).
New Scoring System Models
To assess the effect of adding BMI as a risk adjustment value on both APACHE IV (AIV) and OASIS scores, we created four different logistic regression models. For the development of the new models, we divided our cohort into sets of patients from different hospitals. Out of the 189 hospitals from our cohort, 95 hospitals were selected for training (57,929 ICU admissions) and 94 hospitals were selected for the test set (50,473 ICU admissions). Hospital characteristics, namely bed capacity, US region, and teaching status are provided in the supplemental digital content for the training and test sets. Using the training set, we recalibrated the final mortality predictions from the original APACHE IV system by constructing a univariable logistic regression with the predictions as the only input - this is referred to as the ‘recalibrated’ APACHE IV, or r-AIV. Finally, we added the BMI categories to the recalibration model as additional binary covariates to assess the impact of adding BMI. We refer to this model as r-AIV-BMI. A similar procedure was taken using OASIS, resulting in a recalibrated model, r-OASIS, and a recalibrated model with BMI, r-OASIS-BMI.
The performance of these models (AIV, r-AIV, r-AIV-BMI, OASIS, r-OASIS, r-OASIS-BMI) were evaluated on the test set. Model discrimination was evaluated using the AUC with 95% CI, while calibration was assessed using SMR with its 95% CI and the calibration belt.
All analyses were performed with R v.3.3.2 (http://www.R-project.org). The data extraction queries and code are available online (26): https://github.com/deliberato/SOI_perfomance_BMI
RESULTS
Population
Of the 200,859 patients in the eICU database, 61,492 patients had been admitted for the second or more time at the hospital and/or at the ICU, 23,041 did not satisfy APACHE IV inclusion criteria (5), 3,805 were admitted for pregnancy-related diagnoses. 3,290 patients had their height and/or weight missing and were also excluded from the study. This resulted in the final cohort of 108,402 patients (Supplemental Figure 1). Within the final cohort, 4,661 (4%) were classified as underweight, 32,134 (30%) as normal weight, 32,278 (30%) as overweight, 30,259 (28%) as obese, and 9,070 (8%) as morbid obesity.
Baseline characteristics are summarized in Table 1. Underweight patients were older but had fewer APACHE IV comorbidities than obese patients. Most patients were Caucasian and admitted from the emergency department. The region and hospital size where the patients were admitted were similar across the BMI groups; however morbid obesity patients were more likely to be admitted to a teaching hospital.
Table 1.
Demographics Characteristics
| Variable | Underweight (N= 4,661) |
Normal weight (N=32,134) |
Overweight N= 32,278) |
Obese (N=30,259) |
Morbid Obesity (N= 9,070) |
|---|---|---|---|---|---|
| Age (years): median [IQR] | 68 [54 – 80] | 67 [53 – 80] | 66 [53 – 73] | 64 [53 – 73] | 60 [49 – 78] |
| Male: n (%) | 1,948 (41.8) | 17,168 (53.4) | 19,486 (60.4) | 16,631 (55.0) | 3,776 (41.6) |
| Ethnicity: Caucasian, n (%) | 3,562 (77.1) | 24,778 (78.0) | 24,935 (78.1) | 23,581 (78.8) | 6,872 (76.6) |
| BMI: median [IQR] | 17.1 [16.0 – 17.9] |
22.5 [20.9 – 23.8] |
27.3 [26.1 – 28.6] |
33.4 [31.5 – 35.9] |
44.6 [41.8 – 49.3] |
| ≥ 1 of APACHE IV comorbidities: n (%) | 932 (20.0) | 7,031 (21.8) | 8,235 (25.5) | 9,783 (32.3) | 3,614 (39.8) |
| Charlson Comorbidity Index: median [IQR] | 4 [2 – 6] | 4 [2 – 6] | 3 [2 – 5] | 3 [2 – 5] | 3 [1 – 5] |
| ICU admission source: Emergency room, n (%) | 3,073 (65.9) | 20,455 (63.7) | 19,598 (60.7) | 17,920 (59.2) | 5,481 (60.4) |
| ICU admission unit: n (%) | |||||
| Mixed ICU | 2,715 (58.2) | 18,096 (56.3) | 17,228 (53.4) | 15,991 (52.8) | 5,117 (56.4) |
| Cardiac ICU | 858 (18.4) | 6,441 (20.0) | 7,631 (23.6) | 7,449 (24.6) | 1,897 (20.9) |
| MICU | 503 (10.8) | 2,765 (8.6) | 2,567 (8.0) | 2,444 (8.1) | 895 (9.9) |
| Neuro ICU | 285 (6.1) | 2,704 (8.4) | 2,656 (8.2) | 2,423 (8.0) | 593 (6.5) |
| Surgical ICU | 300 (6.4) | 2,128 (6.6) | 2,196 (6.8) | 1,952 (6.5) | 568 (6.3) |
| Region: n (%) | |||||
| Midwest | 1,444 (31.0) | 10,458 (32.5) | 10,998 (34.1) | 10,992 (36.3) | 3,498 (38.6) |
| South | 1,760 (37.8) | 11,133 (34.6) | 11,111 (34.4) | 10,099 (33.4) | 3,055 (33.7) |
| West | 857 (18.4) | 6,325 (19.7) | 6,100 (18.9) | 5,276 (17.4) | 1,369 (15.1) |
| Northeast | 325 (7.0) | 2,323 (7.2) | 2,351 (7.3) | 2,391 (7.9) | 718 (7.9) |
| Hospital capacity (number of beds) n (%) | |||||
| >500 | 1,737 (37.3) | 12,541 (39.0) | 12,995 (40.3) | 12,600 (41.6) | 3,700 (40.8) |
| 250–500 | 1,134 (24.3) | 7,933 (24.7) | 8,029 (24.9) | 7,066 (23.4) | 2,067 (22.8) |
| 100–249 | 1,138 (24.4) | 7,586 (23.6) | 7,471 (23.1) | 7,068 (23.4) | 2,170 (23.9) |
| <100 | 282 (6.1) | 1,642 (5.1) | 1,509 (4.7) | 1,429 (4.7) | 510 (5.6) |
| Teaching hospital: n (%) | 1,089 (24.4) | 8,010 (26.0) | 8,349 (26.9) | 8,470 (29.0) | 2,578 (29.4) |
| ICU admission diagnosis: n (%) | |||||
| Sepsis, including pneumonia | 873 (18.7) | 4,936 (15.3) | 4,169 (12.9) | 3,967 (13.1) | 1,549 (17.1) |
| Cardiovascular disease | 677 (14.5) | 6,336 (19.7) | 8,383 (25.9) | 8,303 (27.4) | 2,080 (22.9) |
| Other respiratory condition | 750 (16.1) | 2,929 (9.1) | 2,344 (7.2) | 2,466 (8.1) | 1,159 (12.7) |
| Neurological condition | 549 (11.7) | 5,008 (15.6) | 5,063 (15.7) | 4,551 (15.0) | 1,089 (12.0) |
| Renal condition | 88 (2.0) | 562 (2.0) | 599 (2.0) | 683 (2.0) | 280 (3.0) |
| Other | 1,724 (37.0) | 12,363 (38.3) | 11,270 (36.3) | 10,289 (34.4) | 2,913 (32.3) |
| Reason for ICU admission: Medical, n (%) | 4003 (85.9) | 26105 (81.2) | 25081 (77.7) | 23379 (77.3) | 7412 (81.7) |
| SOFA score: median [IQR] | 5 [2 – 7] | 4 [2 – 7] | 4 [2 – 7] | 4 [2 – 7] | 5 [2 – 7] |
| APACHE IV score: median [IQR] | 56 [42 – 74] | 53 [39 – 70] | 50 [37 – 67] | 49 [36 – 66] | 49 [35 – 67] |
| OASIS score: median [IQR] | 31 [25 – 38] | 29 [23 – 37] | 28 [22 – 35] | 28 [22 – 35] | 29 [23 – 36] |
| Intubated in the first 24 hours of ICU admission (YES): n (%) | 606 (13.0) | 4,456 (13.9) | 5,009 (15.5) | 5,132 (17.0) | 1,560 (17.2) |
| ICU (days) LOS: median [IQR] | 1.9 [1.0 – 3.3] | 1.8 [0.9 – 3.1] | 1.7 [0.9 – 3.1] | 1.8 [1.0 – 3.3] | 1.9 [1.0 – 3.7] |
| Hospital (days) LOS: median [IQR] | 5.8 [3.1– 9.7] | 5.2 [2.8 – 9.1] | 5.1 [2.8 – 8.9] | 5.2 [2.9 – 9.2] | 5.7 [3.1 – 9.9] |
| Hospital mortality, n (%) | 711 (15.3) | 3,390 (10.5) | 2,778 (8.6) | 2,437 (8.1) | 772 (8.5) |
In all BMI groups, the primary reason for ICU admission was most often medical. The most common ICU admission diagnosis was cardiovascular disease, except in underweight patients who were most often admitted for sepsis. Underweight patients had higher SOFA, APACHE IV, and OASIS scores at ICU admission compared with individuals from other BMI categories. Morbidly obese patients had a higher rate of intubation in the first 24h of ICU admission, while ICU and hospital length of stay were lower in overweight patients. Obese patients had the lowest hospital mortality (Table 1).
Original APACHE IV and OASIS score performance
Overall, AIV demonstrated better discrimination (AUC = 0.86 (0.86 – 0.87)) than OASIS (AUC = 0.79 (0.78 – 0.80)). When testing calibration, both scores markedly over predicted in-hospital mortality, with SMRs of 0.70 (0.69 – 0.72) and 0.71 (0.69 – 0.73) for AIV and OASIS, respectively (Figure 1,2,3 and supplemental Table 1, Figure 2a and Figure 2b). When assessing these models’ performances according to BMI categories, both AIV and OASIS again showed good discrimination but poor calibration. When comparing BMI categories for AIV and OASIS, underweight patients had the poorest discrimination [AUC = 0.82 (0.80 – 0.84) vs 0.76 (0.74 – 0.79), respectively] and the best calibration [SMR = 0.96 (0.89 – 1.04) vs SMR = 0.99 (0.91 – 1.07), respectively] (Supplemental Table 1). In general, as BMI increased, discrimination improved but calibration worsened.
Figure 1 –
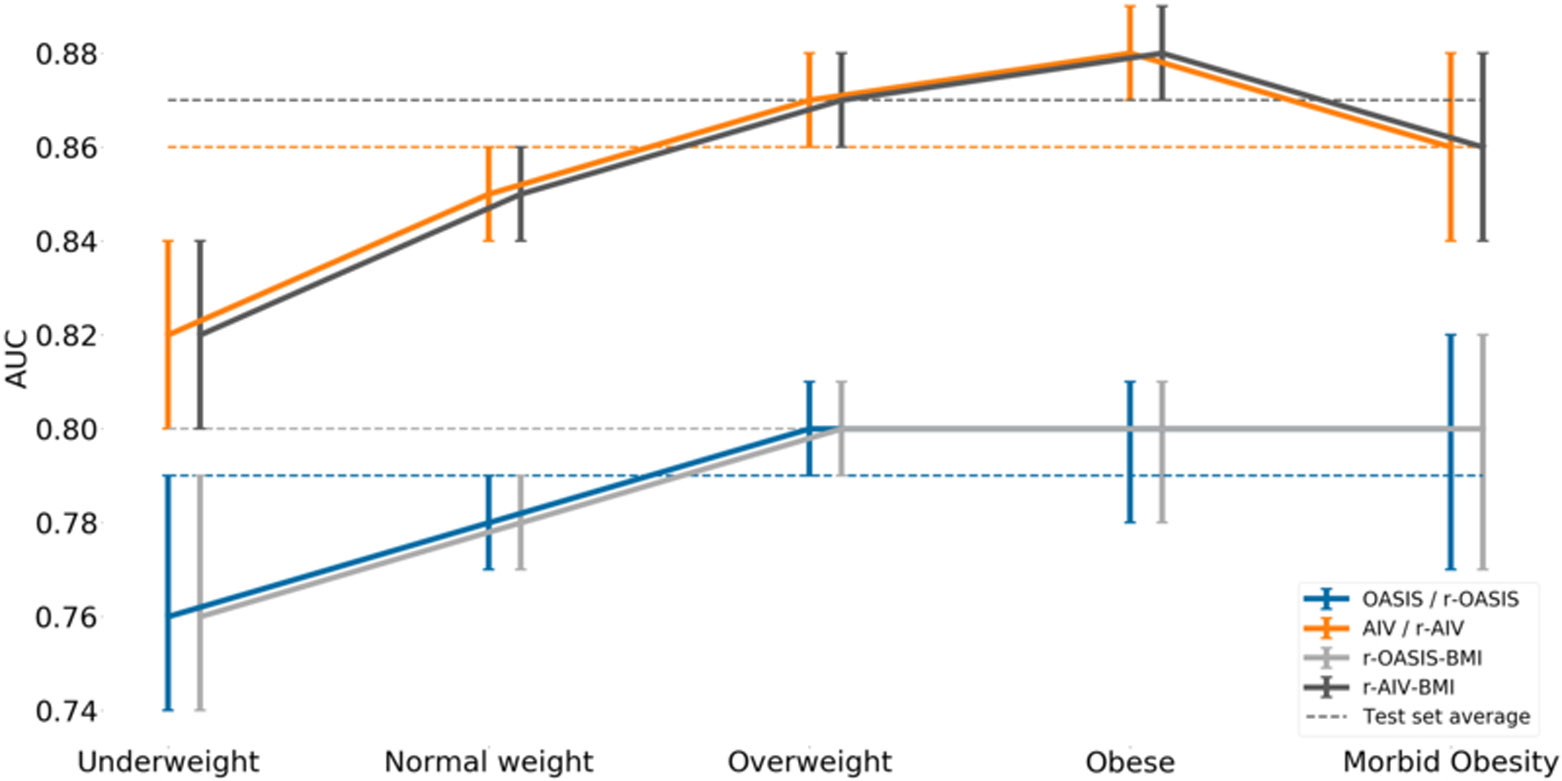
Area under the receiver operator characteristic curve (AUROC) and its 95% confidence interval for each model.
Figure 2 –
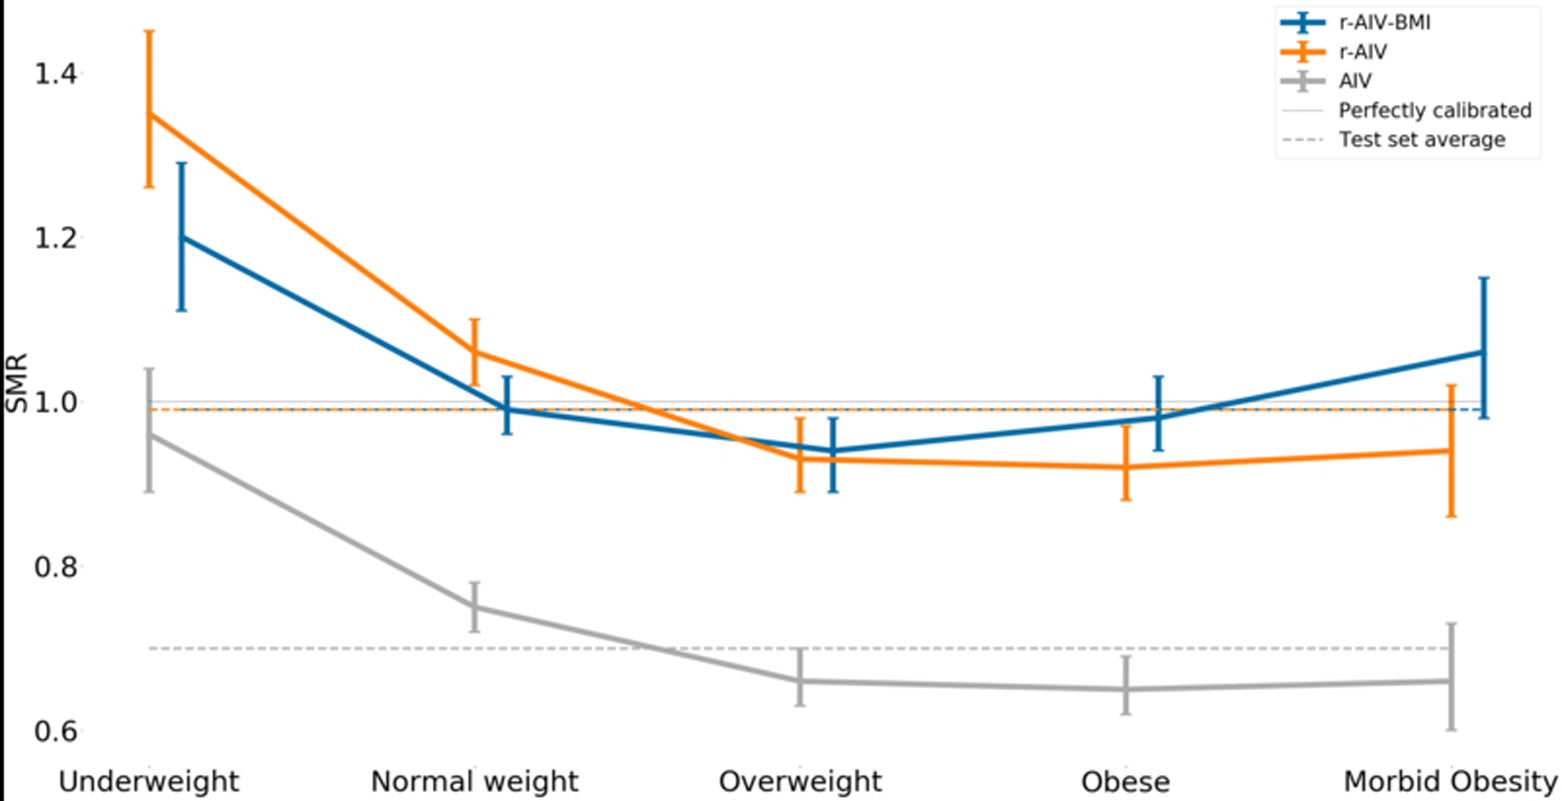
The standardized mortality ratio (SMR) and its 95% confidence interval for each APACHE model.
Figure 3 –
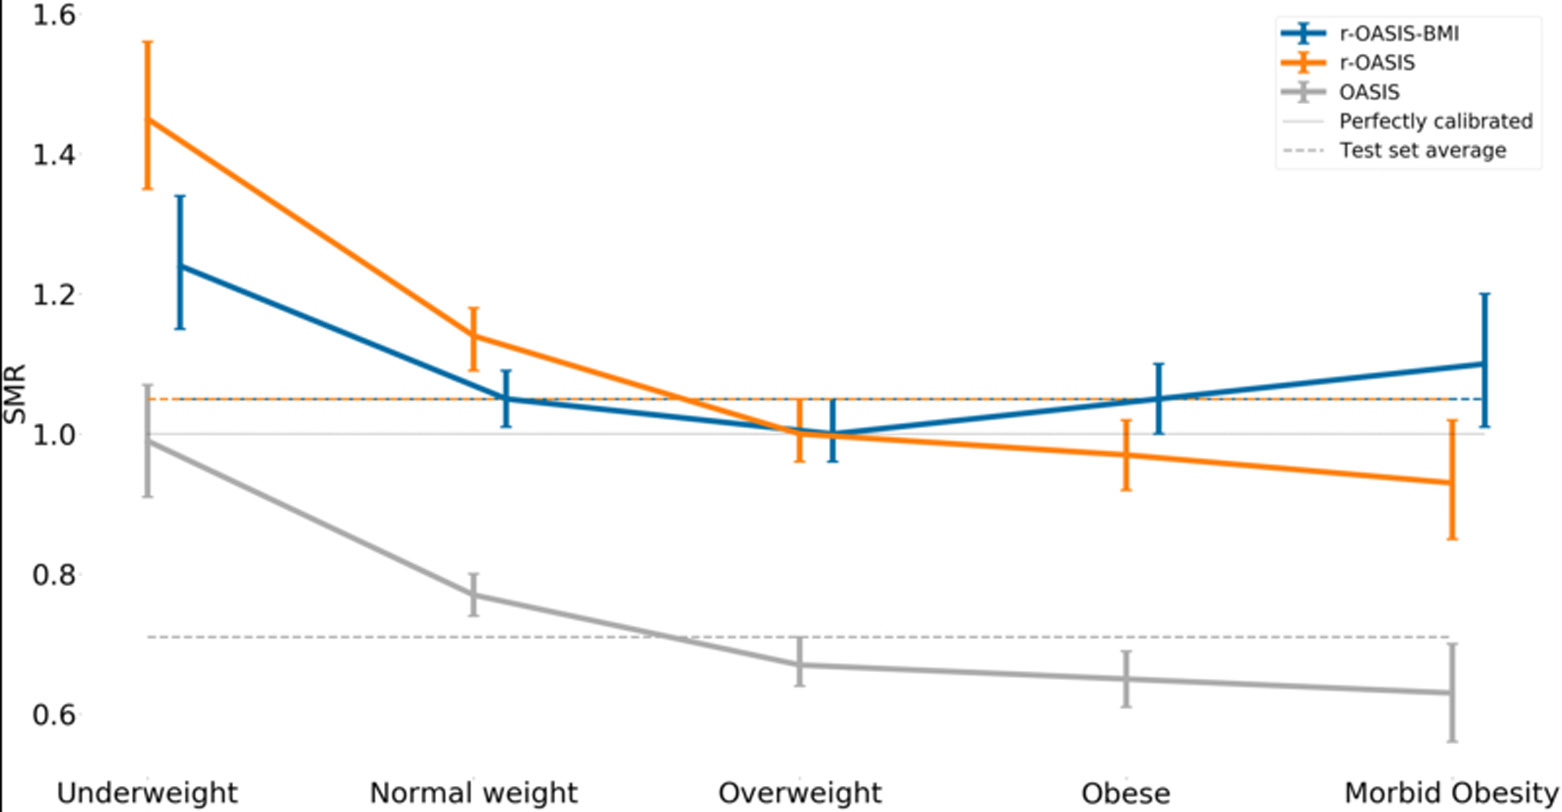
The standardized mortality ratio (SMR) and its 95% confidence interval for each OASIS model.
Performance of r-AIV and r-OASIS
The performance of the r-AIV and r-OASIS models on the test set are summarized in Figure 1,2,3 and supplemental Table 1. As expected, the univariable recalibration did not improve model discrimination. However, both recalibrated models demonstrated better SMRs, and appeared to have better calibration on calibration belt plots (Figures 2a, 2b, 2d and 2e -supplemental material).
Performance of r-AIV-BMI and r-OASIS-BMI
After incorporating BMI as an input value to the recalibrated scores, we found a minor overall improvement in their discriminative power as compared to the original models (Figure 1 and supplemental Table 1), however no statistical significant difference was found in SMR, (Figure 4). In terms of calibration, r-AIV-BMI showed a small but non-significant improvement compared with r-AIV. There was no improvement in calibration for r-OASIS-BMI and APACHE-IV, as shown in supplemental Table 1 and in supplemental Figures 2c and 2f.
Figure 4 –
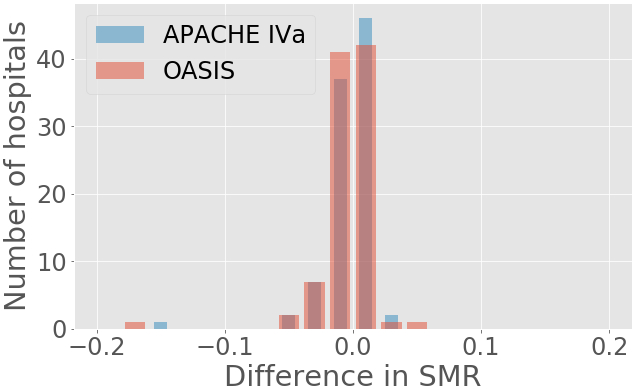
SMRs differences between recalibrated with BMI and recalibrated models.
DISCUSSION
In this large, multicenter retrospective analysis, we demonstrated that the performance of severity of illness scoring was inconsistent across BMI groups, with higher BMIs associated with comparable discrimination but poorer calibration for the original APACHE-IV and OASIS models. After recalibrating the scores by BMI group, we achieved a modest improvement in calibration over a simple recalibration. All models, even after recalibration, consistently over-predicted mortality in the high deciles of risk. This may be driven by patients with extreme physiologic derangement but low risk of mortality, such as patients admitted with diabetic ketoacidosis. Overall, the addition of BMI as a category to these two major ICU prognostic/severity scoring systems led to a very minor, or no improvement in the discrimination power of the scores.
Since their deployment in the clinical environment, prognostic scores have been widely used in critical care, principally for benchmarking and quality assessment purposes (10). Commonly utilized ICU prognostic systems include APACHE IV (6), SAPS 3 (9), MPM (Mortality Probability Model) III (27) and OASIS (7). Despite the fact that many such scoring systems are widely used around the world, there is no accepted gold standard prognostic model.
ICU prognostic models primarily use acute physiology, diagnoses, and chronic health conditions to make predictions. Except for OASIS, these models rely on logistic regression analysis to predict mortality, with APACHE IV incorporating spline terms for age and acute physiology in order to account for non-linear relationships between these variables and outcome. APACHE IV is a high dimensional model (relative to prognostic scores) which has been shown to have excellent discrimination (6). Conversely, OASIS is a parsimonious model specifically designed to provide good discrimination with very few data elements. OASIS employs only 10 acute variables from the first day of ICU admission and was created using an advanced machine learning technique which can account for non-linear relationship between measured variables and outcomes (7). Our results for the recalibrated models by BMI group were consistent for both scores in terms of discrimination and calibration, which we believe provides a reliable evaluation of possible variations in prognosis and severity scoring in the ICU context.
A possible explanation for the minor improvement found after the recalibration by BMI groups may lie in the BMI definition itself. The WHO BMI classification was created to identify people with a high risk of an undesirable health state, not to be a direct measure of body fat proportion, per se. Moreover, the BMI cutoffs are in some sense arbitrary and vary in different populations such as Asians who generally have a higher proportion of body fat compared with those of white ethnicity with the same age, sex and BMI category (22,28). Several studies have been conducted trying to establish an association between other body fat surrogates like waist circumference, body fat percentage and body fat distribution with survival, with inconsistent results (29,30).
While studies that include BMI generally focus on the obese end of the spectrum, the small number of underweight patients in any ICU population (4% in ours) may also prove to be a worthwhile target for future research. We previously reported that SOFA scoring is potentially inaccurate in obese patients because of physiological data anomalies that are present before ICU admission that may lead to deceptively high score values (18). In practice, these falsely high values may be offset by real deficits in physiological reserve among the obese that are not captured by scoring systems. It is also possible that underweight patients manifest some analogous version of prior anomalies that affect scoring. In fact, the underweight group demonstrated slightly worse discrimination but much better calibration for the two original scores (supplemental Table 1). A better understanding of this class of patients could lead to achievable therapeutic changes such as earlier and more aggressive nutrition than for patients with better metabolic reserves.
The key strength of our study is the large sample size and completeness of data within the study cohort. In addition, we also employed two different severity of illness scores to ensure the robustness of any findings.
Our study has several limitations. First, we cannot extrapolate our results for prognostic models other than APACHE IV and OASIS, or to patients admitted to ICUs outside the United States. Second, we lacked information about patients who were discharged from the hospital to a hospice, which could be considered a poor outcome but is not captured by our outcome of interest (in-hospital mortality). Third, as eICU-CRD is originally derived from a non-random sample of hospitals, our data may not be representative of all ICUs in the US.
Finally, logistic regression, the method used to develop our new models, inherently includes the strong assumption that the score components should have a linear relationship. As we transformed BMI into groups, our model is capable of capturing any non-linear relationship across these groups, but not within them. A machine learning technique (such as the one originally used to create OASIS) that considers a nonlinear interaction between these components might have led to different findings. As machine learning and artificial intelligence techniques evolve and are more generally incorporated into processes such as risk adjustment and prognosis, such techniques may replace logistic regression to become the standard approach in benchmarking.
CONCLUSION
The addition of BMI category as a clinical input variable led to a minor overall improvement in the performance of both the APACHE IV and OASIS severity and prognostic scores. The performance of both of these scoring systems is inconsistent across BMI categories; the models underpredict mortality in the underweight group and overpredict mortality in the morbidly obese group. While clinical intuition might suggest that BMI would be a useful addition to these scoring systems, our analysis does not support this conjecture. These results are consistent with the premise that data-driven and statistically supported analyses are useful and becoming increasing essential in the evaluation of clinical beliefs and practices.
Supplementary Material
ACKNOWLEDGEMENT
LAC and AEWJ are funded by the National Institute of Health through R01 grant number R01 EB017205.
Abbreviations:
- SMR
Standard Mortality Ratio
- BMI
Body Mass Index
- Difference in SMR
(r-APACHE-BMI) - (r-APACHE) or (r-OASIS-BMI) - (r-OASIS) as appropriate
Footnotes
Copyright form disclosure: Dr. Komorowski received funding from Engineering and Physical Sciences Research Council UK, and he received support for article research from Research Councils UK. Drs. Celi and Johnson received support for article research from the National Institutes of Health. The remaining authors have disclosed that they do not have any potential conflicts of interest.
Financial Support: Not applicable.
Conflict of Interests Disclosures: Nothing to declare
REFERENCES
- 1.Heymsfield SB, Wadden TA. Mechanisms, Pathophysiology, and Management of Obesity. The New England journal of medicine. 2017;376(3):254–66. [DOI] [PubMed] [Google Scholar]
- 2.Moock M, Mataloun SE, Pandolfi M, Coelho J, et al. Impact of obesity on critical care treatment in adult patients Rev bras ter intensiva. 2010;22(2):133–7. [PubMed] [Google Scholar]
- 3.Hruby A,Hu FB. The epidemiology of obesity: A big picture. Pharmacoeconomics.2015. July; 33(7): 673–689. [DOI] [PMC free article] [PubMed] [Google Scholar]
- 4.Hogue CW Jr., Stearns JD, Colantuoni E, Robinson KA, et al. The impact of obesity on outcomes after critical illness: a meta-analysis. Intensive care medicine. 2009;35(7):1152–70. [DOI] [PubMed] [Google Scholar]
- 5.GBD 2015 Collaborators Obesity et al. Health effects of overweight and obesity in 195 countires over 25 years. N Engl J Med 2017. July 6;377(1): 13–27. [DOI] [PMC free article] [PubMed] [Google Scholar]
- 6.Zimmerman JE, Kramer AA, McNair DS, Malila FM. Acute Physiology and Chronic Health Evaluation (APACHE) IV: hospital mortality assessment for today’s critically ill patients. Crit Care Med 2006;34: 1297–310. [DOI] [PubMed] [Google Scholar]
- 7.Johnson AEW, Kramer AA, Clifford G. A new severity of illness scale using a subset of acute physiology and chronic health evaluation data elements shows comparable predictive accuracy. Crit Care Med 2013;41: 1711–8. [DOI] [PubMed] [Google Scholar]
- 8.Vincent JL, Moreno R, Takala J, et al. The SOFA (Sepsis-related Organ Failure Assessment) score to describe organ dysfunction/failure. On behalf of the Working Group on Sepsis-Related Problems of the European Society of Intensive Care Medicine. Intensive Care Med 1996;22:707–10. [DOI] [PubMed] [Google Scholar]
- 9.Metnitz PG, , Almeida E, Jordan B, Bauer P, Campos RA et al. SAPS 3 - From evaluation of the patient to evaluation of the intensive care unit. Intensive Care Med 2005. October;31(10):1336–44. [DOI] [PMC free article] [PubMed] [Google Scholar]
- 10.Alba AC, Agoritsas T, Walsh M, Hanna S, Iorio A, Devereaux PJ. Discrimination and calibration of clinical prediction models: user’s guides to the medical literature. JAMA.2017. October 10; 318 (14): 1377–1384. [DOI] [PubMed] [Google Scholar]
- 11.Leisman DE. Rare events in the ICU: An emerging challenge in classification and prediction. Crit Care Med 2018. March; 46(3):418–424. [DOI] [PubMed] [Google Scholar]
- 12.Keegan MT, Gajic O, Afessa B. Severity of illness scoring systems in the intensive care unit. Crit Care Med 2011;39(1): 163–169. [DOI] [PubMed] [Google Scholar]
- 13.Beck DH, Smith GB, Pappachan JV. The effects of two methods for customising the original SAPS II model for intensive care patients from South England. Anaesthesia. 2002;57(8):785–793. [DOI] [PubMed] [Google Scholar]
- 14.Rothen HU, Stricker K, Einfalt J, Bauer P, Metnitz PG, Moreno RP, et al. Variability in outcome and resource use in intensive care units. Intensive Care Med 2007;33(8):1329–36. [DOI] [PubMed] [Google Scholar]
- 15.Kramer AA. Predictive mortality models are not like fine wine. Critical Care. 2005. December;9(6):636. [DOI] [PMC free article] [PubMed] [Google Scholar]
- 16.Keegan MT, Gajic O and Afessa B. Comparison of APACHE III, APACHE IV, SAPS 3 and MPM III and influence of resuscitation status on model performance. Chest 2012. October;142 (4):851–858. [DOI] [PMC free article] [PubMed] [Google Scholar]
- 17.Janssen KJ, Moons KG, Kalkman CJ, Grobbee DE, Vergouwe Y. Updating Methods Improved the Performance of a Clinical Prediction Model in New Patients. J Clin Epidemiol 2008;61(1):76–86. [DOI] [PubMed] [Google Scholar]
- 18.Deliberato RO, Ko S, Komorowski M, de La Hoz MAA et al. Severity of illness score may misclassify critically ill obese patients. Crit Care Med 2018; 46:394–400. [DOI] [PubMed] [Google Scholar]
- 19.von Elm E, Altman DG, Egger M, et al. The Strengthening the Reporting of Observational Studies in Epidemiology (STROBE) Statement: guidelines for reporting observational studies. PLoS Med 2007; e296. [DOI] [PMC free article] [PubMed] [Google Scholar]
- 20.Pollard TJ, Johnson AEW, Raffa JD, Celi LA, Mark RG, Badawi O. The eCIU Collaborative Research Database, a freely available multi-center database for critical care research. Sci Data.2018. September 11;5:180178. [DOI] [PMC free article] [PubMed] [Google Scholar]
- 21.Charlson ME, Pompei P, Ales KL, MacKenzie CR. A new method of classifying prognostic comorbidity in longitudinal studies: development and validation. J Chronic Dis 1987;40: 373–83. [DOI] [PubMed] [Google Scholar]
- 22.World Health Organization: Global Database on Body Mass Index. [http://apps.who.int/bmi/index.jsp?introPage=intro_3.html].
- 23.Hanley JA and McNeil BJ. The meaning and use of the area under a receiver operating characteristic (ROC) curve. Radiology. 1982: 143, 29–36. [DOI] [PubMed] [Google Scholar]
- 24.Finazzi S, Poole D, Luciani D, Cogo PE, Bertolini G. Calibration belt for quality-of-care assessment based on dichotomous outcomes. PLoS One. 2011;6(2):e16110. [DOI] [PMC free article] [PubMed] [Google Scholar]
- 25.Kramer AA and Zimmerman JE. Assessing the calibration of mortality benchmarks in critical care: The Hosmer-Lemeshow test revisited.Crit Care Med 2007. September; 35(9):2052–6. [DOI] [PubMed] [Google Scholar]
- 26.Deliberato Rodrigo Octávio. (2018, August 23). Deliberato/SOI_performance_ BMI: Risk adjustment across body mass index classifications (Version v1.0).Zenodo. 10.5281/zenodo.1402691 [DOI]
- 27.Higgins T, Teres D, Nathanson B, Copes W, Stark M, Kramer A. Updated Mortality Probability Model - MPM0-III. Chest. 2005;128(4 Suppl):348S. [Google Scholar]
- 28.The WHO expert consultation. Appropriate body-mass index for Asian populations and its implications for policy and intervention strategies. The Lancet, 2004; 363:157–163. [DOI] [PubMed] [Google Scholar]
- 29.Coutinho T, Goel K, Correˆa de Sa ´ D, Carter RE, Hodge DO, Kragelund C, et al. Combining body mass index with measures of central obesity in the assessment of mortality in subjects with coro nary disease: role of “normal weight central obesity.” J Am Coll Cardiol 2013; 61:553–60. [DOI] [PubMed] [Google Scholar]
- 30.Padwal R, Leslie WD, Lix LM and Majumdar SR. Relationship among body fat percentage, body mass index and all-cause mortality: a cohort study. Ann Intern Med 2016. April 19; 164(8):532–41. [DOI] [PubMed] [Google Scholar]
Associated Data
This section collects any data citations, data availability statements, or supplementary materials included in this article.