
Figure 4. Percentile corrected DNMS performance.
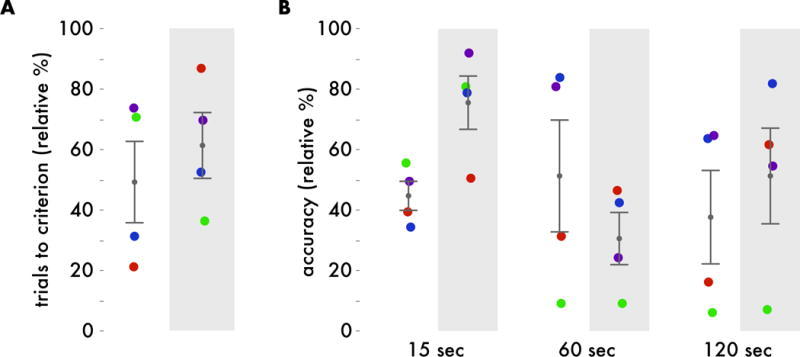
A. Age-matched percentile of number of trials performed before reaching performance criteria before implant (white background) and after implant (gray background). Higher percentiles indicate lower performance. B. Age-matched percentile of recognition performance (percent correct) at 15, 60, and 120 second delay intervals before implant (white background) and after implant (gray background). Higher percentiles indicate better performance.