

Supplemental Digital Content is available in the text
Keywords: bioinformatics analysis, bladder cancer, CALD1, CNN1, prognostic markers, TAGLN
Abstract
Background:
Bladder cancer (BC) is one of the most common malignant neoplasms in the genitourinary tract. We employed the GSE13507 data set from the Gene Expression Omnibus (GEO) database in order to identify key genes related to tumorigenesis, progression, and prognosis in BC patients.
Methods:
The data set used in this study included 10 normal bladder mucosae tissue samples and 165 primary BC tissue samples. Differentially expressed genes (DEGs) in the 2 types of samples were identified by GEO2R. Gene ontology (GO) and Kyoto Encyclopedia of Genes and Genomes (KEGG) pathway enrichment analyses were performed using the online website DAVID. The online website STRING was used to construct a protein–protein interaction network. Moreover, the plugins in MCODE and cytoHubba in Cytoscape were employed to find the hub genes and modules in these DEGs.
Results:
We identified 154 DEGs comprising 135 downregulated genes and 19 upregulated genes. The GO enrichment results were mainly related to the contractile fiber part, extracellular region part, actin cytoskeleton, and extracellular region. The KEGG pathway enrichment results mainly comprised type I diabetes mellitus, asthma, systemic lupus erythematosus, and allograft rejection. A module was identified from the protein–protein interaction network. In total, 15 hub genes were selected and 3 of them comprising CALD1, CNN1, and TAGLN were associated with both overall survival and disease-free survival.
Conclusion:
CALD1, CNN1, and TAGLN may be potential biomarkers for diagnosis as well as therapeutic targets in BC patients.
1. Introduction
Bladder cancer (BC) is one of the most common malignancies in the urinary tract, where it is promoted by testosterone and inhibited by estrogen, and the risk of BC in men is 3 times higher than that in 4 women.[1] It is-well known that the only reliable tool for the diagnosis and post-treatment monitoring of BC patients is based on cystoscopy, which is expensive and unpleasant, and patients must undergo several cystoscopies each year to check for recurrence.[1] However, this method has no effects on healthy people and even high risk people who might potentially become BC patients. BC is an important public health problem, where it comprises the 7th and 17th most common tumor in men and women, respectively.[2] In China, the occurrence of BC increased dramatically from 1991 to 2009, and it caused >20,000 deaths in 2009.[3,4] Despite many aggressive treatment measures, the survival status of advanced or metastatic BC patients is still poor, and until recently, it had not changed greatly for decades.[5]
Newly discovered biomarkers for gene mutations in BC could significantly improve the accuracy of urine tests for identifying BC.[1] In addition, abnormal MUC16 glycoforms could serve as potential biomarkers for targeted therapeutics in BC patients.[6] Calcium activated chloride channel A4 (CLCA4), a tumor suppressor, has been shown to contribute to the progression of several tumors, including BC. It has been reported that a low expression level of CLCA4 is associated with tumor aggressiveness and unfavorable clinical survival, and it may inhibit BC cell proliferation, migration, and invasion by suppressing the PI3K/AKT signaling pathway.[7] Real-time polymerase chain reaction analysis indicates that CLCA4 mRNA is highly expressed in human brain, testis, small intestine, colon, and lung tissues.[8]
High-throughput sequencing analysis is being used increasingly, and it has been applied as a very important tool in various branches of medicine, such as for early cancer diagnosis, cancer grading, and progression prediction.[9] In the current study, we used the GSE13507 data set from the Gene Expression Omnibus (GEO) and an online tool called GEO2R, to determine the differentially expressed genes (DEGs) in BC and normal sample types. We then constructed a protein–protein interaction (PPI) network for the DEGs and identified 15 hub genes. Subsequently, we performed Gene Ontology (GO) enrichment analysis to identify biological process, cellular components, and molecular function components, as well as enrichment analysis of the DEGs based on the Kyoto Encyclopedia of Genes and Genomes (KEGG) pathways, and we constructed a module of the hub genes. Moreover, overall survival (OS) and disease-free survival (DFS) analyses of the hub genes were performed using an online website. The expression levels and Pearson correlation analysis of the genes were employed to visualize the potential relationships among the genes, as well as to provide novel insights regarding potential therapeutic targets in BC patients.
2. Materials and methods
2.1. Patient information
We selected gene expression profiles from the GSE13507 data set in the GEO database, which is a free public database. The GSE13507 (https://www.ncbi.nlm.nih.gov/geo/query/acc.cgi?acc=GSE13507, accessed December 6, 2017) gene expression profiles comprised 256 samples from the GPL6102 platform (Illumina human-6 v2.0 expression beadchip), with 10 normal bladder mucosae tissues, 165 primary BC tissues, 23 recurrent non-muscle invasive tumor tissues, and 58 normal-looking bladder mucosae surrounding cancer tissues.[10,11] In order to construct a reliable model, 165 primary BC samples and 10 normal bladder mucosae samples were selected for the analysis. This study based on public sources data, which contains its ethnic approval. Thus, we do not need any further ethnic approval.
2.2. Data processing
The online tool called GEO2R (https://www.ncbi.nlm.nih.gov/geo/geo2r/, accessed December 11, 2017) was used to determine the DEGs in the primary BC and normal bladder mucosae samples.[12] The adjusted P values were used to reduce the false positive rate with the Benjamini and Hochberg false discovery rate method by default. Adjusted P values <.05 and |logFC| ≥2 were set as cut-off values. In total, 154 DEGs were determined, which comprised 135 downregulated genes and 19 upregulated genes. The top 15 hub genes were then selected as the hub genes using the default MCC method in cytoHubba, which is a Cytoscape plugin.[13,14]
2.3. GO and KEGG pathway enrichment analysis of DEGs
GO enrichment analysis is a widely used method for annotating specific genes, gene products, and assembling biological attributes for high-throughput genome and transcriptome data.[15] KEGG is a database resource used for understanding the high level functions and utilities of a biological system based on molecular level information obtained by genome sequencing and other high-throughput experimental techniques.[16] The Database for Annotation, Visualization, and Integrated Discovery v6.7 (DAVID, https://david-d.ncifcrf.gov/, accessed December 13, 2017) was employed to identify the enriched biological process, cellular component, molecular function, and KEGG pathways for the 154 DEGs.[17,18]
2.4. PPI network and module analysis
The online Search Tool for the Retrieval of Interacting Genes (STRING) website was employed to construct the relationships among proteins. The Molecular Complex Detection (MCODE) plugin in Cytoscape was then utilized to screen modules in the PPI network with the default settings.[19] GO and KEGG pathway enrichment analyses were performed using the genes identified by the MCODE plugin on the DAVID website.
2.5. Survival analysis, expression levels, and correlations of hub genes
The online Gene Expression Profiling Interactive Analysis (GEPIA, http://gepia.cancer-pku.cn/index.html, accessed December 20, 2017) resource was employed to depict the OS and DFS outcomes based on the hub gene expression levels.[20] The genes related to both OS and DFS were identified for further study based on Pearson correlation analysis and the tissue expression levels in both BC and normal tissues.
3. Results
3.1. Identification of DEGs and hub genes
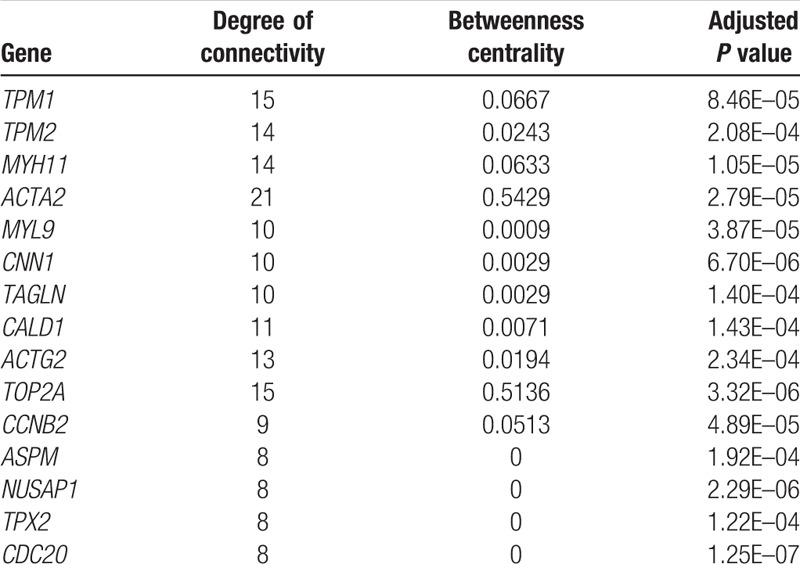
In total, 165 primary BC and 10 normal bladder mucosae samples were considered in this study. The online GEO2R tool was utilized to determine the DEGs based on cut-off values: adjusted P values <.05 and | logFC | ≥2. We identified 154 DEGs comprising 135 downregulated genes and 19 upregulated genes. A PPI network was constructed using the 154 DEGs. Furthermore, 15 hub genes were identified among the 154 DEGs using the default MCC method. The 15 hub genes were TPM1, TPM2, MYH11, ACTA2, MYL9, CNN1, TAGLN, CALD1, ACTG2, TOP2A, CCNB2, ASPM, NUSAP1, TPX2, and CDC20 (Table 1). Details of the 154 DEGs are presented in Supplementary Table 1.
Table 1.
Top 15 hub genes among 154 differentially expressed genes.
3.2. GO and KEGG pathway enrichment analysis for 154 DEGs
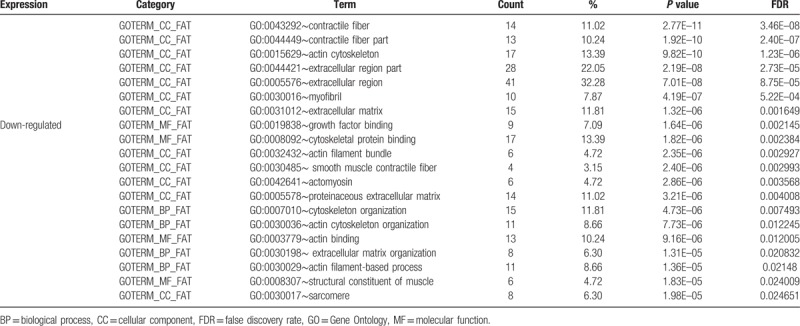
After importing the 135 downregulated genes, DAVID was used to obtain the enrichment results based on GO and KEGG pathway analysis. Among the GO enrichment results, the top 20 GO results were contractile fiber, contractile fiber part, actin cytoskeleton, extracellular region part, extracellular region, myofibril, extracellular matrix, growth factor binding, cytoskeletal protein binding, actin filament bundle, smooth muscle contractile fiber, actomyosin, proteinaceous extracellular matrix, cytoskeleton organization, actin cytoskeleton organization, actin binding, extracellular matrix organization, actin filament-based process, structural constituent of muscle, and sarcomere (Table 2). However, the 19 upregulated genes were not enriched for any GO terms. Details of the 170 GO enrichment results are shown in Supplementary Table 2.
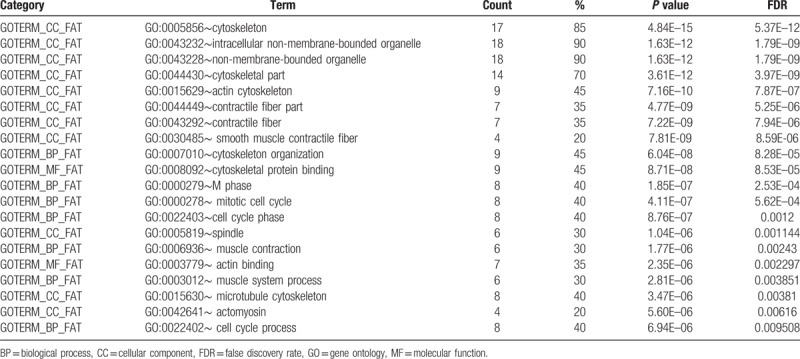
Table 2.
Top 20 enriched genes according to GO analysis of differentially expressed genes.
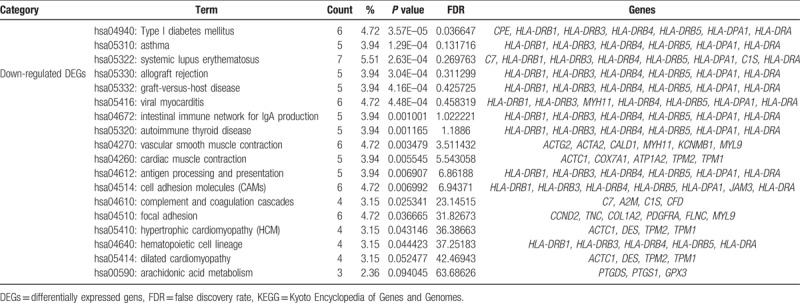
According to the KEGG pathway enrichment analysis of the 135 downregulated genes, the 17 enriched pathways comprised type I diabetes mellitus, asthma, systemic lupus erythematosus, allograft rejection, graft-versus-host disease, viral myocarditis, intestinal immune network for IgA production, autoimmune thyroid disease, vascular smooth muscle contraction, cardiac muscle contraction, antigen processing and presentation, cell adhesion molecules, complement and coagulation cascades, focal adhesion, hypertrophic cardiomyopathy, hematopoietic cell lineage, dilated cardiomyopathy, and arachidonic acid metabolism. The 19 upregulated genes were not enriched for any pathways. Details of the enrichment results are shown in Table 3.
Table 3.
Enriched KEGG pathway analysis of differentially expressed genes.
3.3. PPI network of hub genes and module obtained using MCODE
STRING was employed to obtain an interaction network comprising the 15 hub genes, where each interacted with at least 5 other proteins. The network is presented in Fig. 1. Based on the PPI network, Cytoscape determined a module using the default MCODE settings, where 20 genes were assembled in the module. The assembled genes were analyzed to determine their enriched GO and KEGG pathways (Table 4).
Figure 1.
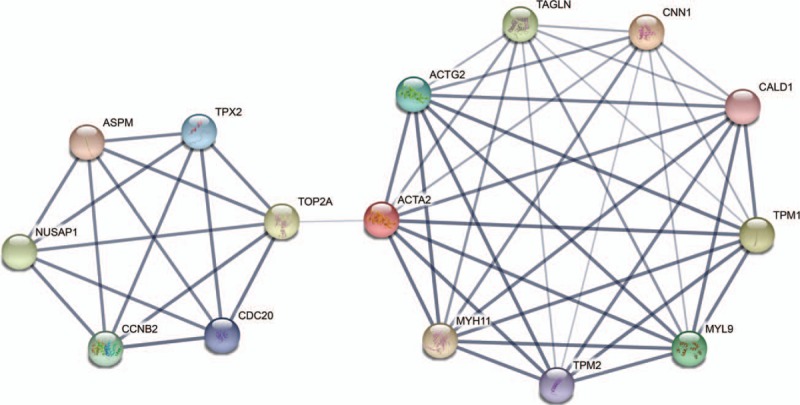
The protein–protein interaction network of the top 15 hub genes.
Table 4.
Top 20 enriched terms detected for the 20 genes by GO analysis and MCODE.
The enriched KEGG pathways comprised vascular smooth muscle contraction, cardiac muscle contraction, hypertrophic cardiomyopathy, dilated cardiomyopathy, and cell cycle. The detailed module and KEGG pathways are shown in Fig. 2.
Figure 2.
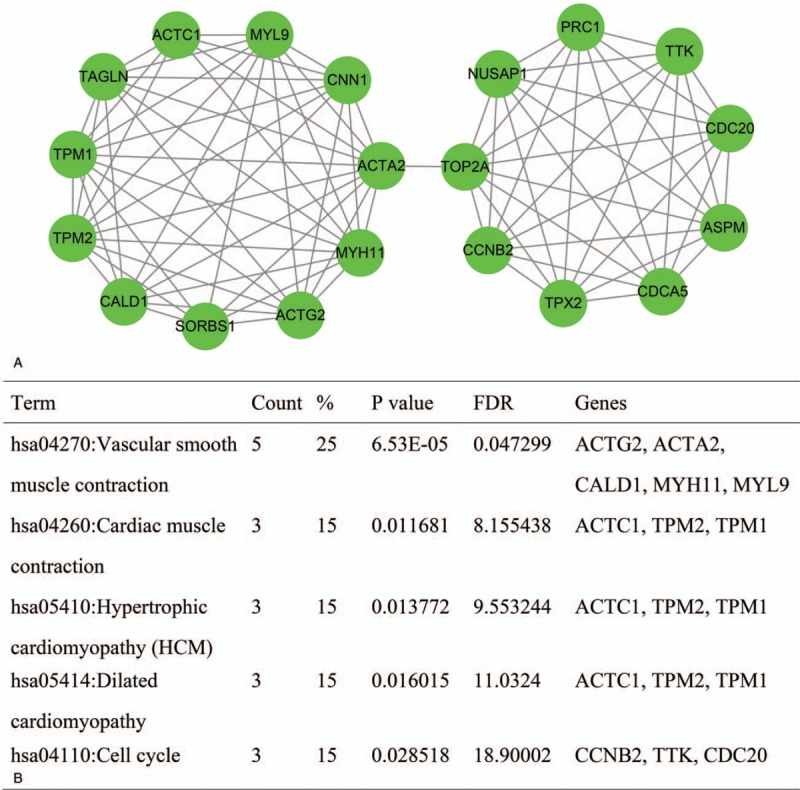
Module obtained from the protein–protein interaction network and enriched pathways for genes in the module. (A) The module was generated using MCODE. (B) Enriched pathways in the module. MCODE = molecular complex detection.
According to the GO enrichment results for the 20 genes, the top 20 enriched GO terms comprised cytoskeleton, intracellular non-membrane-bounded organelles, non-membrane-bounded organelles, cytoskeletal part, actin cytoskeleton, contractile fiber part, contractile fiber, smooth muscle contractile fiber, cytoskeleton organization, cytoskeletal protein binding, M phase, mitotic cell cycle, cell cycle phase, spindle, muscle contraction, actin binding, muscle system process, microtubule cytoskeleton, actomyosin, and cell cycle process (Fig. 3). Details of the 106 GO enrichment results are shown in Supplementary Table 3.
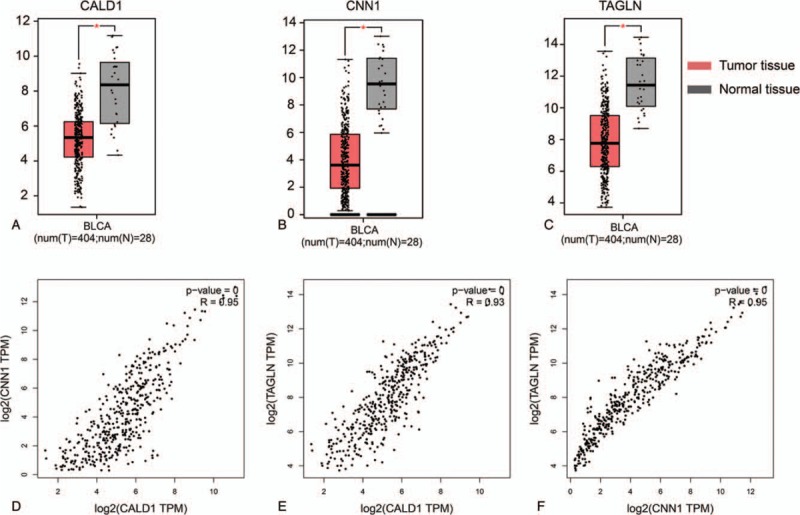
Figure 3.
Expression levels and Pearson correlation analysis of CALD1, CNN1, and TAGLN genes.
3.4. Survival curves, expression levels, and correlation analysis of hub genes
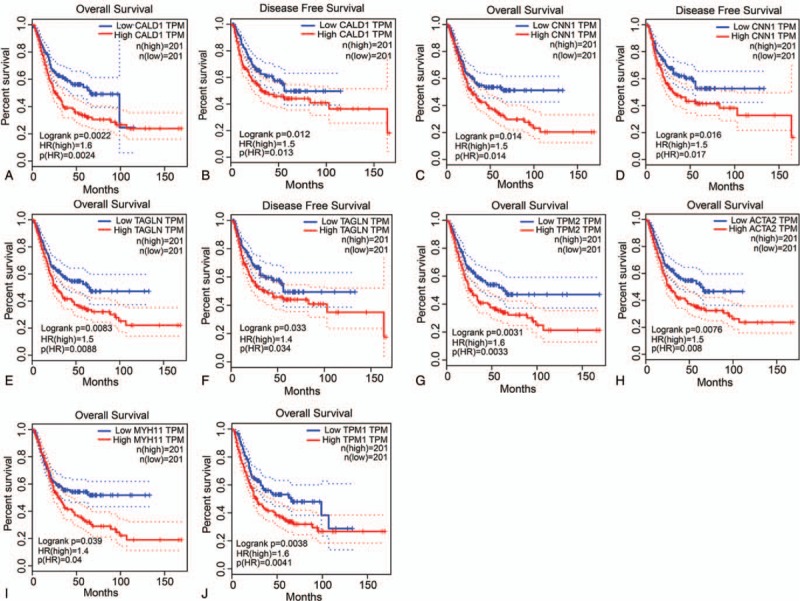
Among the 15 hub genes, CALD1, CNN1, TAGLN, TMP2, ACTA2, MYH11, and TMP1 had statistically significant P values, where CALD1, CNN1, and TAGLN were related to both OS and DFS (all P ≤.05). TMP2, ACTA2, MYH11, and TMP1 only had relationships with OS (all P ≤0.05). The detailed results are shown in Fig. 4.
Figure 4.
Prognostic analysis of overall survival and disease-free survival for CALD1 (A and B), CNN1 (C and D), TAGLN (E and F), TPM2 (G), ACTA2 (H), MYH11 (I), and TPM1 (J) genes.
Among the 15 hub genes, only the genes that had relationships with OS and DFS were selected for further analysis, that is, CALD1, CNN1, and TAGLN. The expression levels of these 3 genes are shown in Fig. 3, where all of them were low in tumor tissues but high in normal tissues, and they differed significantly between the normal and BC tissues. In addition, their low expression levels were associated with a better prognosis. The Pearson correlation coefficients between the gene expression levels are shown in Fig. 3 (all R >0.9).
4. Discussion
BC originates from the epithelial lining of the urinary bladder and it is one of the most common genitourinary tumors. In China, the incidence and mortality of BC has increased rapidly in recent decades.[21] Currently, pathological analyses including the clinical stage and tumor grade are the main determinants used for risk evaluation and therapeutic decision making for BC patients.[22] However, none of the conventional histopathological parameters has satisfactory sensitivity and specificity for detecting, monitoring, and determining the prognosis in BC patients.[22,23] Due to these limitations, many studies have tried to identify potential molecular markers for early detection, early diagnosis, and the development of effective treatments.
In the present study, we employed gene expression profiles from the GSE13507 data set in the GEO database to identify potential molecular markers in BC patients. The data set comprised 256 samples, with 10 normal bladder mucosae tissue samples, 165 primary BC tissue samples, 23 recurrent non-muscle invasive tumor tissue samples, and 58 normal-looking bladder mucosae surrounding cancer tissue samples. In order to identify potential molecular makers compared with healthy people, we selected 10 normal bladder mucosae and 165 primary BC tissue samples. In total, 154 DEGs were detected using the GEO2R online tool, where 135 genes were downregulated and 19 genes were upregulated. Moreover, the MCODE plugin and cytoHubba plugin were employed to produce a module and detect 15 hub genes in these DEGs. To obtain a more in-depth understanding of these DEGs, we performed GO and KEGG pathway enrichment analyses.
The GO enrichment results showed that the downregulated genes were mainly involved with contractile fiber, actin cytoskeleton, extracellular region part, growth factor binding, actin filament bundle, and cytoskeleton organization. Moreover, the KEGG pathway enrichment results indicated that the downregulated genes were mainly involved with type I diabetes mellitus, asthma, systemic lupus erythematosus, allograft rejection, graft-versus-host disease, and viral myocarditis. However, the 19 upregulated genes were not enriched for any GO terms or KEGG pathways. In total, 20 genes were assembled in the module based on the PPI network and the enriched KEGG pathways for these 20 genes included vascular smooth muscle contraction, cardiac muscle contraction, hypertrophic cardiomyopathy, dilated cardiomyopathy, and the cell cycle. Among the DEGs, 15 hub genes were selected in the PPI network, where 7 genes comprising CALD1, CNN1, TAGLN, TMP2, ACTA2, MYH11, and TMP1 had significant correlations with the patient prognosis. CALD1, CNN1, and TAGLN had relationships with both OS and DFS, so they were subjected to further analysis, where they all had low expression levels in tumor tissues but high expression levels in normal tissues. In addition, their low expression levels were associated with a better prognosis. Based on these results, we hypothesize that CALD1, CNN1, and TAGLN may function as oncogenes.
CALD1 is a novel target of TEA domain family member 4, and it is involved with cell proliferation and migration.[24] In the transactivated CALD1 gene and human CALD1 promoter, their 2 glucocorticoid-response element-like sequences may be bound directly by an activated form of glucocorticoid receptor, thereby upregulating the caldesmon protein and regulating cell migration via the reorganization of the actin cytoskeleton.[25]CALD1 was identified as a tumor-specific splicing variant in all of the validated colon, urinary bladder, and prostate organ samples among 102 normal and cancer tissue samples.[26] It has been suggested that CALD1 may indicate general cancer-related splicing events.[26] Splicing variants of CALD1 are differentially expressed in glioma neovascularization versus normal brain microvasculature.[27] The missplicing of CALD1 is an independent epigenetic event that is regulated at the transcriptional level, which is correlated with the breakdown of tight junctions among epithelial cells in the glioma microvasculature.[27]
CNN1 plays a tumor-suppressive role in ovarian cancer[28] and it is a structural molecular signature of cancer initiation and progression.[29]CNN1 functions as a tumor suppressor gene and it is an indicator of cell migration in primary cultured invasive hepatocellular carcinoma cells.[30]TAGLN is a downstream target of miR-144 and its expression level is upregulated in osteosarcoma cell, where it is inversely correlated with miR-144 expression.[31] The expression of TAGLN in NF-1 associated malignant peripheral nerve sheath tumors is upregulated by hypomethylation in its promoter and subpromoter regions.[32]TAGLN is significantly overexpressed in lung adenocarcinoma and it may be a reliable therapeutic target and a potential biomarker for predicting the prognosis of lung adenocarcinoma patients.[33] TAGLN is coexpressed with TAZ-AXL-CTGF, where it is upregulated and associated with the progression of colon cancer.[34]
There are some limitations need recognized. Other population, including some clinical samples to validate the expression (mRNA and protein), are warranted to further validate our findings. In addition, functional trials are needed to explore properties of metastasis and proliferation.
Thus, in this study, we determined the DEGs between normal bladder mucosae and primary BC samples in the GSE13507 data set. The hub genes among the DEGs were associated with the prognoses of BC patients, and 3 were correlated with both OS and DFS. These genes have associations with many diseases, including colon cancer, hepatocellular carcinoma, osteosarcoma, lung adenocarcinoma, and glioma. However, our study have several limitations. Large samples are required to increase the reliability of the findings. Functional experiments are needed to validate our results. According to our bioinformatics analysis and previous studies, we suggest that the CALD1, CNN1, and TAGLN genes may be potential molecular makers in BC patients.
5. Conclusions
We identified 3 potential molecular markers for BC diagnosis and they may even be therapeutic targets in BC patients, but more detailed functional validation and investigations of the mechanisms related to these genes are necessary. Our results may provide some powerful insights to facilitate the future individualized treatment of BC patients.
Acknowledgments
The authors are grateful to the organizations and researchers who provided the data used in this study. It is their pleasure to acknowledge their contributions.
Author contributions
Conceptualization: Shenglong Zhao, Yun Liu.
Data curation: Yun Liu.
Formal analysis: Yun Liu, Guokun Wang.
Funding acquisition: Shenglong Zhao.
Investigation: Xia Wu, Guokun Wang, Shisong Hu.
Methodology: Yun Liu, Xia Wu, Guokun Wang, Shisong Hu.
Project administration: Shenglong Zhao.
Software: Yuandong Zhang.
Validation: Xia Wu.
Writing – original draft: Yun Liu.
Writing – review & editing: Shenglong Zhao, Yuandong Zhang.
Shenglong Zhao orcid: 0000-0002-7512-373X.
Supplementary Material
Footnotes
Abbreviations: BC = bladder cancer, CLCA4 = calcium activated chloride channel A4, DEGs = differentially expressed genes, DFS = disease-free survival, GO = gene ontology, KEGG = Kyoto Encyclopedia of Genes and Genomes, MCODE = molecular complex detection, OS = overall survival, STRING = Search Tool for the Retrieval of Interacting Genes.
The authors have no conflicts of interest to disclose.
Supplemental Digital Content is available for this article.
Supplemental digital content is available for this article. Direct URL citations appear in the printed text and are provided in the HTML and PDF versions of this article on the journal's Website (www.md-journal.com).
References
- [1].Berdik C. Bladder cancer: 4 big questions. Nature 2017;551:S51. [DOI] [PubMed] [Google Scholar]
- [2].Kakehi Y, Hirao Y, Kim WJ, et al. Bladder cancer working group report. Jpn J Clin Oncol 2010;40suppl:i57–64. [DOI] [PubMed] [Google Scholar]
- [3].Yee DS, Lowrance WT, Herr HW, et al. Ethnic differences in bladder cancer survival. J Urol 2011;181:544–9. [DOI] [PMC free article] [PubMed] [Google Scholar]
- [4].Parkin DM. International variation. Oncogene 2004;23:6329–40. [DOI] [PubMed] [Google Scholar]
- [5].Boegemann M, Aydin AM, Bagrodia A, et al. Prospects and progress of immunotherapy for bladder cancer. Expert Opin Biol Ther 2017;17:1417–31. [DOI] [PubMed] [Google Scholar]
- [6].Cotton S, Azevedo R, Gaiteiro C, et al. Targeted O-glycoproteomics explored increased sialylation and identified MUC16 as a poor prognosis biomarker in advanced-stage bladder tumours. Mol Oncol 2017;11:895–912. [DOI] [PMC free article] [PubMed] [Google Scholar]
- [7].Hou T, Zhou L, Wang L, et al. CLCA4 inhibits bladder cancer cell proliferation, migration, and invasion by suppressing the PI3K/AKT pathway. Oncotarget 2017;8:93001–13. [DOI] [PMC free article] [PubMed] [Google Scholar]
- [8].Piirsoo M, Meijer D, Timmusk T. Expression analysis of the CLCA gene family in mouse and human with emphasis on the nervous system. BMC Dev Biol 2009;9:10. [DOI] [PMC free article] [PubMed] [Google Scholar]
- [9].Kulasingam V, Diamandis EP. Strategies for discovering novel cancer biomarkers through utilization of emerging technologies. Nat Clin Pract Oncol 2008;5:588–99. [DOI] [PubMed] [Google Scholar]
- [10].Lee JS, Leem SH, Lee SY, et al. Expression signature of E2F1 and its associated genes predict superficial to invasive progression of bladder tumors. J Clin Oncol 2010;28:2660–7. [DOI] [PubMed] [Google Scholar]
- [11].Kim WJ, Kim EJ, Kim SK, et al. Predictive value of progression-related gene classifier in primary non-muscle invasive bladder cancer. Mol Cancer 2010;9:3. [DOI] [PMC free article] [PubMed] [Google Scholar]
- [12].Davis S, Meltzer PS. GEOquery: a bridge between the Gene Expression Omnibus (GEO) and BioConductor. Bioinformatics 2007;23:1846–7. [DOI] [PubMed] [Google Scholar]
- [13].Chin CH, Chen SH, Wu HH, et al. cytoHubba: identifying hub objects and sub-networks from complex interactome. BMC Syst Biol 2014;8suppl:S11. [DOI] [PMC free article] [PubMed] [Google Scholar]
- [14].Shannon P, Markiel A, Ozier O, et al. Cytoscape: a software environment for integrated models of biomolecular interaction networks. Genome Res 2003;13:2498–504. [DOI] [PMC free article] [PubMed] [Google Scholar]
- [15].Ashburner M, Ball CA, Blake JA, et al. Gene ontology: tool for the unification of biology. The Gene Ontology Consortium. Nat Genet 2000;25:25–9. [DOI] [PMC free article] [PubMed] [Google Scholar]
- [16].SG MK. KEGG: Kyoto Encyclopedia of Genes and Genomes. Nucleic Acids Res 2000;27:29–34. [DOI] [PMC free article] [PubMed] [Google Scholar]
- [17].Huang da W, Sherman BT, Lempicki RA. Systematic and integrative analysis of large gene lists using DAVID bioinformatics resources. Nat Protoc 2009;4:44–57. [DOI] [PubMed] [Google Scholar]
- [18].Huang da W, Sherman BT, Lempicki RA. Bioinformatics enrichment tools: paths toward the comprehensive functional analysis of large gene lists. Nucleic Acids Res 2009;37:1–3. [DOI] [PMC free article] [PubMed] [Google Scholar]
- [19].Bader GD, Hogue CW. An automated method for finding molecular complexes in large protein interaction networks. BMC Bioinformatics 2003;4:2. [DOI] [PMC free article] [PubMed] [Google Scholar]
- [20].Tang Z, Li C, Kang B, et al. GEPIA: a web server for cancer and normal gene expression profiling and interactive analyses. Nucleic Acids Res 2017;45:W98–102. [DOI] [PMC free article] [PubMed] [Google Scholar]
- [21].Pang C, Guan Y, Li H, et al. Urologic cancer in China. Jpn J Clin Oncol 2016;46:497. [DOI] [PubMed] [Google Scholar]
- [22].Brausi M, Witjes JA, Lamm D, et al. A review of current guidelines and best practice recommendations for the management of nonmuscle invasive bladder cancer by the International Bladder Cancer Group. J Urol 2011;186:2158–67. [DOI] [PubMed] [Google Scholar]
- [23].Lotan Y, Shariat SF, Schmitzdräger BJ, et al. Considerations on implementing diagnostic markers into clinical decision making in bladder cancer. Urol Oncol 2010;28:441–8. [DOI] [PubMed] [Google Scholar]
- [24].Lim B, Park JL, Kim HJ, et al. Integrative genomics analysis reveals the multilevel dysregulation and oncogenic characteristics of TEAD4 in gastric cancer. Carcinogenesis 2014;35:1020–7. [DOI] [PubMed] [Google Scholar]
- [25].Mayanagi T, Morita T, Hayashi K, et al. Glucocorticoid receptor-mediated expression of caldesmon regulates cell migration via the reorganization of the actin cytoskeleton. J Biol Chem 2008;283:31183–96. [DOI] [PMC free article] [PubMed] [Google Scholar]
- [26].Thorsen K, Sørensen KD, Brems-Eskildsen AS, et al. Alternative splicing in colon, bladder, and prostate cancer identified by exon array analysis. Mol Cell Proteomics 2008;7:1214–24. [DOI] [PubMed] [Google Scholar]
- [27].Zheng PP, Sieuwerts AM, Luider TM, et al. Differential expression of splicing variants of the human caldesmon gene (CALD1) in glioma neovascularization versus normal brain microvasculature. Am J Pathol 2004;164:2217–28. [DOI] [PMC free article] [PubMed] [Google Scholar]
- [28].Yamane T, Asanoma K, Kobayashi H, et al. Identification of the critical site of Calponin 1 for suppression of ovarian cancer properties. Anticancer Res 2015;35:5993–9. [PubMed] [Google Scholar]
- [29].Drew JE, Farquharson AJ, Mayer CD, et al. Predictive gene signatures: molecular markers distinguishing colon adenomatous polyp and carcinoma. PLoS ONE 2014;9:e113071. [DOI] [PMC free article] [PubMed] [Google Scholar]
- [30].Lin ZY, Chuang WL. Genes responsible for the characteristics of primary cultured invasive phenotype hepatocellular carcinoma cells. Biomed Pharmacother 2012;66:454–8. [DOI] [PubMed] [Google Scholar]
- [31].Zhao M, Huang J, Gui K, et al. The downregulation of miR-144 is associated with the growth and invasion of osteosarcoma cells through the regulation of TAGLN expression. Int J Mol Med 2014;34:1565–72. [DOI] [PubMed] [Google Scholar]
- [32].Park GH, Lee SJ, Yim H, et al. TAGLN expression is upregulated in NF1-associated malignant peripheral nerve sheath tumors by hypomethylation in its promoter and subpromoter regions. Oncol Rep 2014;32:1347–54. [DOI] [PMC free article] [PubMed] [Google Scholar]
- [33].Wu X, Dong L, Zhang R, et al. Transgelin overexpression in lung adenocarcinoma is associated with tumor progression. Int J Mol Med 2014;34:585–91. [DOI] [PubMed] [Google Scholar]
- [34].Yuen HF, McCrudden CM, Huang YH, et al. TAZ expression as a prognostic indicator in colorectal cancer. PLoS ONE 2013;8:e54211. [DOI] [PMC free article] [PubMed] [Google Scholar]
Associated Data
This section collects any data citations, data availability statements, or supplementary materials included in this article.