Abstract
Kidney proximal tubules (PTs) are densely packed with mitochondria, and defects in mitochondrial function are implicated in many kidney diseases. However, little is known about intrinsic mitochondrial function within PT cells. Here, using intravital multiphoton microscopy and live slices of mouse kidney cortex, we show that autofluorescence signals provide important functional readouts of redox state and substrate metabolism and that there are striking axial differences in signals along the PT. Mitochondrial NAD(P)H intensity was similar in both PT segment (S)1 and S2 and was sensitive to changes in respiratory chain (RC) redox state, whereas cytosolic NAD(P)H intensity was significantly higher in S2. Mitochondrial NAD(P)H increased in response to lactate and butyrate but decreased in response to glutamine and glutamate. Cytosolic NAD(P)H was sensitive to lactate and pyruvate and decreased dramatically in S2 in response to inhibition of glucose metabolism. Mitochondrial flavoprotein (FP) intensity was markedly higher in S2 than in S1 but was insensitive to changes in RC redox state. Mitochondrial FP signal increased in response to palmitate but decreased in response to glutamine and glutamate. Fluorescence lifetime decays were similar in both S1 and S2, suggesting that intensity differences are explained by differences in abundance of the same molecular species. Expression levels of known fluorescent mitochondrial FPs were higher in S2 than S1. In summary, substantial metabolic information can be obtained in kidney tissue using a label-free live imaging approach, and our findings suggest that metabolism is tailored to the specialized functions of S1 and S2 PT segments.
Keywords: autofluorescence, kidney, mitochondria, multiphoton imaging, proximal tubule
INTRODUCTION
The kidney proximal tubule (PT) is the first part of the nephron after the glomerulus and is responsible for reabsorbing the bulk of filtered fluid. PT cells are densely packed with mitochondria and are almost entirely dependent on aerobic respiration to generate ATP (1). Numerous insults can damage mitochondria in the PT leading to kidney disease (4). The convoluted PT is divided into two distinct segments (S1 and S2) based on subtle differences in cellular ultrastructure (8). PTs show axial differences in transport function with more fluid reabsorption occurring in early segments, whereas organic ion secretion is more pronounced in later segments (18, 20). Expression levels of metabolic enzymes also vary along the PT (19), raising the possibility that metabolism may be adapted to the specific transport needs of each segment. However, very little is known about intrinsic mitochondrial function in the PT because of a paucity of methodologies to study this.
Mitochondria are known to emit autofluorescence signals originating from nicotinamide adenine dinucleotide (NAD) and flavoproteins (FPs) (7). NAD emits fluorescence in the blue range (420–480 nm) when in the reduced state (NADH) (21) and is an important cofactor in the citric acid cycle and beta oxidation of fatty acids (FAs), as well as the substrate for complex I in the respiratory chain (RC) (Fig. 1A). NADPH has an important role in the synthesis of macromolecules and in maintaining antioxidant defenses and has identical excitation/emission wavelengths to NADH (5), thus the two signals are often grouped together [NAD(P)H]. Flavins, such as flavin adenine dinucleotide (FAD) and flavin mononucleotide, are important redox cofactors that emit in the green range (520–560 nm) when in an oxidized state (7), and their fluorescence properties depend on the FP within which they are contained (10). Previous studies of mitochondria isolated from the kidney have suggested that the main sources of flavin fluorescence are the FAD-containing electron transfer FP (ETF), which feeds electrons from beta oxidation into the RC, and lipoamide dehydrogenase (LipDH), a component of the enzymes pyruvate-dehydrogenase (PDH) and α-ketoglutarate-dehydrogenase (also known as oxoglutarate dehydrogenase), which are involved in pyruvate and glutamine metabolism, respectively (Fig. 1B) (17). However, excitation of endogenous mitochondrial fluorophores in intact tissue with single-photon (1P) excitation is technically difficult, because of challenges such as lack of laser penetration and photo-toxicity. Multiphoton microscopy is much better suited to imaging intact tissues and organs, but the nature of mitochondrial autofluorescence signals in the kidney when imaged with two-photon (2P) excitation have not been characterized in detail to date.
Fig. 1.
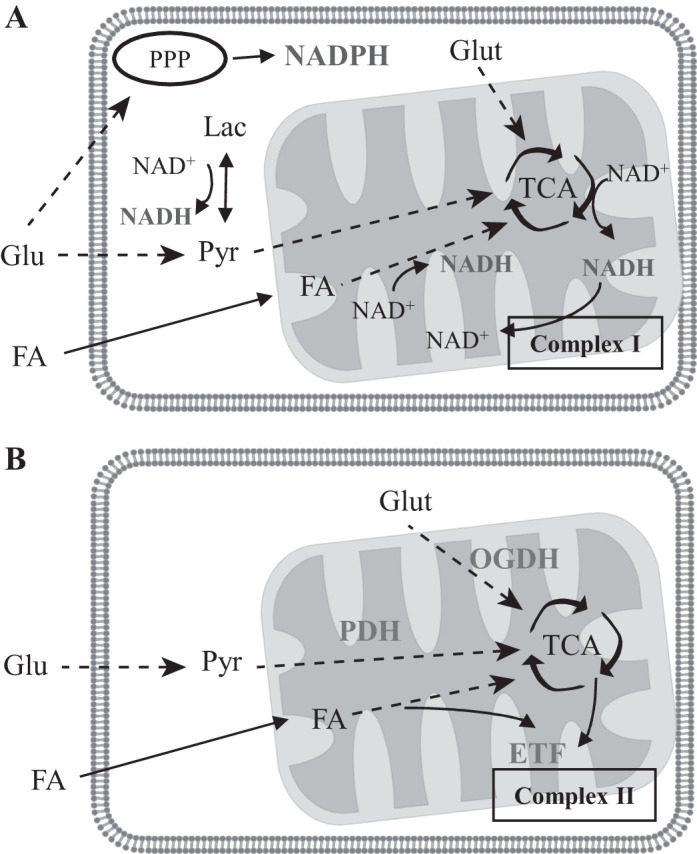
Sources of NAD(P)H and flavoprotein (FP) autofluorescence in mitochondria. A: NADH is generated from NAD+ in the cytosol from the conversion of lactate (Lac) to pyruvate (Pyr) and in mitochondria by beta oxidation of fatty acids (FAs) and the citric acid (TCA) cycle. NADH is oxidized back to NAD+ by complex I in the respiratory chain (RC). NADPH is generated in the cytosol by the pentose phosphate pathway (PPP). B: FPs are present in many different enzymes and in most cases are not fluorescent. Previous studies in isolated kidney mitochondria have suggested that the main sources of FP fluorescence are the electron transfer flavoprotein (ETF), which transfers electrons released from beta oxidation to the RC, and lipoamide dehydrogenase (LipDH), which is incorporated into the enzyme complexes α-ketoglutarate-dehydrogenase (OGDH) and pyruvate-dehydrogenase (PDH). OGDH is involved in the metabolism of glutamine (Glut) and converts α-ketoglutarate to succinate in the TCA. OGDH, oxoglutarate dehydrogenase.
We have shown previously that freshly prepared slices of kidney cortex provide a model whereby the structural integrity of the organ is relatively well preserved, but drugs and metabolites can be directly applied to the tissue under tightly controlled conditions, and changes in fluorescence signal are recorded in real time in ways that are not possible in the living animal (13). We have now used this approach to characterize metabolic autofluorescence signals in the mouse PT and have found evidence of substantial differences in baseline NAD(P)H and FP signals between S1 and S2 PT segments. Moreover, we have discovered that, unlike NAD(P)H, FP signals are relatively insensitive to changes in RC redox state but instead respond to changes in glutamine and FA metabolism. These findings therefore provide new insights into axial differences in metabolism along the PT and into how endogenous fluorescence signals might be used in future studies to derive important metabolic information from intact functioning tissue.
MATERIALS AND METHODS
Unless stated otherwise, all reagents were purchased from Sigma-Aldrich (St. Louis, MO).
Animals.
Experiments were performed on 6- to 14-wk-old male C57BL mice (supplied by Janvier), in accordance with the regulations of the Zurich cantonal veterinary office.
Live imaging.
Kidney cortex tissue slices were generated from freshly externalized organs in mice anesthetized with intraperitoneal injection of ketamine (170 mg/kg) and xylazine (10 mg/kg). After the removal of the capsule, one pole of the kidney was mounted and cut with a vibratome (Microm HM 650 V, Thermo Scientific, Waltham, MA) into 250-µm thick sections. The tissue was kept until usage at 4°C in a physiological buffer adjusted to pH 7.4 and gassed with carbogen (95% O2-5% CO2) containing (in mM): 118 NaCl, 4.7 KCl, 1.2 KH2PO4, 1.8 CaCl2, 1.44 MgSO4, 5 glucose, 10 NaHCO3, 10 HEPES, 5 sodium pyruvate, 2.5 sodium butyrate, and 2.5 sodium lactate. For acute substrate experiments, slices were incubated for 30 min in starvation buffer containing glucose as the only substrate, after which single substrates were added. Substrates were administered in the starvation buffer in the following concentrations (in mM): pyruvate 10, lactate 10, butyrate 10, palmitate 0.01, glutamate 20, and glutamine 20.
For live imaging, slices were mounted into a heated chamber (Warner Instruments, Hamden, CT) filled with gassed slice buffer. Recordings were performed with an Olympus Fluoview 1000 MPE equipped with an XPlan N ×25/1.05 objective and an ultrafast Ti:Sapphire laser system with pulse width 140 fs and 80-MHz repetition rate. NAD(P)H was excited at 720 nm and visualized at 420–500 nm, whereas FPs were excited at 900 nm and visualized at 515–560 nm. To assess the mitochondrial signal, slices were incubated for 30 min with the mitochondria-sequestered, voltage-dependent dye Rhodamine 123 (Thermo Scientific, 50 nM), which was excited at 800 nm and visualized at 515–560 nm. Lambda scans were performed with a Leica TCS SP8 Upright MP fluorescence lifetime microscopy (FLIM) microscope equipped with an HC IRAPO L ×25/1.0 W motCORR, Working Distance 2.6 mm, and an Insight DS+ Dual (680–1,300 nm and 1,040 nm) ultrafast near infrared laser for multiphoton excitation.
Intravital imaging.
Animals were anesthetized with an intraperitoneal injection of ketamine (100 mg/kg) and xylazine (10 mg/kg), and the left kidney was externalized as described previously (28). Animals were placed on a custom built temperature-controlled stage, and body temperature was monitored throughout the experiments. Imaging was performed using a custom built multiphoton microscope operating in an inverted mode (22) and powered by a broadband tunable laser (InSight DeepSee Dual Ultrafast Ti:Sapphire, Spectraphysics, Santa Clara, CA). Intravital imaging was performed with an XLPlan N ×25/1.05 water immersion objective (Olympus, Tokyo, Japan), and emitted light was collected through four highly sensitive gallium-arsenide-phosphide photomultiplier tubes (Hamamatsu, Japan) in a non-descanned epifluorescence detection mode. NAD(P)H was excited at 750 nm and visualized at 330–480 nm, whereas FPs were excited at 900 nm and visualized at 500–550 nm.
Fluorescence lifetime imaging.
FLIM was performed on a Leica TCS SP8 Upright MP FLIM Microscope equipped with an HC IRAPO L ×25/1.0 water immersion objective and with an Insight DS+ Dual (680–1,300 nm and 1,041 nm) ultrafast near infrared pulsed laser. Time-correlated single-photon counting (TCSPC) was used to measure fluorescence lifetime decays and to generate FLIM images. A 6-channel Picoquant HydraHarp 400 was used for acquisition of the TCSPC data. Acquisition and analysis of the TCSPC data were performed using Picoquant Symphotime 64 FLIM software. The photon counting rate was adjusted to 1.25% of the 80-MHz excitation rate to avoid pile-up effects. For the fluorescence lifetime images, the image resolution was set to 512 × 512 pixels to optimize the measurement time, limit photo toxicity, and minimize movement artifacts between measurements. The TCSPC histograms were fitted to a biexponential decay function to extract fluorescence lifetimes and amplitudes from two individual decay components. The fittings were analyzed by reconvolution of the biexponential decay with an estimated instrument response function.
Immunofluorescence staining.
Frozen kidney tissue from animals perfused with 3% paraformaldehyde in 0.1 M phosphate buffer was cut into 5-µm thick sections. After permeabilization with 0.1% TritonX-100 (Surfact-Amps detergent solution, Thermo Fisher Scientific) for 5 min, tissue sections were blocked with 1% BSA and 10% donkey serum before incubation with primary antibody (1:100 ETF-A, rabbit polyclonal, Sigma, HPA018990; 1:250 LipDH, rabbit polyclonal, Abcam, EPR6635) overnight at 4°C. The secondary antibody (1:500, Alexa 488, donkey anti-rabbit, Jackson Immuno Research, West Grove, PA) was incubated for 2 h at room temperature. Tissue was subsequently washed with PBS, and cellular DNA was stained with 5 μg/ml Hoechst 33342 (cat. no. H-1399, Molecular Probes, Eugene, Oregon) for 10 min at room temperature. Slices were mounted with Dako mounting medium (Agilent, Santa Clara, CA). Confocal imaging of the samples was performed on a Leica SP5 microscope using an HC PL APO Leica ×40/1.25 oil immersion objective.
Image analysis.
Regions of interest were drawn manually within tubular cells to obtain mitochondrial or cytosolic signals. Because lysosomal autofluorescence was substantially brighter than the mitochondrial signal at 850–900 nm, this signal was intentionally saturated and removed from subsequent image analysis by applying an arbitrary upper threshold. The nuclear signal was removed by applying a lower threshold. All image processing was done in FIJI (27). Data are presented as mean values per tubule (± SE), from a minimum of three animals. All data were analyzed using Graphpad Prism software. Two-tailed Student’s t-test paired observations were used for comparisons within groups.
RESULTS
Characterization of mitochondrial autofluorescence signals in kidney PTs.
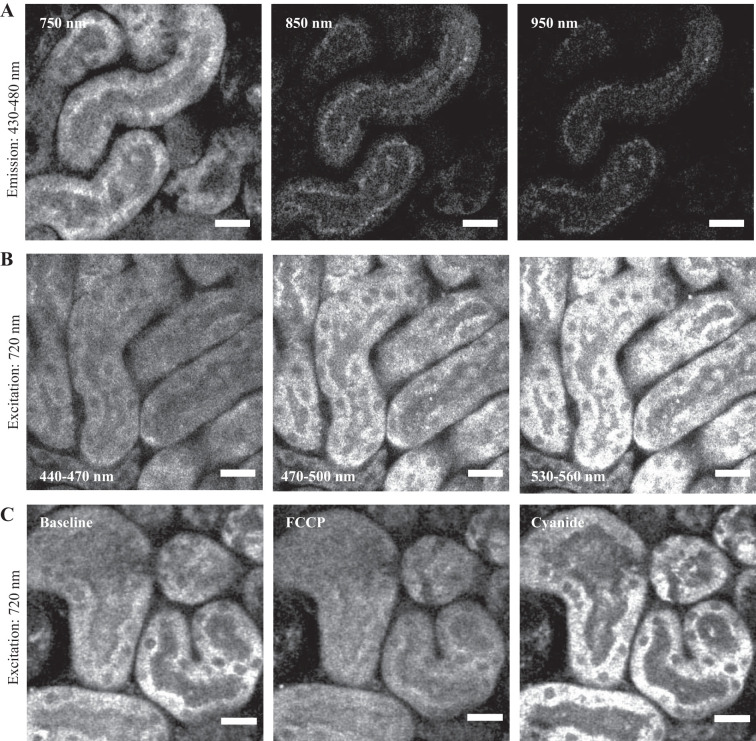
First, we performed excitation and emission lambda scans for mitochondrial autofluorescence signals in PTs. As expected from previous reports (21), we observed a blue fluorescence signal (430–480 nm) with a maximum 2P excitation at 700–750 nm, consistent with NAD(P)H (Fig. 2A). At excitation wavelengths of 700–750 nm, we also observed emission signals in the green range (530–560 nm) (Fig. 2B), consistent with previous reports that both NAD(P)H and FPs are excited at this wavelength (15). To test the redox sensitivity of the signal we applied the RC inhibitors rotenone (10 µM) and cyanide (5 mM) and the RC uncoupler carbonyl cyanide-4-(trifluoromethoxy)phenylhydrazone (FCCP) (1 µM). Mitochondrial NAD(P)H signal decreased in response to FCCP and increased in response to rotenone (not shown) or cyanide (Fig. 2C), confirming its redox sensitivity.
Fig. 2.
Characterization of the NAD(P)H signal in kidney tissue. A: maximum excitation of mitochondrial NAD(P)H signal (emission 430–480 nm) in proximal tubules in kidney cortex slices occurred at 700–750 nm, with very little signal observed at longer excitation wavelengths (850–950 nm). B: excitation at 720 nm produced a broad emission in both the blue and green ranges, consistent with the notion that flavoproteins are also excited at this wavelength. C: NAD(P)H signal decreased in response to the respiratory chain (RC) uncoupler FCCP (1 µM) and increased in response to the RC inhibitor cyanide (5 mM), confirming its redox sensitivity. Scale bars = 20 µm. FCCP, carbonyl cyanide-4-(trifluoromethoxy)phenylhydrazone.
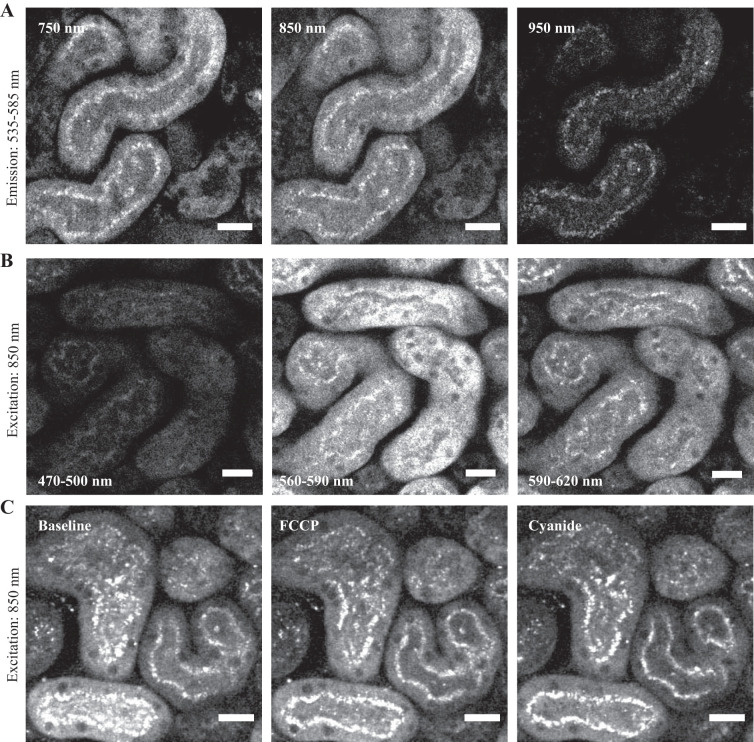
The maximum excitation for green autofluorescence in mitochondria was at 850–900 nm and was substantially lower at 950 nm (Fig. 3A), consistent with previous reports of 2P FP excitation spectra (15). However, the maximum emission occurred at 560–590 nm (Fig. 3B), which is slightly red-shifted compared with published values for 2P excitation of FAD in solution and the ETF in cardiac myocytes and closer to those for LipDH (15). The maximum emission wavelength was also longer than the values reported previously for 1P excitation of FAD, ETF, and LipDH in kidney mitochondria (17). No signal was detected in the blue range (470–500 nm), suggesting that NAD(P)H is not excited at 850–900 nm. In contrast to the NAD(P)H signal, we did not detect significant changes in FP fluorescence intensity with rotenone (not shown), cyanide, or FCCP (Fig. 3C). In summary, our results suggest that when imaged with 2P excitation, FP signals in the PT are selectively excited at 850–900 nm, are shifted to longer wavelengths compared with 1P excitation, and are relatively insensitive to changes in RC redox state.
Fig. 3.
Characterization of flavoprotein (FP) signals in kidney tissue. A: mitochondrial FP signals (emission 535–585 nm) in proximal tubules in kidney cortex slices were excited at both 750 and 850 nm. However, the signal was considerably dimmer at 950 nm. B: at an excitation wavelength of 850 nm the peak FP emission occurred at 560–590 nm, with very little signal observed in the blue range (470–500 nm). C: in contrast to NAD(P)H, FP signals showed no detectable change in intensity in response to the respiratory chain uncoupler FCCP (1 µM) or inhibitor cyanide (5 mM). Scale bars = 20 µm. FCCP, carbonyl cyanide-4-(trifluoromethoxy)phenylhydrazone.
S1 and S2 segments of the PT display differences in mitochondrial autofluorescence signals.
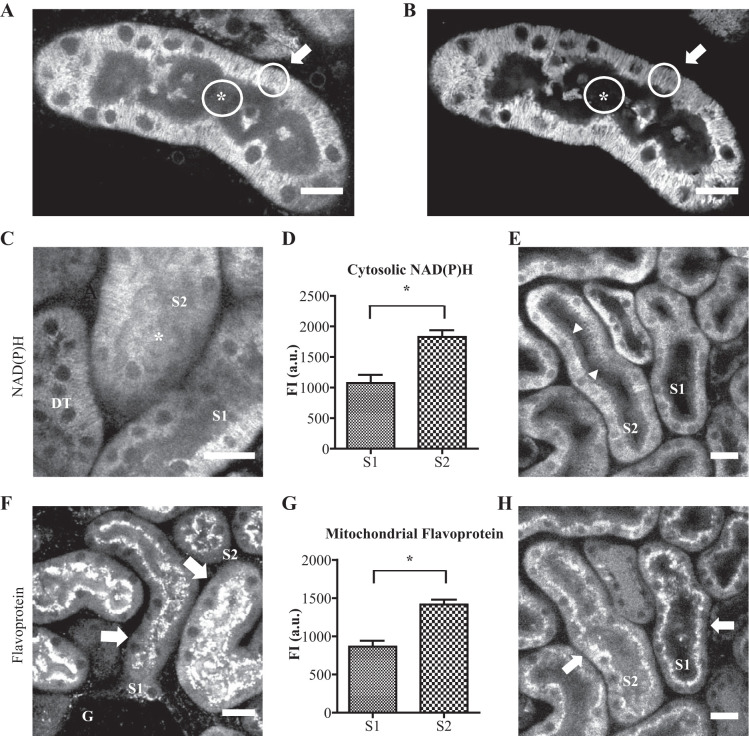
Mitochondria within PT cells are densely packed and display a characteristic basolateral distribution. To obtain mitochondrial and cytosolic autofluorescence signals within PT cells, regions of interest were placed over basolateral or apical regions, respectively (Fig. 4A). The localization of mitochondria in live tissue was confirmed by coimaging with the mitochondrial-specific dye Rhodamine 123 (Fig. 4B). When imaging large fields of view in cortical labyrinths, we observed two distinct populations of convoluted PT segments. Some segments emerged directly from glomeruli and were therefore identified as S1 with the other group assumed to be S2. Mitochondrial NAD(P)H signal intensity was similar in both S1 and S2 segments; however, the latter displayed a much brighter cytosolic signal (Fig. 4, C–D). In contrast to NAD(P)H, mitochondrial FP signal intensity was markedly higher in S2 segments than S1 (Fig. 4, F–G). To exclude the possibility of confounding damage induced by the process of preparing tissue slices, to which one segment might be more vulnerable than the other, we also performed experiments in intact kidneys using intravital imaging in anesthetized mice, where we observed the same axial patterns of NAD(P)H and FP signals (Fig. 4, E and H).
Fig. 4.
Segment (S)1 and S2 proximal tubule segments display differences in baseline metabolic autofluorescence signals. A and B: mitochondrial and cytosolic NAD(P)H signals within proximal tubule (PT) cells were obtained by drawing regions of interest (ROIs) in basolateral (arrow) and apical (*) locations. The basolateral location of mitochondria was confirmed by coimaging with Rhodamine 123. C and D: mitochondrial NAD(P)H signal intensity was similar in both S1 and S2 PT segments, but the cytosolic signal (*) was markedly higher in S2. E: cytosolic NAD(P)H signal was also higher in S2 segments (arrowheads) in vivo. F and G: mitochondrial flavoprotein (FP) signal intensity (arrows) was significantly higher in S2 segments than in S1. The identity of S1 segments was confirmed by the fact that they directly leave the glomerulus (G). PTs emit a bright green vesicular autofluorescence signal in the subapical region, most likely originating from lysosomes, which was intentionally saturated to analyze the dimmer FP signal. H: axial pattern of mitochondrial FP signals was confirmed in vivo. Scale bars = 20 µm. Data are presented as mean fluorescence signal (n = 5–7). P < 0.001 for S1s vs. S2s after paired t-test. AU, arbitrary units; DT, distal tubule; Fl, fluorescence.
Mitochondrial autofluorescence signals in the PT are substrate dependent.
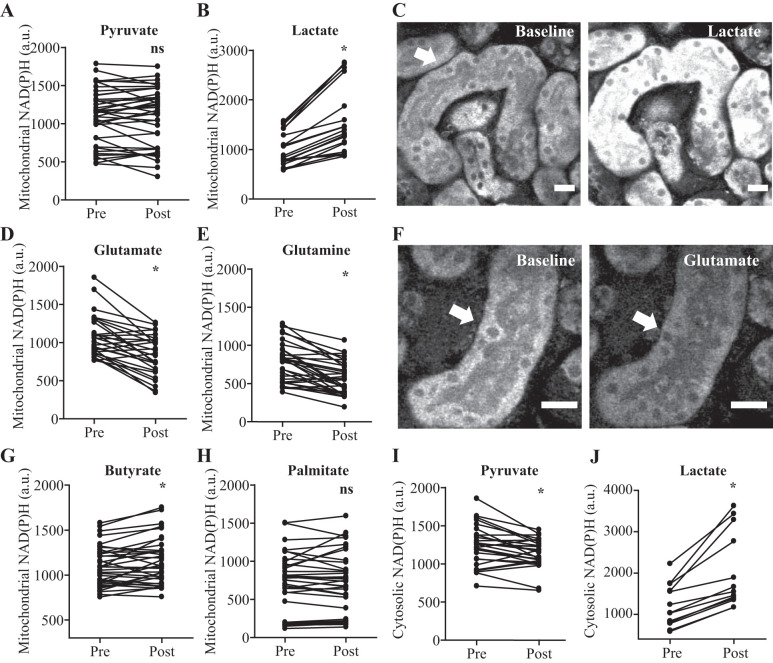
Because PTs displayed striking axial differences in metabolic autofluorescence signals, and FP signal intensity was insensitive to changes in RC redox states, we next sought to investigate how these readouts respond to changes in substrate concentrations. To do so, we incubated slices in a buffer containing only glucose for 30 min, then introduced a single substrate and recorded acute changes in NAD(P)H and FP intensity. We found that lactate and the short-chain FA butyrate both significantly increased mitochondrial NAD(P)H signal intensity (in both S1 and S2 segments) whereas glutamate and glutamine decreased the signal, and no change was observed in response to pyruvate or the long-chain FA palmitate (Fig. 5, A–H). In addition, the cytosolic NAD(P)H signal was observed to increase in response to lactate and decrease in response to pyruvate (Fig. 5, I–J).
Fig. 5.
NAD(P)H signal in kidney proximal tubules (PTs) is substrate dependent. A–C: lactate, but not pyruvate, increased mitochondrial NAD(P)H signal (arrows) in PTs. Example images are depicted pre- and 20 min postlactate. D–F: glutamate and glutamine both decreased mitochondrial NAD(P)H signal (arrows) in PTs. Example images are depicted pre- and 20 min postglutamate. G and H: mitochondrial NAD(P)H in PTs increased in response to the short-chain fatty acid (FA) butyrate but not the long-chain FA palmitate. I and J: cytosolic NAD(P)H signal decreased in response to pyruvate and increased in response to lactate. Data are presented as fluorescence intensity values before and 20 min after substrates (n = 13–39). P < 0.05 for before vs. after paired t-test. Scale bars = 20 µm. ns, not significant.
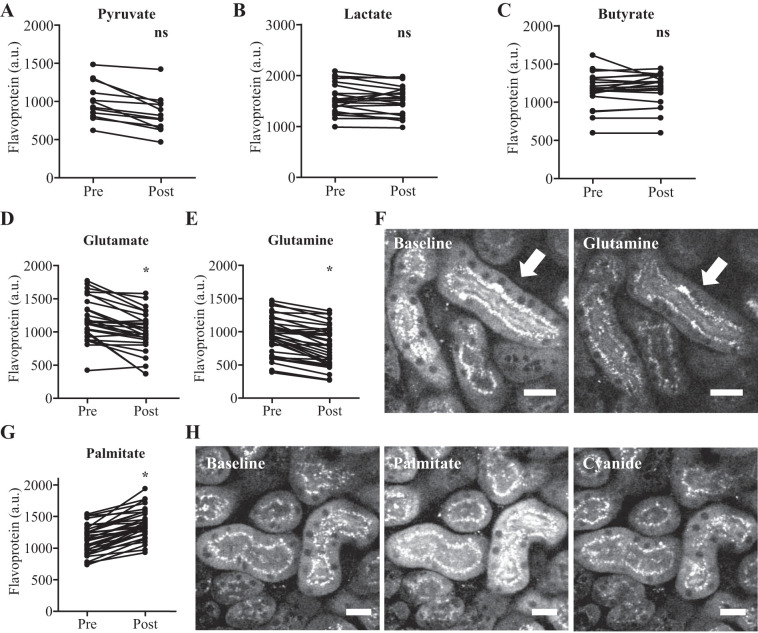
In contrast to NAD(P)H, pyruvate, lactate, and butyrate had no effect on mitochondrial FP signal intensity (Fig. 6, A–C), but the FP signal in both S1 and S2 segments decreased to a very low level in response to glutamate or glutamine (Fig. 6, D–F). Conversely, palmitate caused an acute and striking increase in the FP signal, which was reversed by the RC inhibitor cyanide, implying sensitivity to the redox state of the RC (Fig. 6, G and H).
Fig. 6.
Mitochondrial flavoprotein signals in kidney proximal tubules (PTs) are substrate dependent. A–C: mitochondrial flavoprotein (FP) signal intensity in PTs showed no change in response to pyruvate, lactate, or butyrate. D–F: FP signal intensity decreased in PTs in response to glutamate or glutamine (arrows). Example images are depicted pre- and 20 min postglutamine. G and H: mitochondrial FP signal intensity increased in PTs in response to palmitate (after 15 min), and this increase was reversed by the addition of the respiratory chain inhibitor cyanide (after 1 min). Data are presented as fluorescence intensity values before and 20 min after substrates (n = 12–34). P < 0.0001 for before vs. after paired t-test. Scale bars = 20 µm.
In summary, our results show that metabolic autofluorescence signals in the PT are heavily substrate dependent but that NAD(P)H and FPs respond differently to different metabolites. In particular, the cytosolic NAD(P)H signal is responsive to lactate and pyruvate, and the mitochondrial NAD(P)H signal is responsive to butyrate, lactate, glutamate, and glutamine whereas the mitochondrial FP signal appears to provide a novel functional readout of long-chain FA and glutamine/glutamate metabolism.
S2 segment of the PT is particularly vulnerable to inhibition of glucose metabolism.
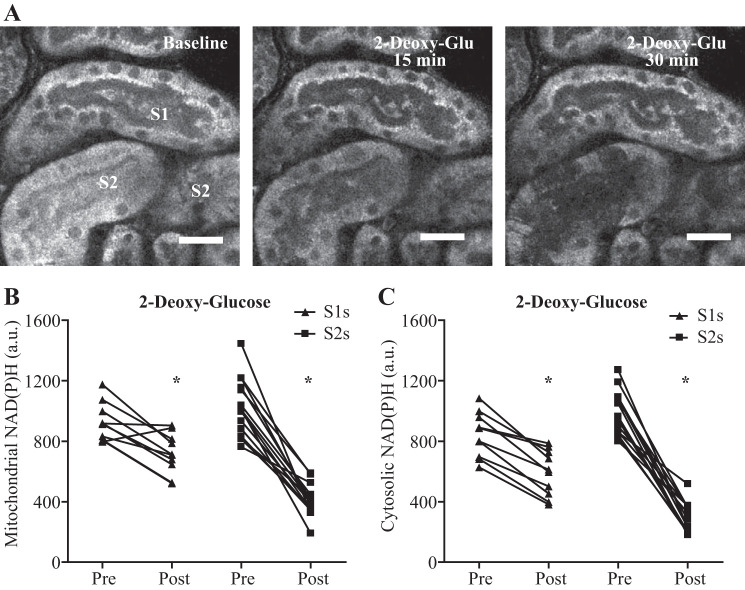
The relatively high cytosolic NAD(P)H signal in S2 segments could be explained by increased metabolism of glucose via glycolysis (which generates NADH) and/or the pentose phosphate pathway (which generates NADPH). We therefore investigated the effect of acutely blocking glucose metabolism in the PT by the addition of 2-deoxyglucose (2-DG, 10 mM). In response to 2-DG, mitochondrial and cytosolic NAD(P)H signals decreased acutely in both S1 and S2 segments; however, the response was much more dramatic in the latter (Fig. 7, A–B), suggesting a higher dependency on glucose metabolism.
Fig. 7.
Segment (S)1 and S2 proximal tubule segments respond differentially to inhibition of glucose metabolism. A–C: inhibition of glucose metabolism with 2-deoxy-glucose decreased the mitochondrial and cytosolic NAD(P)H signal in both S1 and S2 proximal tubule (PT) segments, but the response was more dramatic in S2. Data are presented as fluorescence intensity values of single tubules pre- and 35 min post-2-deoxy-glucose (n = 10–14). P < 0.05 for mitochondrial and cytosolic NAD(P)H in S1s before vs. after paired t-test. P < 0.0001 for mitochondrial and cytosolic NAD(P)H in S2s before vs. after paired t-test. Scale bars = 20 µm.
Fluorescence lifetime imaging of mitochondrial autofluorescence signals in the PT.
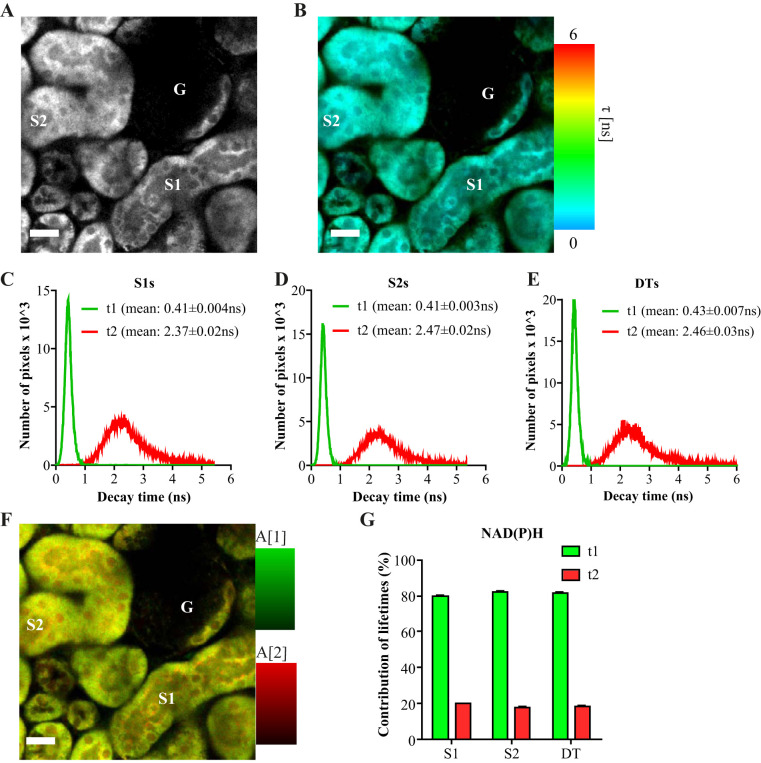
Differences in metabolic autofluorescence signal intensities between S1 and S2 PT segments could be explained by differences in abundance of the same molecules or by the existence of fluorescent species unique to one or another segment. To distinguish between these two possibilities we performed FLIM, as the unique shape of the fluorescence decays of different molecules can be used to identify and quantify molecules, even if they have very similar fluorescence emission spectra (3). At 720-nm excitation, we found two predominant mitochondrial fluorescence lifetimes, most likely corresponding to free and bound NAD(P)H, respectively (Fig. 8, A–E). The lifetime observed for the bound form was in between previous values reported for NADH and NADPH, so probably represented a mixture of both signals (5, 6). No significant differences were observed between S1, S2, or distal tubule segments in either the average lifetimes or the relative contributions of the short and long lifetime components (Fig. 8, F–G).
Fig. 8.
Fluorescence lifetime imaging of NAD(P)H signal in kidney tubules. A: image depicting NAD(P)H signal intensity at 720-nm excitation and 435–485-nm emission in proximal tubules (PTs) and a glomerulus (G). B: fluorescence lifetime microscopy (FLIM) image of the same region, showing the average decay time (τ) of NAD(P)H signal in false colors after fitting with a biexponential decay curve. The image reveals a mixture of contributing fluorophores in every pixel. C–E: histograms showing the distribution of the fluorescence lifetimes in segment (S)1 and S2 PTs, and in distal tubules (DTs), revealing two predominant lifetimes in all (τ1 and τ2), one short and one long, most likely reflecting free and bound NAD(P)H, respectively. Data are presented as mean ± SE decay values of single tubules (n = 10–21). F: example FLIM image depicting the contributions of the two major NAD(P)H lifetimes in PTs. G: mean contribution of fluorescence lifetimes (τ1 and τ2) in S1, S2, and DTs. In all of the observed segments, the short component (τ1) accounted for ~80% of the total signal, whereas the long component (τ2) accounted for only ~20% (n = 10–21). Scale bars = 20 µm. ns, not significant.
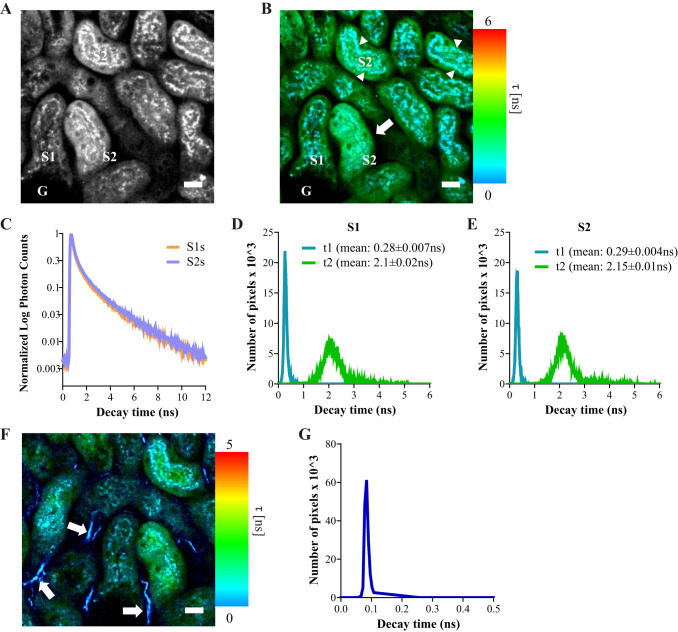
At 900-nm excitation we observed two distinct lifetimes in PTs in the green range (500–550 nm), one localizing to lysosomes and the other to mitochondria (Fig. 9, A–B). For the mitochondrial signal, no differences were observed in decay times or mean lifetimes between S1 and S2 segments (Fig. 9, C–E). In addition, a third very short lifetime (within the time range of the instrument response function) was observed in the blue range (435–485 nm) originating from nontubular structures, most likely representing second harmonic signals from collagen fibers (Fig. 9, F–G).
Fig. 9.
Fluorescence lifetime imaging of flavoprotein (FP) signals in kidney tubules. A: image depicting mitochondrial FP signal intensity at 900-nm excitation and 500–550-nm emission in proximal tubules (PTs). B: fluorescence lifetime microscopy (FLIM) image of the same region showing the average decay time (τ) of the tubules in false colors after fitting with a biexponential decay curve. Two different lifetimes were observed, one shorter (τ1) corresponding to the vesicular signal in lysosomes (arrowheads) and one longer (τ2) in the mitochondria (arrow). C–E: histograms showing similar distributions of the decay times and fluorescence lifetimes (τ1 and τ2) in both S1 segments and S2 PT segments. Data are presented as mean ± SE decay values of single tubules (n = 10). F: at 900-nm excitation a lifetime was also detected in the blue range originating from nontubular structures (arrows), most likely representing a second harmonic signal from interstitial collagen fibers. G: the histogram of the blue signal revealed a lifetime much shorter than those observed for endogenous fluorophores. Scale bars = 20 μm.
In summary, our FLIM data provide further evidence that the blue signal excited at 720 nm is indeed NAD(P)H. Moreover, we found that mitochondrial FP lifetime spectra are similar in both S1 and S2 PT segments, suggesting that differences in intensity are not explained by the existence of fluorescence species unique to either segment.
Expression of fluorescent mitochondrial FP molecules is higher in S2 PT segments than in S1.
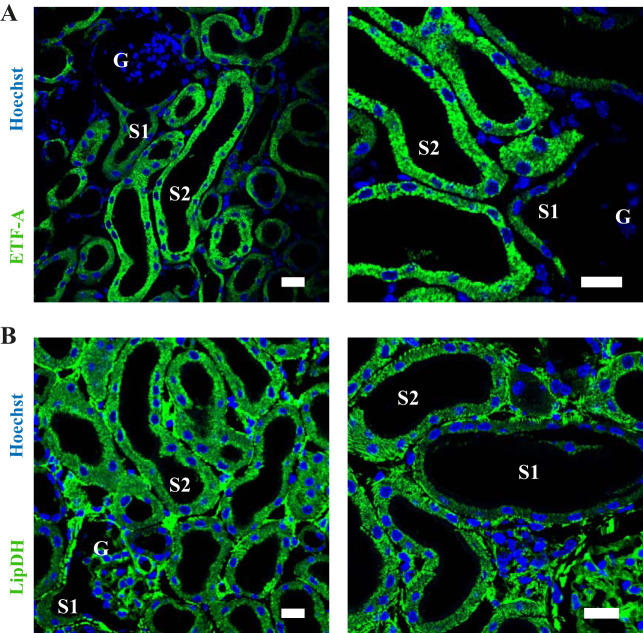
Previous studies have suggested that the predominant fluorescent FPs in kidney mitochondria are the ETF and LipDH (17). We therefore performed immuno-staining for these molecules in fixed kidney cortex sections and confirmed that they are expressed in PTs and display a basolateral, striated distribution, consistent with a mitochondrial localization (Fig. 10). Expression of both the ETF and LipDH was substantially higher in S2 segments than in S1, which might explain in part why mitochondrial autofluorescence signals in the green range are also higher in this segment in living tissue.
Fig. 10.
Expression levels of fluorescent mitochondrial flavoproteins (FPs) in kidney proximal tubules (PTs). A: antibody staining of fixed kidney cortex sections for the ETF revealed a basolateral striated expression pattern in PTs, consistent with a mitochondrial localization. Expression levels were higher in segment (S)2 than in S1. B: the expression pattern of LipDH in PTs was also consistent with a mitochondrial localization, and expression levels were also higher in S2 than S1. Scale bars = 20 μm. ETF, electron transfer FP; LipDH, lipoamide dehydrogenase.
DISCUSSION
The kidney is a highly aerobic organ, and mitochondrial defects are central to the pathogenesis of many renal diseases. However, relatively little is known about intrinsic mitochondrial function in renal tubules. Here, using live imaging, we show that metabolic autofluorescence signals can provide important readouts concerning redox state and substrate metabolism in intact PTs. Moreover, we provide evidence of substantial axial differences in signals, implying the existence of metabolic adaptation to the specialized transport functions of the subsegments of the PT.
Previous 1P excitation studies using isolated mitochondria or perfused organs have suggested that the main sources of mitochondrial autofluorescence in the kidney are NAD(P)H and FPs (16, 17). However, 1P excitation is of limited practical use in intact tissues, because of issues such as laser penetration and photo-toxicity. Studies in other organs, such as the heart, have demonstrated that these signals can be excited with multiphoton imaging (15, 25), but the nature of metabolic autofluorescence signals in the kidney with 2P excitation has not been characterized in detail until now, to our knowledge. By utilizing an ex vivo kidney cortex slice preparation, we were able to visualize with subcellular resolution how these signals change acutely in the PT in response to manipulation of the RC or changes in substrate supply under tightly controlled experimental conditions.
We have shown that at 700–750 nm excitation, a blue signal consistent with NAD(P)H can be observed in PT mitochondria, which are redox sensitive and have a similar baseline intensity in both S1 and S2 segments. In agreement with previous literature from other tissues, NAD(P)H could not be excited at longer wavelengths (15). The current experiments were performed in the mouse kidney, and we have previously reported the existence of a mitochondrial autofluorescence signal consistent with NAD(P)H in rat PTs, which was also sensitive to redox changes induced chemically or via ischemia (12, 13). In addition to manipulation of the RC, we have also found that mitochondrial NAD(P)H in PTs is responsive to certain metabolites. The signal intensity was increased by lactate and butyrate, which was expected as the metabolism of both of these substrates involves the conversion of NAD+ to NADH. In contrast, the NAD(P)H signal was decreased by glutamine and glutamate, which was surprising, as metabolism of these substrates is also thought to be NAD+-dependent but could perhaps be explained by compensatory changes in RC function.
Resolving the subcellular origin of fluorescence signals is a distinct advantage of the 2P microscopy approach, and in addition to mitochondrial signals, we also observed a cytosolic NAD(P)H component, which was markedly brighter in S2 segments at baseline. Transcriptomic studies have suggested high expression levels of the cytosolic NADPH generating pentose phosphate pathway in the S2 segment (19), which could explain this result. NADPH is required to maintain the cellular glutathione pool in a reduced state during xenobiotic metabolism, a key function of S2 cells (18). Consistent with this notion, 2-DG produced a much more dramatic decrease in NAD(P)H signal in S2, suggesting that this segment is particularly dependent on glucose metabolism and potentially explaining why older studies in the isolated perfused rat kidney reported selective damage in S2 with 2-DG (29). Cytosolic NAD(P)H signal in both S1 and S2 was also sensitive to pyruvate and lactate, consistent with expression of lactate dehydrogenase in both segments (19) and the known usage of lactate reclaimed from the filtrate as a fuel for aerobic metabolism in the PT (9).
The kidney is well known to emit substantial autofluorescence in the green range, but the origin and nature of these signals are not well understood. Flavins, such as FAD, are endogenous redox cofactors that are fluorescent in the oxidized state, so in principle should provide an inverse readout from NAD(P)H (7). However, the fluorescence properties of flavins are heavily modified by the enzymes within which they are contained, and the majority of FPs, including those incorporated in the RC, are not thought to be fluorescent (10). Therefore, it is possible that visible FP signals could be functionally related more to specific metabolic pathways, rather than the redox state of the RC. Previous 1P excitation experiments have suggested that the predominant sources of green autofluorescence in kidney mitochondria are the FAD containing ETF and LipDH (16, 17). We observed FP signals in PT mitochondria with 2P imaging that could be selectively excited at longer wavelengths (850–900 nm) that do not excite NAD(P)H, and the emission peaks were slightly red-shifted compared with those reported to 1P excitation. In contrast to mitochondrial NAD(P)H, baseline FP signals were much brighter in S2 than in S1, and we did not observe changes in signal intensity with RC blockers or uncouplers [consistent with previous reports in cardiac myocytes (15)]. However, striking changes in FP signal intensity were observed in response to certain metabolites. The long-chain FA palmitate produced an increase in signal, most likely reflecting the ETF, which was subsequently sensitive to RC blockade. Meanwhile, glutamine and glutamate dramatically decreased the FP fluorescence suggesting that the baseline signal mostly originates from α-ketoglutarate-dehydrogenase and that differences between S1 and S2 may reflect differences in glutamine/glutamate metabolism. LipDH is also contained within the pyruvate dehydrogenase enzyme complex, but we did not observe a significant change in FP signal with pyruvate.
Taken together, our findings suggest that when imaged with 2P excitation, mitochondrial FP signals in the PT essentially represent a readout of flux through specific metabolic pathways, rather than RC redox state, and thus provide additional and complementary information to NAD(P)H, which could be of use in future studies of disease processes. For example, the metabolism of glutamine and glutamate to generate ammonia and bicarbonate is an important specialized function of PT mitochondria in response to metabolic acidosis (11), whereas the metabolism of long chain FAs in the PT is thought to be altered in conditions such as acute kidney injury (30) and obesity-associated chronic kidney disease (31).
To understand further the nature of autofluorescence signals in the PT we performed FLIM, which can provide substantial additional information to intensity based imaging (2). At 720-nm excitation, we observed two principal lifetimes for NAD(P)H, consistent with previous measurements of the bound and unbound forms in other organs (6). The relative contribution of each of these components was similar in both S1 and S2 mitochondria. At 900-nm excitation, we observed a very short lifetime in the blue range in nontubular filament structures, most likely representing second harmonics from collagen fibers, which could provide a useful readout of fibrosis in disease models (26). Estimates of mitochondrial FP lifetimes in different tissues vary quite widely, but the values we obtained were similar to previous measurements of free FAD (23). Moreover, the mean lifetimes were similar between S1 and S2 segments, suggesting that differences in intensity are most probably because of differences in abundance of the same molecular species. Immuno-staining in fixed tissue subsequently confirmed the expression of both ETF and LipDH in PTs and that expression levels were indeed higher in S2 segments than S1. However, it is important to note that because FPs are only fluorescent in the oxidized state, fluorescence signal intensity in living tissue will not necessarily correlate to expression levels.
Although the kidney slice has some distinct advantages as an experimental model, including the possibility to apply single reagents or substrates directly under tightly controlled conditions, a potential disadvantage is the introduction of artifacts via the slicing process itself. However, using intravital imaging we were able to confirm that the basic axial patterns of NAD(P)H and FP signals are also preserved in vivo, and our findings are in agreement with a recent study that also reported striking differences in autofluorescence signals between S1 and S2 PT segments (14). The original classification into S1 and S2 segments was based on differences in ultrastructure visible with electron microscopy; however, because the segments cannot easily be distinguished by light microscopy in histological sections they are often considered as a single entity in studies of the PT. Nevertheless, the development of live imaging methods is increasingly revealing evidence that these segments are functionally distinct, a concept further supported by recent gene expression studies (19).
Our study has some potential weaknesses that should be considered when interpreting the findings. First, our imaging approach may not be sufficiently sensitive to detect small changes in autofluorescence signals in response to some metabolic interventions. Second, the fact that LipDH redox state is also NADH-sensitive means that reciprocal changes in the latter in response to manipulation of RC activity could have masked changes in the former that might otherwise have occurred (24). Finally, our study was performed exclusively in male mice, and axial patterns in PT function might differ in females or other species (8).
In summary, we have shown that substantial information regarding redox state and metabolism of specific substrates can be obtained in tubular cells in a noninvasive manner using a label-free live imaging approach. Our findings support the existence of significant axial differences in autofluorescence signals along the convoluted PT, suggesting that metabolism is tailored to the specific transport functions of S1 and S2 segments.
GRANTS
A. M. Hall is supported by The Swiss National Centre for Competence in Research Kidney Control of Homeostasis, a Swiss National Science Foundation project grant and the Clinical Research Priority Program “Molecular Imaging Network Zurich.” J. R. Martins is an Integrative Kidney Physiology and Pathophysiology (IKPP2) fellow funded by the European Union’s Seventh Framework Programme for research, technological development, and demonstration under Grant Agreement No. 608847.
DISCLOSURES
No conflicts of interest, financial or otherwise, are declared by the authors.
AUTHOR CONTRIBUTIONS
M.B. and J.R.M. performed experiments; M.B., J.M., and D.H. analyzed data; D.H. and A.M.H. interpreted results of experiments; M.B. and J.R.M. prepared figures; A.M.H. drafted manuscript; M.B., J.R.M., D.H., and A.M.H. edited and revised manuscript; M.B., J.R.M., D.H., and A.M.H. approved final version of manuscript.
ACKNOWLEDGMENTS
We acknowledge support from The Zurich Centre for Microscopy and Image Analysis and The Zurich Centre for Integrative Human Physiology.
REFERENCES
- 1.Bagnasco S, Good D, Balaban R, Burg M. Lactate production in isolated segments of the rat nephron. Am J Physiol Renal Fluid Electrolyte Physiol 248: F522–F526, 1985. doi: 10.1152/ajprenal.1985.248.4.F522. [DOI] [PubMed] [Google Scholar]
- 2.Becker W. Fluorescence lifetime imaging–techniques and applications. J Microsc 247: 119–136, 2012. doi: 10.1111/j.1365-2818.2012.03618.x. [DOI] [PubMed] [Google Scholar]
- 3.Berezin MY, Achilefu S. Fluorescence lifetime measurements and biological imaging. Chem Rev 110: 2641–2684, 2010. doi: 10.1021/cr900343z. [DOI] [PMC free article] [PubMed] [Google Scholar]
- 4.Bhargava P, Schnellmann RG. Mitochondrial energetics in the kidney. Nat Rev Nephrol 13: 629–646, 2017. doi: 10.1038/nrneph.2017.107. [DOI] [PMC free article] [PubMed] [Google Scholar]
- 5.Blacker TS, Mann ZF, Gale JE, Ziegler M, Bain AJ, Szabadkai G, Duchen MR. Separating NADH and NADPH fluorescence in live cells and tissues using FLIM. Nat Commun 5: 3936, 2014. doi: 10.1038/ncomms4936. [DOI] [PMC free article] [PubMed] [Google Scholar]
- 6.Breunig HG, Studier H, König K. Multiphoton excitation characteristics of cellular fluorophores of human skin in vivo. Opt Express 18: 7857–7871, 2010. doi: 10.1364/OE.18.007857. [DOI] [PubMed] [Google Scholar]
- 7.Chance B, Schoener B, Oshino R, Itshak F, Nakase Y. Oxidation-reduction ratio studies of mitochondria in freeze-trapped samples. NADH and flavoprotein fluorescence signals. J Biol Chem 254: 4764–4771, 1979. [PubMed] [Google Scholar]
- 8.Christensen EI, Wagner CA, Kaissling B. Uriniferous tubule: structural and functional organization. Compr Physiol 2: 805–861, 2012. doi: 10.1002/cphy.c100073. [DOI] [PubMed] [Google Scholar]
- 9.Cohen JJ, Kook YJ, Little JR. Substrate-limited function and metabolism of the isolated perfused rat kidney: effects of lactate and glucose. J Physiol 266: 103–121, 1977. doi: 10.1113/jphysiol.1977.sp011758. [DOI] [PMC free article] [PubMed] [Google Scholar]
- 10.de Kok A, Visser AJ. Flavin binding site differences between lipoamide dehydrogenase and glutathione reductase as revealed by static and time-resolved flavin fluorescence. FEBS Lett 218: 135–138, 1987. doi: 10.1016/0014-5793(87)81033-5. [DOI] [PubMed] [Google Scholar]
- 11.Good DW, Burg MB. Ammonia production by individual segments of the rat nephron. J Clin Invest 73: 602–610, 1984. doi: 10.1172/JCI111250. [DOI] [PMC free article] [PubMed] [Google Scholar]
- 12.Hall AM, Rhodes GJ, Sandoval RM, Corridon PR, Molitoris BA. In vivo multiphoton imaging of mitochondrial structure and function during acute kidney injury. Kidney Int 83: 72–83, 2013. doi: 10.1038/ki.2012.328. [DOI] [PMC free article] [PubMed] [Google Scholar]
- 13.Hall AM, Unwin RJ, Parker N, Duchen MR. Multiphoton imaging reveals differences in mitochondrial function between nephron segments. J Am Soc Nephrol 20: 1293–1302, 2009. doi: 10.1681/ASN.2008070759. [DOI] [PMC free article] [PubMed] [Google Scholar]
- 14.Hato T, Winfree S, Day R, Sandoval RM, Molitoris BA, Yoder MC, Wiggins RC, Zheng Y, Dunn KW, Dagher PC. Two-photon intravital fluorescence lifetime imaging of the kidney reveals cell-type specific metabolic signatures. J Am Soc Nephrol 28: 2420–2430, 2017. doi: 10.1681/ASN.2016101153. [DOI] [PMC free article] [PubMed] [Google Scholar]
- 15.Huang S, Heikal AA, Webb WW. Two-photon fluorescence spectroscopy and microscopy of NAD(P)H and flavoprotein. Biophys J 82: 2811–2825, 2002. doi: 10.1016/S0006-3495(02)75621-X. [DOI] [PMC free article] [PubMed] [Google Scholar]
- 16.Krinelke L, Kunz WS. [Characterization of surface fluorescence signals of isolated perfused rat kidney]. Biomed Biochim Acta 49: 1119–1130, 1990. [PubMed] [Google Scholar]
- 17.Kunz WS, Gellerich FN. Quantification of the content of fluorescent flavoproteins in mitochondria from liver, kidney cortex, skeletal muscle, and brain. Biochem Med Metab Biol 50: 103–110, 1993. doi: 10.1006/bmmb.1993.1051. [DOI] [PubMed] [Google Scholar]
- 18.Launay-Vacher V, Izzedine H, Karie S, Hulot JS, Baumelou A, Deray G. Renal tubular drug transporters. Nephron, Physiol 103: 97–106, 2006. doi: 10.1159/000092212. [DOI] [PubMed] [Google Scholar]
- 19.Lee JW, Chou CL, Knepper MA. Deep sequencing in microdissected renal tubules identifies nephron segment-specific transcriptomes. J Am Soc Nephrol 26: 2669–2677, 2015. doi: 10.1681/ASN.2014111067. [DOI] [PMC free article] [PubMed] [Google Scholar]
- 20.Maddox DA, Gennari FJ. The early proximal tubule: a high-capacity delivery-responsive reabsorptive site. Am J Physiol Renal Fluid Electrolyte Physiol 252: F573–F584, 1987. doi: 10.1152/ajprenal.1987.252.4.F573. [DOI] [PubMed] [Google Scholar]
- 21.Mayevsky A, Chance B. Oxidation-reduction states of NADH in vivo: from animals to clinical use. Mitochondrion 7: 330–339, 2007. doi: 10.1016/j.mito.2007.05.001. [DOI] [PubMed] [Google Scholar]
- 22.Mayrhofer JM, Haiss F, Haenni D, Weber S, Zuend M, Barrett MJ, Ferrari KD, Maechler P, Saab AS, Stobart JL, Wyss MT, Johannssen H, Osswald H, Palmer LM, Revol V, Schuh CD, Urban C, Hall A, Larkum ME, Rutz-Innerhofer E, Zeilhofer HU, Ziegler U, Weber B. Design and performance of an ultra-flexible two-photon microscope for in vivo research. Biomed Opt Express 6: 4228–4237, 2015. doi: 10.1364/BOE.6.004228. [DOI] [PMC free article] [PubMed] [Google Scholar]
- 23.Nakashima N, Yoshihara K, Tanaka F, Yagi K. Picosecond fluorescence lifetime of the coenzyme of D-amino acid oxidase. J Biol Chem 255: 5261–5263, 1980. [PubMed] [Google Scholar]
- 24.Perham RN. Domains, motifs, and linkers in 2-oxo acid dehydrogenase multienzyme complexes: a paradigm in the design of a multifunctional protein. Biochemistry 30: 8501–8512, 1991. doi: 10.1021/bi00099a001. [DOI] [PubMed] [Google Scholar]
- 25.Piston DW, Knobel SM. Real-time analysis of glucose metabolism by microscopy. Trends Endocrinol Metab 10: 413–417, 1999. doi: 10.1016/S1043-2760(99)00204-0. [DOI] [PubMed] [Google Scholar]
- 26.Ranjit S, Dobrinskikh E, Montford J, Dvornikov A, Lehman A, Orlicky DJ, Nemenoff R, Gratton E, Levi M, Furgeson S. Label-free fluorescence lifetime and second harmonic generation imaging microscopy improves quantification of experimental renal fibrosis. Kidney Int 90: 1123–1128, 2016. doi: 10.1016/j.kint.2016.06.030. [DOI] [PMC free article] [PubMed] [Google Scholar]
- 27.Schindelin J, Arganda-Carreras I, Frise E, Kaynig V, Longair M, Pietzsch T, Preibisch S, Rueden C, Saalfeld S, Schmid B, Tinevez JY, White DJ, Hartenstein V, Eliceiri K, Tomancak P, Cardona A. Fiji: an open-source platform for biological-image analysis. Nat Methods 9: 676–682, 2012. doi: 10.1038/nmeth.2019. [DOI] [PMC free article] [PubMed] [Google Scholar]
- 28.Schuh CD, Haenni D, Craigie E, Ziegler U, Weber B, Devuyst O, Hall AM. Long wavelength multiphoton excitation is advantageous for intravital kidney imaging. Kidney Int 89: 712–719, 2016. doi: 10.1038/ki.2015.323. [DOI] [PubMed] [Google Scholar]
- 29.Shanley PF, Brezis M, Spokes K, Silva P, Epstein FH, Rosen S. Differential responsiveness of proximal tubule segments to metabolic inhibitors in the isolated perfused rat kidney. Am J Kidney Dis 7: 76–83, 1986. doi: 10.1016/S0272-6386(86)80059-2. [DOI] [PubMed] [Google Scholar]
- 30.Tran MT, Zsengeller ZK, Berg AH, Khankin EV, Bhasin MK, Kim W, Clish CB, Stillman IE, Karumanchi SA, Rhee EP, Parikh SM. PGC1α drives NAD biosynthesis linking oxidative metabolism to renal protection. Nature 531: 528–532, 2016. doi: 10.1038/nature17184. [DOI] [PMC free article] [PubMed] [Google Scholar]
- 31.Udi S, Hinden L, Earley B, Drori A, Reuveni N, Hadar R, Cinar R, Nemirovski A, Tam J. Proximal tubular cannabinoid-1 receptor regulates obesity-induced CKD. J Am Soc Nephrol 28: 3518–3532, 2017. doi: 10.1681/ASN.2016101085. [DOI] [PMC free article] [PubMed] [Google Scholar]


