Abstract
Cancer-cachexia (CC) is a wasting condition directly responsible for 20–40% of cancer-related deaths. The mechanisms controlling development of CC-induced muscle wasting are not fully elucidated. Most investigations focus on the postcachectic state and do not examine progression of the condition. We recently demonstrated mitochondrial degenerations precede muscle wasting in time course progression of CC. However, the extent of muscle perturbations before wasting in CC is unknown. Therefore, we performed global gene expression analysis in CC-induced muscle wasting to enhance understanding of intramuscular perturbations across the development of CC. Lewis lung carcinoma (LLC) was injected into the hind-flank of C57BL6/J mice at 8 wk of age with tumor allowed to develop for 1, 2, 3, or 4 wk and compared with PBS-injected control. Muscle wasting was evident at 4 wk LLC. RNA sequencing of gastrocnemius muscle samples showed widespread alterations in LLC compared with PBS animals with largest differences seen in 4 wk LLC, suggesting extensive transcriptomic alterations concurrent to muscle wasting. Commonly altered pathways included: mitochondrial dysfunction and protein ubiquitination, along with other less studied processes in this condition regulating transcription/translation and cytoskeletal structure. Current findings present novel evidence of transcriptomic shifts and altered cellular pathways in CC-induced muscle wasting.
Keywords: Lewis lung carcinoma, muscle wasting, RNA sequencing
INTRODUCTION
Approximately 39.6% of men and women will receive a cancer diagnosis during their lifetime. Of the estimated 1,685,210 new cancer diagnoses in the United States in 2016 ~600,000 are expected to eventually die as a result of their cancer (10). Importantly, up to 80% of cancer patients will experience varying degrees of cancer-cachexia (CC) (11). CC is defined as the ongoing loss of muscle mass occurring concurrently with cancer that cannot be fully reversed by nutritional interventions alone (5, 13). CC is estimated to be responsible for 20–40% of cancer-related deaths, depending on the type and severity of cancer, as well as how soon preventative measures are taken (1). Notably, in cancers less commonly associated with CC, if cachexia does occur it associated with poor prognosis (15, 22, 24). Unfortunately, the exact mechanisms responsible for the development of CC are not fully elucidated. Importantly, few efforts have been made to elucidate alterations during the development of CC, rather focusing on assessment in the cachectic state itself.
Current evidence suggests nutritional changes alone cannot reverse the effects of CC (1), which suggests the muscle wasting is largely due to altered metabolism both systemically and intramuscularly. The current lack of efficacious treatments suggests our mechanistic understanding of CC, while well researched, remains incomplete and requires the utilization of new approaches to study and identify mechanisms of CC. Specifically, recent literature calls for a treatment focus on prevention, rather than reversal, of CC (12). Despite such calls, current literature suggests clinicians do not treat for cachexia until at least 15% body weight loss, and the majority of patients are treated for cachexia only after cancer has developed to Stage IV (21). Regrettably, there is currently a relative dearth of data examining the development of CC. To best develop preventive measures it becomes critical to understand the process of cachectic development rather than a sole focus on the intracellular modulation in the cachectic state itself. Some prior work has inferred progression of this condition by examining varying degrees of cachexia in spontaneous colorectal cancer (26), but to our knowledge few prior efforts have been put forward to examine the direct time course development of CC-induced muscle wasting. To this end, we recently demonstrated functional mitochondrial degenerations occur before the onset of the muscle wasting in Lewis lung carcinoma (LLC) tumor-bearing mice (7). These alterations included: increased free radical emission, network degeneration, and impaired respiratory function of the mitochondria. While these are among the first data to demonstrate a direct functional impairment in muscle before wasting in CC, the full implications of alterations in the muscle before phenotypic muscle wasting in CC remain elusive.
Gallagher et al. (14) recently called for the use of -omics approaches to examine intracellular alterations in this condition and provide a wider assessment of the intracellular impairments associated with this condition. These approaches allow for consideration of the complex and multifaceted nature of CC to best determine affected processes that may promote muscle wasting. As such, consideration of -omics approaches and early-stage developments may be key to the identification of novel mechanisms and pathway interactions vital to the development of new and efficacious therapies. Therefore, the purpose of this study was to examine transcriptomic alterations over the time course of CC development in a preclinical model. By combining the time course model of CC progression with transcriptomic analyses, using samples from our prior study, we are able to now provide insight into transcriptomic alterations and associated pathways that may lead to further understanding and hypothesis testing of cellular processes affected across the muscle during the development of CC-induced muscle wasting.
MATERIALS AND METHODS
Animals and interventions.
All methods were be approved by the Institutional Animal Care and Use Committee of the University of Arkansas. A cohort of male C57BL6/J mice (Jackson Laboratories, Bar Harbor, ME; n = 40) from a larger study (7) were randomly selected, and phenotypic statistics were assessed to ensure representation of the larger cohort. Mice were housed in a temperature-controlled room on a 12:12 h light-dark cycle with food and water provided ad libitum. LLC cells were injected subcutaneously into the hind flank of C57BL6/J mice at 1 × 10⁶ cells in 100 μl PBS as previously described (7, 17, 25). Control mice received a similar injection of 100 μl PBS. To examine progression of CC over time course, tumors were allowed to grow for 1, 2, 3, or 4 wk (n = 8 mice/experimental condition); mice injected with PBS were euthanized at 12 wk of age to age match week 4 cachectic mice. At the appropriate time point above mice were anesthetized under isoflurane anesthesia, and gastrocnemius muscles were removed and snap-frozen before storage at −80°C before euthanization. To control for alterations in total body size between groups, tibia lengths were assessed as a surrogate of body size independently of total body weight. No differences were observed in tibia length among groups; therefore, descriptive data are presented as raw wet weights.
RNA isolation and quality check.
RNA isolation was performed as previously described (16). To perform RNA isolation and downstream RNA sequencing experiments we chose to utilize the mixed-fiber type gastrocnemius muscle. The mixed fiber-type aspect of this muscle allows for a more direct comparison of the data collected to the whole of the musculature as opposed to a more specifically slow twitch or fast twitch fiber. Whole gastrocnemius muscle from each animal was pulverized at the temperature of liquid nitrogen allowing a uniform mixture of the full muscle to be represented in all experiments. Approximately 120 mg of pulverized muscle was then suspended in 1 ml of Trizol (Invitrogen cat. #10296-028). Samples were then homogenized using Polytron for ~5 s before being transferred into 1.5 ml cryotube and placed on ice. After 15 min, samples were placed in centrifuge for 10 min, and the clear supernatant placed into a new tube; 200 μl of 100% chloroform was then added, and the sample centrifuged for 25 min. The clear solution was removed from the top and placed in a new, sterile tube. An equal amount to the sample of 70% DEPC EtOH was added, and the sample loaded in to an RNeasy column. RNA isolation was then performed using an Ambion RNA Isolation Kit (Life Technologies, Carlsbad, CA), and samples were DNase treated following isolation. RNA quality and concentration were determined using Agilent 2200 TapeStation (Agilent Technologies, Santa Clara, CA). Mean RINe scores from TapeStation analysis for submitted samples were 8.56 ± 0.06 (mean ± SE).
RNA sequencing and data analysis.
RNA sequencing was completed at the Genomics Core at Michigan State University (East Lansing, MI). Libraries were prepared using the Illumina TruSeq Stranded mRNA Library Preparation Kit using a polyA-enrichment strategy. The pool was loaded onto Illumina HiSeq 2500 High Output flow cell (v4) and sequenced in a 1 × 50 bp single read format using HiSeq v4 SBS reagents. Base calling was done by Illumina Real Time Analysis (RTA) v1.18.64, and output of RTA was demultiplexed and converted to FastQ format with Illumina Bcl2fastq v1.8.4.
Quality control of raw reads was determined using FastQC tool kit (Babraham Bioinformatics, https://www.bioinformatics.babraham.ac.uk/projects/fastqc/). The clean sequenced reads were then aligned with reference genome of Mus musculus (GRCm38.p5) downloaded from NCBI using Hisat2 tool (23), and reads aligning to gene exons were counted using HTSeq framework (2). List of differentially expressed genes between individual experimental groups was obtained by analyzing HTSeq counts using DESeq2 package by applying regularized log transformation (19). Differentially expressed (DE) genes were identified as surpassing threshold levels of false discovery rate (FDR) = 0.05 and Log2FC = 0.6. Ingenuity Pathway Analysis (IPA; Qiagen, Valencia, CA; https://www.ingenuity.com) software was used for canonical pathway analysis and functional annotation. Prediction of upstream transcription factor signatures for differentially expressed genes was performed using Dire tool (https://dire.dcode.org/). Visualization of intersections of genes between experimental groups was performed using UpSetR package (18), and subsequent functional clustering of individual sets was based on Gene Ontology and performed using AmiGO tool (9). RNA sequencing data were analyzed by two separate investigators (I. C. and B. K.) utilizing discrete methodology (B. K. used ArrayStar program in Lasergene software package followed by basic workflow of JMP Genomics 9.0 to analyze the RNA-Seq data. I. C. used Hisat2 tool to align the reads, HTSeq count to quantify exons and DESeq2 for DE analyses) with strong agreement between analyses. (Gene Expression Omnibus accession number GSE114820).
Comparison of RNA sequencing to the MitoCarta.
Identified DE genes were compared with the mouse MitoCarta 2.0 (8) utilizing custom computer software provided by Kevin B. Greene. Identified genes that were identified by RNA Sequencing as DE and appeared in the MitoCarta 2.0 were tallied.
Statistical analysis.
A one-way ANOVA was employed for the global analysis for all variables of interest. Descriptive data including body, tumor, and tissue weights were analyzed using SAS version 9.4 (SAS, Cary, NC). The comparison-wise error rate, α, was set at 0.05 for all statistical tests. For descriptive data, when significant F-ratios were found, multiple comparisons were made among all groups using Student-Newman-Keuls post hoc analysis. Data from RNA sequencing analysis was analyzed using JMP Genomics; data were normalized using the upper-quantile method in basic RNA-Seq workflow of JMP Genomics 9.0. The normalized values were then log2 transformed, and further statistical analysis was performed using ANOVA. For sequencing analysis, when significant F-ratios were found, multiple comparisons were made among all groups with P value correction through FDR calculation among all pair-wise comparisons. DE genes were identified as surpassing threshold levels of FDR = 0.05 and Log2FC = 0.6.
RESULTS
Phenotypic description of LLC-induced muscle atrophy across time course.
These analyses were performed on a cohort of animals from a larger study (7) representing eight mice per condition. For the current experiment animals were randomly selected and phenotypic data assessed to match same general response as seen in Brown et al. (7). For the current cohort, body weights without tumor were not different between experimental conditions across the 4 wk cancer development (P = 0.22) despite significantly lower (~10–18%) muscle weights of the gastrocnemius, tibialis anterior, extensor digitorum longus, and plantaris in week 4 LLC (P = 0.0016, 0.0006, 0.0088, and 0.0017 respectively; Table 1). Epididymal fat mass means were lower in week 3 and week 4 LLC animals (~33%); however, ANOVA test showed no significant differences between experimental conditions (Table 1). Spleen mass was ~300% greater in week 3 LLC and further enlarged ~500% in week 4 LLC compared with PBS animals (P < 0.0001, Table 1).
Table 1.
Phenotypic data of cohort
| PBS | 1 wk | 2 wk | 3 wk | 4 wk | |
|---|---|---|---|---|---|
| Body weight, g | 24.25 ± 1.59 | 23.24 ± 1.17 | 22.73 ± 1.75 | 22.5 ± 2.37 | 23.05 ± 0.94 |
| Gastrocnemius, mg | 133.9 ± 11.2 | 122.6 ± 8.6 | 124.7 ± 11.8 | 119.3 ± 9.8* | 111.6 ± 10.9* |
| Tibialis anterior, mg | 45.2 ± 4.8 | 41.2 ± 3.7 | 42.8 ± 3.6 | 40.6 ± 5.1 | 36.0 ± 2.8* |
| Extensor digitorum longus, mg | 9.6 ± 1.0 | 9.5 ± 0.9 | 9.8 ± 1.0 | 9.6 ± 1.5 | 7.9 ± 1.3* |
| Plantaris, mg | 18.4 ± 1.6 | 17.7 ± 1.2 | 17.8 ± 1.6 | 16.4 ± 1.8*† | 15.3 ± 1.9*† |
| Epididymal fat, mg | 360.3 ± 58.2 | 368.2 ± 110.9 | 341.0 ± 47.5 | 273.6 ± 119.0 | 252.3 ± 86.6 |
| Spleen, mg | 81.1 ± 58.2 | 76.6 ± 8.2 | 81.4 ± 10.8 | 238.7 ± 121.2* | 391.5 ± 99.0*‡ |
Data represent mean body weight, hindlimb muscle weights, epididymal fat, and spleen weights across all experimental conditions. All values are represented as means ± SD.
Significant difference (P ≤ 0.05) from PBS.
Significant difference (P ≤ 0.05) from 1 wk animals.
Significant difference from 3 wk animals.
Global gene expression analysis effectively discriminates cachectic vs. noncachectic tumor-bearing mice.
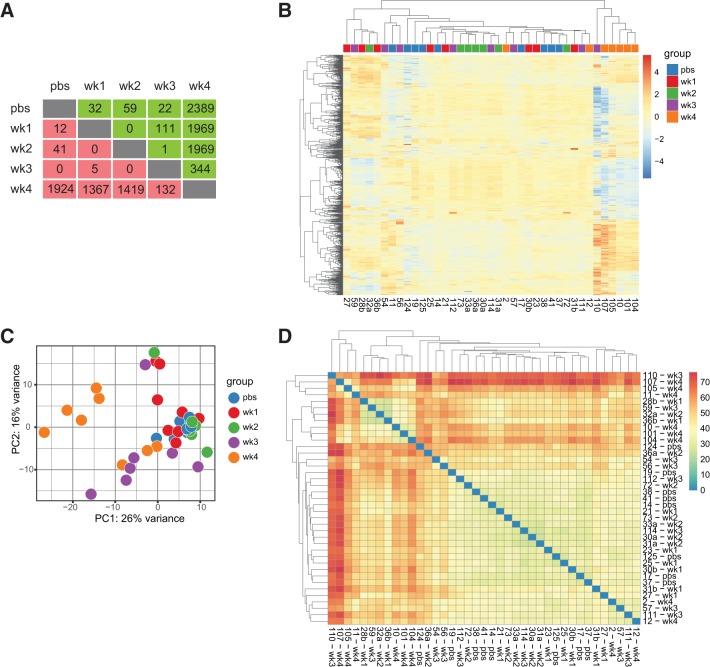
We identified 27,107 genes by RNA Sequencing of gastrocnemius muscle across time course of CC development. Following FDR correction most statistically significant between group differences are seen when examining week 4 LLC mice compared with all other experimental groups (Fig. 1A). Hierarchical clustering, principal component analysis, and sample-to-sample distances demonstrate good discrimination between experimental conditions (Fig. 1, B–D). Heat map of hierarchical clustering of the top 1,000 most highly expressed genes showed grouping of week 4 LLC mice with significant differences in gene expressions compared with animals from all other experimental conditions (Fig. 1B).
Fig. 1.
RNA sequencing readily discriminates between experimental conditions. A: summary table of the number of up and downregulated genes in individual group comparisons by P value [false discovery rate (FDR) adjusted] alone. Red signifies downregulated genes; green signifies upregulated genes. B: hierarchical clustering heat map of 1,000 most highly expressed genes. Red signifies increased gene expression, while blue signifies decreased gene expression. C: principal component analysis (PCA) of individual samples designated by experimental condition. D: heat map of sample-to-sample distances. Darker colors indicate greater differences in expression.
DE genes appeared primarily in comparisons to 4 wk LLC mice.
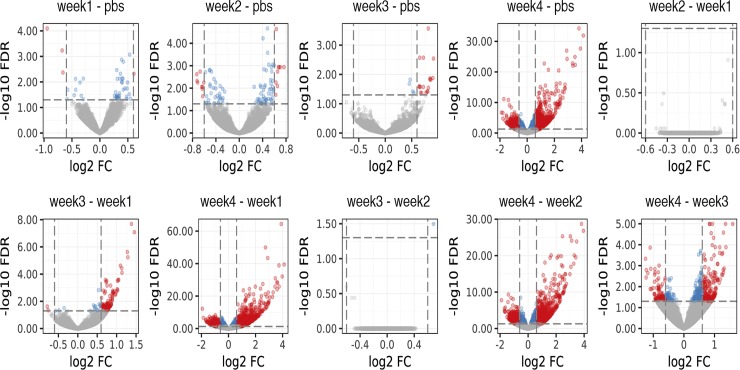
Volcano plots of DE genes in each individual comparison are shown in Fig. 2. These plots show that the highest numbers of alterations in gene expression are seen when comparing week 4 LLC animals to other experimental groups. For PBS and weeks 1–3 LLC tumor-bearing animals ≤100 DE genes were identified for any given comparison. By contrast, the number of DE genes was tallied and revealed 932 downregulated and 993 upregulated genes in 4 wk LLC compared with PBS control (Fig. 3); note data in Fig. 1A represent statistically significant genes (FDR < 0.05) and not necessarily DE (DE defined as: FDR < 0.05 and Log2FC > 0.6).
Fig. 2.
Volcano plots of differentially expressed (DE) genes in individual comparisons. Plots demonstrate large shift in proportion of DE genes at the 4 wk tumor-bearing time point with smaller numbers of DE genes among all other comparisons. DE was defined as FDR < 0.05 and Log2(Fold Change) > 0.6, all DE genes denoted by red color. Blue color denotes a gene that reached an FDR < 0.05, but Log2(Fold Change) was not >0.6.
Fig. 3.
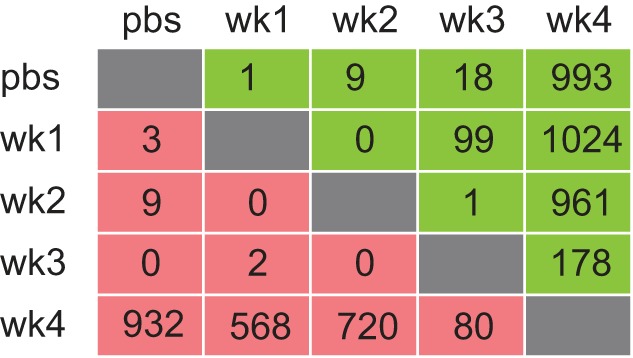
Summary table of DE genes by FDR<0.05, Log2FC > 0.6. Representation herein provides a tally of the total number of DE genes among all comparisons. The number of up- and downregulated DE genes in individual group comparisons are shown [FDR < 0.05, Log2(Fold Change) > 0.6]. Red denotes downregulated DE genes; green denotes upregulated DE genes.
Pathway analysis of DE genes for all comparisons.
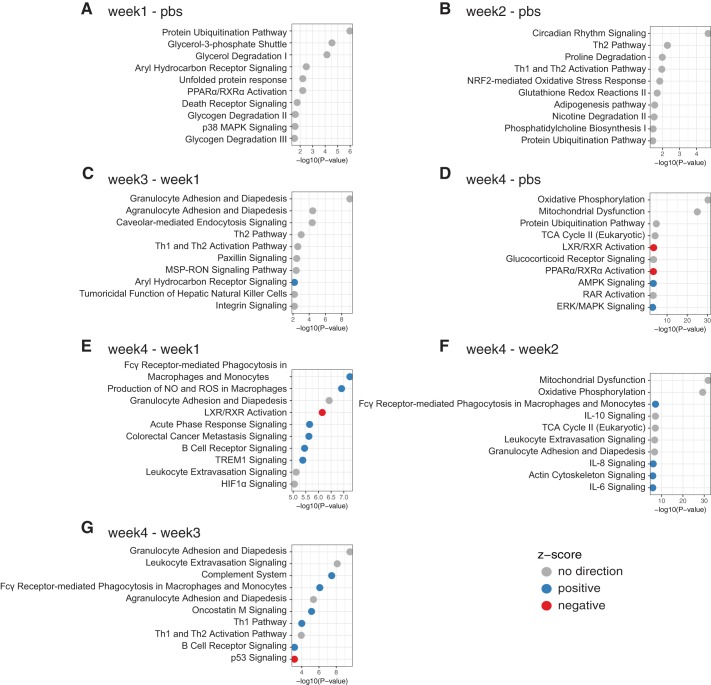
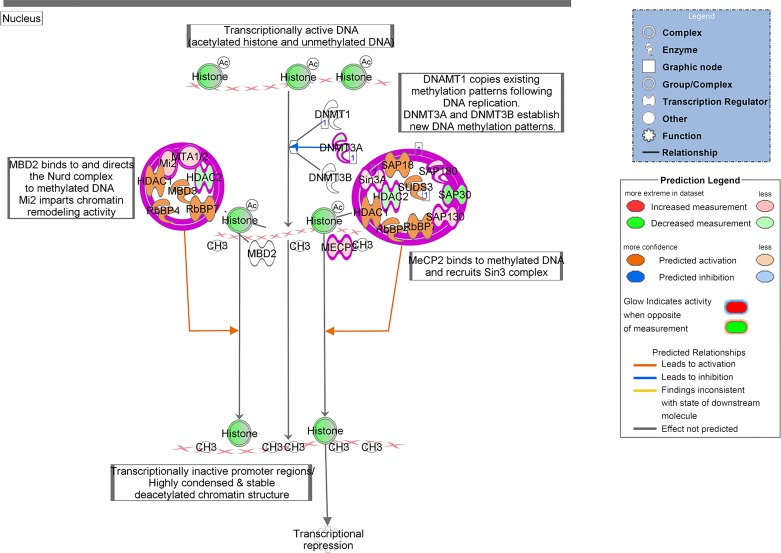
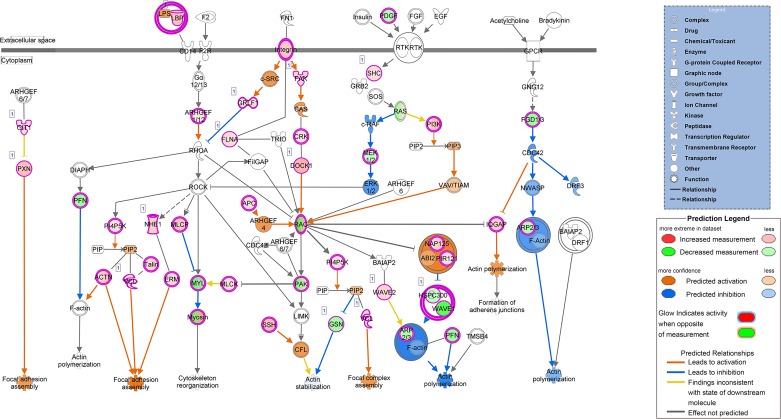
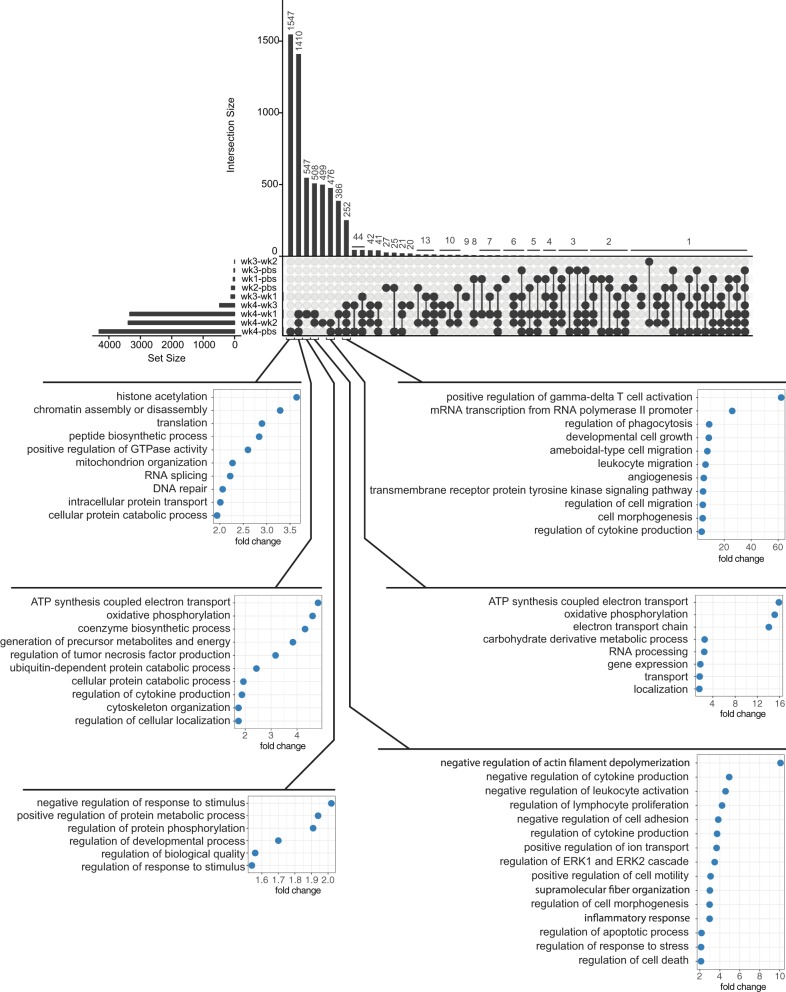
Pathway analysis using the IPA suite was performed for all comparisons with sufficient number of DE genes (Fig. 4). Commonly impacted pathways across individual comparison groups in descending order of frequency include granulocyte adhesion and diapedesis, protein ubiquitination, Th1 and Th2 activation, Fcy-receptor mediated phagocytosis in macrophages and monocytes, leukocyte extravasation, aryl-hydrocarbon receptor signaling, PPARα and RXRα activation, TH2 pathway, agranulocyte adhesion and diapedesis, oxidative phosphorylation, mitochondrial dysfunction, TCA cycle II (eukaryotic), LXR/RXR activation, and B cell receptor signaling (Fig. 4). Interestingly, multiple pathways involved in maintenance of DNA, transcription and translation, as well as those involved in maintenance of the cytoskeleton and cell morphology, were identified. A depiction of alterations observed in relation to DNA methylation and transcriptional repression (10 of 20 genes modified in 4 wk LLC compared with PBS) can be seen in Fig. 5 and of those in the actin cytoskeleton (57 of 228 genes modified in 4 wk LLC compared with PBS) can be seen in Fig. 6. An UpSet Plot for commonalities among multiple comparisons elucidates a clear relationship between week 4 LLC animals and altered gene expression (Fig. 7). When comparing week 4 LLC with PBS, week 1 LLC, and week 2 LLC, we observe alterations in ATP synthesis coupled electron transport, oxidative phosphorylation, regulation of tumor necrosis factor production, ubiquitin-dependent protein catabolic processes, and cellular protein catabolic processes (Fig. 7).
Fig. 4.
IPA analysis of comparisons with sufficient number of DE genes demonstrates pathways with significant transcriptomic alteration. Graphs identify 10 most highly affected pathways within each comparison. All represented pathways were statistically significant. If applicable, z-score indicates whether pathway was up- or downregulated.
Fig. 5.
IPA analysis of alterations in DNA methylation processes in comparison of 4 wk Lewis lung carcinoma (LLC) tumor-bearing to PBS control. Ten of 20 genes in process were affected in this comparison, indicating 50% of genes involved in DNA methylation are impacted in cancer-induced muscle wasting. Legends indicate types of molecules involved and display color chart for expression and predicted activation.
Fig. 6.
IPA analysis of alterations in actin cytoskeleton maintenance in comparison of 4 wk LLC tumor-bearing to PBS control; 57 of 228 genes in process were affected in this comparison demonstrating a significant alteration in the maintenance of the actin cytoskeleton. Legends indicate types of molecules involved and display color chart for expression and predicted activation.
Fig. 7.
UpSet plot of the number of genes that were common or exclusive between comparison groups. Illustrations below show gene ontology for pathways indicated as altered by the aligned comparison of experimental conditions.
Considering the common occurrence of processes including mitochondrial dysfunction and electron transport along with our prior findings (7), we specifically examined pathways of mitochondrial dysfunction between week 4 LLC and PBS control groups, showing 93 of 171 known genes in mitochondrial dysfunction were affected; a depiction of mitochondrial dysfunction genes specific to oxidative phosphorylation is given in Fig. 8. Specifically within oxidative phosphorylation, 74 of 109 genes were affected. These data show direct impacts on all four respiratory complexes of the electron transport system along with complex V/ATP synthase. Furthermore, DE genes in each comparison were matched against the MitoCarta 2.0; most notably we observed 255 DE genes in the comparison of week 4 LLC with week 2 LLC, 213 DE genes in the week 4 LLC with week 1 LLC comparison, and 340 DE genes in the week 4 LLC with PBS comparison with matches to the MitoCarta (Table 2), among a total of 1,158 total genes in the mouse MitoCarta (8).
Fig. 8.
IPA analysis of oxidative phosphorylation pathway in comparison of 4 wk LLC tumor-bearing to PBS control. Illustration demonstrates altered gene expression by coloring in the corresponding gene. Genes displayed with a white background were unaltered. Alterations were seen in all 4 respiratory complexes of the electron transport system and complex V/ATP synthase; 74 out of 109 genes in this pathway were significantly altered in this comparison.
Table 2.
Portion of statistically significant genes with positive match to the MitoCarta 2.0
| Group | Identified Genes in MitoCarta | % of MitoCarta | Total Identified Genes | % of Total Genes |
|---|---|---|---|---|
| Week 1 to PBS | 0 | 0 | 44 | 0 |
| Week 2 to PBS | 4 | 0.3 | 100 | 0 |
| Week 3 to PBS | 0 | 0 | 22 | 0 |
| Week 4 to PBS | 340 | 29.3 | 4,313 | 7.9 |
| Week 2 to week 1 | 0 | 0 | 0 | 0 |
| Week 3 to week 2 | 0 | 0 | 1 | 0 |
| Week 3 to week 1 | 3 | 0.3 | 116 | 2.6 |
| Week 4 to week 1 | 213 | 18.4 | 3,336 | 6.4 |
| Week 4 to week 2 | 255 | 22.0 | 3,388 | 7.5 |
| Week 4 to week 3 | 20 | 1.7 | 476 | 4.2 |
Analysis of transcription factors common to DE genes among comparisons.
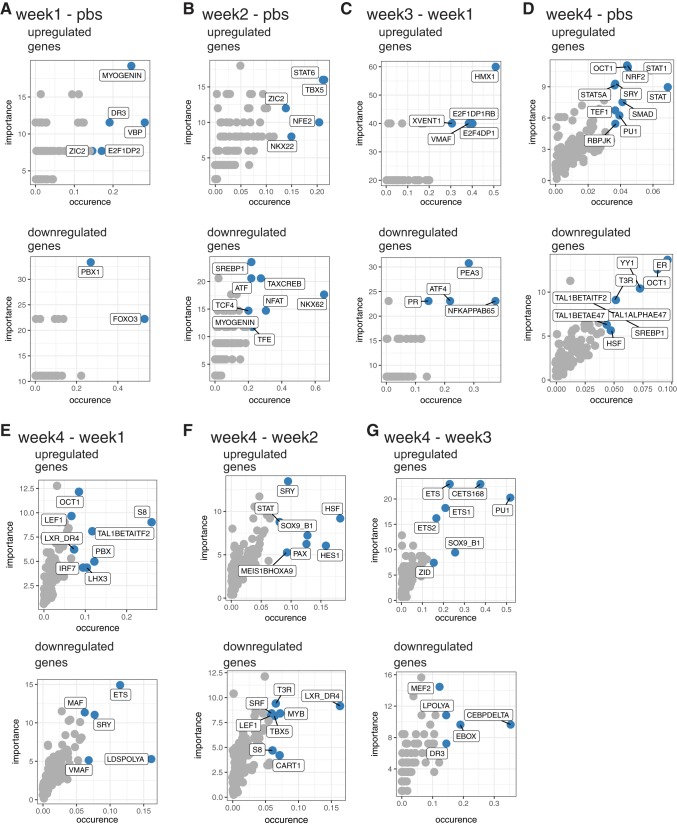
Subsequently we analyzed DE genes in each comparison for transcription factors likely mediating the alterations observed. Transcription factors and families of transcription factors that appeared among multiple comparisons included OCT1, SRY, Myogenin, DR3, ZIC2, TBX5, SREBP1, STAT, PU1, T3R, TAL1BETAITF2, HSF, LEF1, S8, ETS, and SOX9_BP1. Furthermore, multiple transcriptional factors with specific influence over muscle processes (i.e., myogenesis) were observed including: Myogenin, FOXO3, NF-kB p65, and PAX (Fig. 9).
Fig. 9.
IPA transcription factor analysis of comparisons with sufficient number of DE genes. Illustrations show prediction of common regulatory elements for transcription factors in identified up- and downregulated genes (https://dire.dcode.org/) between each noted comparison of experimental conditions.
DISCUSSION
We are the first to combine global gene expression analysis with a time-course design to gain insight into the transcriptomic alterations in the initial development of muscle wasting in CC. We recently demonstrated early-onset mitochondrial derangements well before development of muscle wasting in CC (7), suggesting early-stage alterations within the muscle before measurable losses in muscle mass. In this investigation we examined the transcriptomic alterations across the development of CC-induced muscle atrophy over the same time course in an attempt to better understand the full scale of alterations within the muscle during cachexia development. Our analyses demonstrate clear differentiation in muscle transcriptomics with the development of muscle wasting in CC. Notably, few DE genes were identified before onset of muscle wasting; however, the number of DE genes, both positively and negatively regulated, massively increases with the onset of cachectic muscle wasting. These data suggest a clear point in the development of cachectic wasting at which large-scale transcriptomic shifts occur in conjunction with onset of muscle wasting in CC. We can also see distinct modulation in critical pathways, including among others: autoimmune function, protein ubiquitination, and oxidative metabolism, as muscle wasting develops. In conjunction with our prior report (7) we now see that mitochondrial impacts appear central to development of muscle wasting in CC (prior functional assessment coupled with pathway analyses here), and CC develops in a clear progression from early-onset functional metabolic derangements to large transcriptomic shifts concurrent with the onset of wasting itself.
Key to our further assessments, our experimental model was successful as per key components in the utilized definition of CC including the specific loss of muscle mass, along with reduced fat mass (13). Phenotypic analysis of muscle wet weights showed significant decrease in muscle (4 wk posttumor implantation) and fat masses and increased spleen mass (surrogate marker of whole body inflammation common to CC) beginning in week 3, consistent with previously reports using LLC implantation models of CC (3, 27). Furthermore, our assays effectively differentiated between pre- and postcachectic conditions (Fig. 1). Hierarchical clustering analysis (Fig. 1B) showed grouping of week 4 LLC animals when compared with PBS controls and other developmental stages of LLC-implanted mice. Therefore, we demonstrate the development of cachectic muscle wasting, which can be discriminated from early conditions through RNA sequencing-based transcriptomic analyses.
Most importantly, we now show for the first time that large transcriptomic shifts in gene expression do not occur until the onset of muscle wasting in CC (Figs. 2 and 3). In contrast, we recently observed impaired functional mitochondrial health preceding decreases in muscle wet weight that was observed as early as 1 wk following tumor implantation through a doubling in mitochondrial ROS emission (7). It is then of significant interest that large transcriptomic shifts do not occur until 4 wk following tumor implantation concurrent with development of the muscle-wasting phenotype. Therefore, we now see that functional alterations previously described (7) in early-stage development of CC appear to be paired with only minimal changes to the muscle transcriptome and thus measures of functional alteration may be required to determine susceptibility to subsequent muscle wasting in CC. Prior work by Bonetto et al. (6) has examined the transcriptomic alteration with progression of CC from moderate to severe in the C-26 colon cancer implantation model. They similarly demonstrate that muscles of tumor-bearing animals exhibit significant alterations to the transcriptomic profile in the wasting condition. Interestingly, though the number of altered transcripts did not shift in their study from moderate to severe cachexia, the identity of those transcripts did exhibit a large shift. However, in their study all tumor-bearing animals were studied following the onset of muscle wasting. As such, from the combination of the current findings and prior work from our group (7) and Bonetto et al. (6), we now propose that intramuscular alterations occur via a pair of trigger points: one early leading to functional metabolic derangements and a second wherein muscle wasting and large-scale transcriptomic shifts occur concomitantly, which is subject to continuing alteration as the severity of CC progresses.
To better understand the functional implications of the observed transcriptomic alterations we next performed IPA pathway analyses to define altered cellular pathways in the development of CC. Prior literature has tied CC to alterations in muscle protein degradation, protein synthesis, and inflammatory signaling, among others (4, 20, 28, 29). Consistent with prior work we identified alterations in inflammatory, immune, protein ubiquitination, and protein synthetic pathways. We now extend prior work by identifying altered pathways throughout development of the condition by observing shifts in additional pathways. Notably, despite the lack in total number of identified DE genes at early time points (those preceding significant muscle loss), we do note alterations in several pathways in comparison to PBS control animals, which in addition to classic degradatory pathways such as protein ubiquitination and death receptor signaling include glycerol-3 phosphate shuttle, glycerol degradation, and p38 MAPK signaling (week 1 LLC - PBS); and circadian rhythm signaling and NRF-2 mediated oxidative stress response (week 2 LLC - PBS). Considering the small total number of alterations in these early stages of cachectic development it is likely that these few pathways represent significant opportunities to understand the instigating mechanisms in CC.
When examining the pathways specifically modulated in cachectic wasting (4 wk LLC) compared with precachectic conditions we see negative regulation of several important pathways, namely: actin filament depolymerization, cell morphogenesis, supramolecular fiber organization, cytoskeleton organization, and cell adhesion. These combined pathways suggest that tumor-bearing animals display impaired capabilities to maintain cellular morphology and structure, which will ultimately lead to impaired motor function. We also see a large increase in pathways associated with DNA maintenance, transcription, and translation, namely: histone acetylation, chromatin assembly and disassembly, translation, RNA splicing, DNA repair, and intracellular protein transport. Thus the cell’s ability to encode and provide functional protein becomes diminished. Interestingly, recent literature searches for many of these pathways in maintenance of cell morphology and DNA maintenance/transcription reveals few investigations in cachexia or other muscle-wasting diseases targeting these processes. However, their roles in maintenance of muscle health in the development of CC may not be understated.
Specifically, we take note of the alteration within the DNA methylation pathway. Within the current study, 50% of genes noted in this pathway were altered to some degree (10 of 20). More intriguingly, while some evidence has begun to shed light on the role of DNA methylation and epigenetics in the regulation of muscle size and in the development of muscle atrophy, prior literature in cancer-induced muscle wasting is very minimal. This pathway could be of significant importance in the development of CC not only as a potential mechanism in the development of CC but also for a potential role in rehabilitative medicine in the recovery from CC. Specifically, DNA methylations are known to be lasting and often studied as being passed from generation to generation. Furthermore, the influence of DNA methylation on the transcription of the methylated genes mediates altered potential expression of the gene products at mRNA and eventual protein levels. Therefore, it is possible, if not likely, that alterations to the DNA methylation pathway now noted in the current study may impair muscle regrowth potential during rehabilitation from cancer and CC. This speculation requires further investigation to determine if alterations to the DNA methylation pathway noted here lead to epigenetic modulations of the DNA and altered expression of the gene products. Such a finding may be critical in the development of both preventive and rehabilitative measures in CC. Therefore, in conjunction with classic pathways altered in the wasting condition of CC, we see alterations in many additional pathways in cachectic muscle, pathways critical for maintenance of total cellular health. Interestingly, many of these pathway alterations are distinct from prior observations in C26-induced CC (6), suggesting distinct mechanisms of tumor-induced muscle wasting in these two forms of cancer.
Next, considering our prior work demonstrating functional mitochondrial degeneration early in development of CC, it is most interesting that many pathways involved in oxidative metabolism were identified in the current analyses. Identified pathways in oxidative metabolism include: ATP synthesis-coupled electron transport, oxidative phosphorylation, mitochondrial dysfunction, and mitochondrial organization. In addition to these specific aspects of mitochondrial energy metabolism we note impacts in signaling through AMPK and PPARα, suggesting the impacts go to both direct functional components as well as mitochondrial regulatory pathways. Furthermore, based on our comparison of DE genes with the MitoCarta, as much as 20–30% of identified mitochondrial genes are altered in muscles of cachectic mice (4 wk LLC), while mitochondrial genes account for almost 18% of all DE genes in these mice. In fact, these alterations in mitochondrial genes span all four respiratory complexes of the electron transport system along with complex V/ATP synthase. That so many of the affected genes and pathways identified are vital either to direct mitochondrial quality or to the regulation therein is consistent with our recent findings of early-onset functional mitochondrial degenerations in these animals (7). However, it is interesting to note that these signaling alterations follow the previously reported functional changes in muscle mitochondria, a phenomenon that requires additional study but may suggest the utility of functional measures of muscle health over biomarker searches to identify cachexia susceptibility. These combined findings are strongly indicative of a critical role for mitochondrial maintenance in development of muscle atrophy in CC.
Finally, to provide insight into the means by which identified DE genes were altered in progression of CC, we performed transcription factor analyses to identify likely regulations of these genes. Interestingly, we identified transcription factors commonly associated with processes such as myogenesis, tumor necrotic factors, sterol biosynthesis, immunosuppression, and angiogenesis (Fig. 7). The alterations in these potential transcription factors, combined with the large quantity of DE genes over the course of CC progression, further support the notion that the tumor is systemically breaking down essential functions within the animal.
We are the first to examine the transcriptomic alterations in muscle of tumor-bearing mice across the time-course development of muscle wasting in LLC tumor-bearing mice. Importantly, we note that the largest difference in expression was observed when we compared week 4 LLC animals, when the muscle-wasting phenotype has developed, with all other conditions, suggesting that large transcriptomic alterations occur concomitantly with the onset of muscle wasting. Combined with our prior work (7) the current work shows that alterations in the muscle belly likely occur in phases, beginning with early functional mitochondrial degenerations, which now appear to lead to large transcriptomic shifts concurrent with the onset of muscle atrophy. We should note then that the handful of altered genes in early stages following tumor implantation may provide a great opportunity to develop further mechanistic understanding of the etiology of muscle wasting in CC. Finally, in agreement with our prior work (7), we observed multiple aspects related to degeneration of mitochondria and oxidative metabolism. We do provide as delimitations to the current study that outcomes are limited to the LLC implantation preclinical model of CC and thus should be further tested in additional model systems and that current data are limited to occurrences in male mice. Future work from our group is intended to investigate these occurrences in additional model systems and in female mice. Finally as delimitation, we have chosen a single control condition (PBS age-matched to 4 wk tumor bearing) to provide the best insight to phenotypic muscle wasting at this longest time point. Data presented herein provide evidence for alterations within skeletal muscle in the tumor-bearing state as muscle wasting develops and also provide new insights that may be used in development of more mechanistic work to define nodal points critical to muscle loss in the tumor-bearing state.
GRANTS
Support for these experiments has been provided in part by the Arkansas Biosciences Institute, the major research component of the Arkansas Tobacco Settlement Proceeds Act of 2000 (N. P. Greene) and by the National Institutes of Health under Award Number R15AR-069913 Funding support for author J. L. Ruas was from Swedish Research Council and Novo Nordisk Foundation. Author J. L. Brown received support from the Cell and Molecular Biology Graduate Program of the University of Arkansas.
DISCLOSURES
No conflicts of interest, financial or otherwise, are declared by the authors.
AUTHOR CONTRIBUTIONS
T.A.B., J.L.B., M.E.R.-C., D.E.L., L.A.B., W.S.H., M.P.W., and N.P.G. performed experiments; T.A.B., I.C., B.K., J.L.B., M.E.R.-C., D.E.L., R.A.P., W.G.B., T.A.W., and N.P.G. analyzed data; T.A.B., I.C., B.K., J.L.B., D.E.L., R.A.P., W.G.B., B.C.K., and N.P.G. interpreted results of experiments; T.A.B., B.C.K., and N.P.G. prepared figures; T.A.B., J.L.B., M.E.R.-C., and N.P.G. drafted manuscript; T.A.B., I.C., B.K., J.L.B., M.E.R.-C., D.E.L., R.A.P., L.A.B., W.S.H., M.P.W., W.G.B., T.A.W., B.C.K., J.L.R., and N.P.G. edited and revised manuscript; T.A.B., I.C., B.K., J.L.B., M.E.R.-C., D.E.L., R.A.P., L.A.B., W.S.H., M.P.W., W.G.B., T.A.W., B.C.K., J.L.R., and N.P.G. approved final version of manuscript; N.P.G. conceived and designed research.
ACKNOWLEDGMENTS
The authors thank Kevin B. Greene for assistance with this project. We also extend our gratitude to the numerous faculty, staff, and students of the Exercise Science Research Center at the University of Arkansas.
REFERENCES
- 1.Nutrition in Cancer Care (PDQ)-Health Professional Version. National Cancer Institute https://www.cancer.gov/about-cancer/treatment/side-effects/appetite-loss/nutrition-hp-pdq 2016. [PubMed]
- 2.Anders S, Huber W. Differential expression analysis for sequence count data. Genome Biol 11: R106, 2010. doi: 10.1186/gb-2010-11-10-r106. [DOI] [PMC free article] [PubMed] [Google Scholar]
- 3.Au ED, Desai AP, Koniaris LG, Zimmers TA. The MEK-Inhibitor Selumetinib Attenuates Tumor Growth and Reduces IL-6 Expression but Does Not Protect against Muscle Wasting in Lewis Lung Cancer Cachexia. Front Physiol 7: 682, 2017. doi: 10.3389/fphys.2016.00682. [DOI] [PMC free article] [PubMed] [Google Scholar]
- 4.Aversa Z, Pin F, Lucia S, Penna F, Verzaro R, Fazi M, Colasante G, Tirone A, Rossi Fanelli F, Ramaccini C, Costelli P, Muscaritoli M. Autophagy is induced in the skeletal muscle of cachectic cancer patients. Sci Rep 6: 30340, 2016. doi: 10.1038/srep30340. [DOI] [PMC free article] [PubMed] [Google Scholar]
- 5.Belizário JE, Fontes-Oliveira CC, Borges JP, Kashiabara JA, Vannier E. Skeletal muscle wasting and renewal: a pivotal role of myokine IL-6. Springerplus 5: 619, 2016. doi: 10.1186/s40064-016-2197-2. [DOI] [PMC free article] [PubMed] [Google Scholar]
- 6.Bonetto A, Aydogdu T, Kunzevitzky N, Guttridge DC, Khuri S, Koniaris LG, Zimmers TA. STAT3 activation in skeletal muscle links muscle wasting and the acute phase response in cancer cachexia. PLoS One 6: e22538, 2011. doi: 10.1371/journal.pone.0022538. [DOI] [PMC free article] [PubMed] [Google Scholar]
- 7.Brown JL, Rosa-Caldwell ME, Lee DE, Blackwell TA, Brown LA, Perry RA, Haynie WS, Hardee JP, Carson JA, Wiggs MP, Washington TA, Greene NP. Mitochondrial degeneration precedes the development of muscle atrophy in progression of cancer cachexia in tumour-bearing mice. J Cachexia Sarcopenia Muscle 8: 926–938, 2017. doi: 10.1002/jcsm.12232. [DOI] [PMC free article] [PubMed] [Google Scholar]
- 8.Calvo SE, Clauser KR, Mootha VK. MitoCarta2.0: an updated inventory of mammalian mitochondrial proteins. Nucleic Acids Res 44, D1: D1251–D1257, 2016. doi: 10.1093/nar/gkv1003. [DOI] [PMC free article] [PubMed] [Google Scholar]
- 9.Carbon S, Ireland A, Mungall CJ, Shu S, Marshall B, Lewis S; AmiGO Hub; Web Presence Working Group . AmiGO: online access to ontology and annotation data. Bioinformatics 25: 288–289, 2009. doi: 10.1093/bioinformatics/btn615. [DOI] [PMC free article] [PubMed] [Google Scholar]
- 10.Centers for Disease Control and Prevention. Behavioral Risk Factor Surveillance System Survey Data. Atlanta, Georgia: U.S. Department of Health and Human Services, Centers for Disease Control and Prevention 2007 https://www.cdc.gov/brfss/data_documentation/index.htm.
- 11.Del Fabbro E, Dalal S, Bruera E. Symptom control in palliative care–Part II: cachexia/anorexia and fatigue. J Palliat Med 9: 409–421, 2006. doi: 10.1089/jpm.2006.9.409. [DOI] [PubMed] [Google Scholar]
- 12.Fearon K. Cachexia: Treat wasting illness on multiple fronts. Nature 529: 156, 2016. doi: 10.1038/529156b. [DOI] [PubMed] [Google Scholar]
- 13.Fearon K, Strasser F, Anker SD, Bosaeus I, Bruera E, Fainsinger RL, Jatoi A, Loprinzi C, MacDonald N, Mantovani G, Davis M, Muscaritoli M, Ottery F, Radbruch L, Ravasco P, Walsh D, Wilcock A, Kaasa S, Baracos VE. Definition and classification of cancer cachexia: an international consensus. Lancet Oncol 12: 489–495, 2011. doi: 10.1016/S1470-2045(10)70218-7. [DOI] [PubMed] [Google Scholar]
- 14.Gallagher IJ, Jacobi C, Tardif N, Rooyackers O, Fearon K. Omics/systems biology and cancer cachexia. Semin Cell Dev Biol 54: 92–103, 2016. doi: 10.1016/j.semcdb.2015.12.022. [DOI] [PubMed] [Google Scholar]
- 15.Kubo Y, Naito T, Mori K, Osawa G, Aruga E. Skeletal muscle loss and prognosis of breast cancer patients. Support Care Cancer 25: 2221–2227, 2017. doi: 10.1007/s00520-017-3628-5. [DOI] [PubMed] [Google Scholar]
- 16.Lee DE, Brown JL, Rosa ME, Brown LA, Perry RA Jr, Wiggs MP, Nilsson MI, Crouse SF, Fluckey JD, Washington TA, Greene NP. microRNA-16 Is Downregulated During Insulin Resistance and Controls Skeletal Muscle Protein Accretion. J Cell Biochem 117: 1775–1787, 2016. doi: 10.1002/jcb.25476. [DOI] [PubMed] [Google Scholar]
- 17.Lee DE, Brown JL, Rosa-Caldwell ME, Blackwell TA, Perry RA Jr, Brown LA, Khatri B, Seo D, Bottje WG, Washington TA, Wiggs MP, Kong B-W, Greene NP. Cancer cachexia-induced muscle atrophy: evidence for alterations in microRNAs important for muscle size. Physiol Genomics 49: 253–260, 2017. doi: 10.1152/physiolgenomics.00006.2017. [DOI] [PubMed] [Google Scholar]
- 18.Lex A, Gehlenborg N, Strobelt H, Vuillemot R, Pfister H. UpSet: Visualization of Intersecting Sets. IEEE Trans Vis Comput Graph 20: 1983–1992, 2014. doi: 10.1109/TVCG.2014.2346248. [DOI] [PMC free article] [PubMed] [Google Scholar]
- 19.Love MI, Huber W, Anders S. Moderated estimation of fold change and dispersion for RNA-seq data with DESeq2. Genome Biol 15: 550, 2014. doi: 10.1186/s13059-014-0550-8. [DOI] [PMC free article] [PubMed] [Google Scholar]
- 20.Miyamoto Y, Hanna DL, Zhang W, Baba H, Lenz HJ. Molecular Pathways: Cachexia Signaling-A Targeted Approach to Cancer Treatment. Clin Cancer Res 22: 3999–4004, 2016. doi: 10.1158/1078-0432.CCR-16-0495. [DOI] [PMC free article] [PubMed] [Google Scholar]
- 21.Muscaritoli M, Rossi Fanelli F, Molfino A. Perspectives of health care professionals on cancer cachexia: results from three global surveys. Ann Oncol 27: 2230–2236, 2016. doi: 10.1093/annonc/mdw420. [DOI] [PMC free article] [PubMed] [Google Scholar]
- 22.Orell-Kotikangas H, Österlund P, Mäkitie O, Saarilahti K, Ravasco P, Schwab U, Mäkitie AA. Cachexia at diagnosis is associated with poor survival in head and neck cancer patients. Acta Otolaryngol 137: 778–785, 2017. doi: 10.1080/00016489.2016.1277263. [DOI] [PubMed] [Google Scholar]
- 23.Pertea M, Kim D, Pertea GM, Leek JT, Salzberg SL. Transcript-level expression analysis of RNA-seq experiments with HISAT, StringTie and Ballgown. Nat Protoc 11: 1650–1667, 2016. doi: 10.1038/nprot.2016.095. [DOI] [PMC free article] [PubMed] [Google Scholar]
- 24.Prado CMM, Baracos VE, McCargar LJ, Reiman T, Mourtzakis M, Tonkin K, Mackey JR, Koski S, Pituskin E, Sawyer MB. Sarcopenia as a determinant of chemotherapy toxicity and time to tumor progression in metastatic breast cancer patients receiving capecitabine treatment. Clin Cancer Res 15: 2920–2926, 2009. doi: 10.1158/1078-0432.CCR-08-2242. [DOI] [PubMed] [Google Scholar]
- 25.Puppa MJ, Gao S, Narsale AA, Carson JA. Skeletal muscle glycoprotein 130’s role in Lewis lung carcinoma-induced cachexia. FASEB J 28: 998–1009, 2014. doi: 10.1096/fj.13-240580. [DOI] [PMC free article] [PubMed] [Google Scholar]
- 26.Puppa MJ, White JP, Sato S, Cairns M, Baynes JW, Carson JA. Gut barrier dysfunction in the Apc(Min/+) mouse model of colon cancer cachexia. Biochim Biophys Acta 1812: 1601–1606, 2011. doi: 10.1016/j.bbadis.2011.08.010. [DOI] [PMC free article] [PubMed] [Google Scholar]
- 27.Sun R, Zhang S, Lu X, Hu W, Lou N, Zhao Y, Zhou J, Zhang X, Yang H. Comparative molecular analysis of early and late cancer cachexia-induced muscle wasting in mouse models. Oncol Rep 36: 3291–3302, 2016. doi: 10.3892/or.2016.5165. [DOI] [PubMed] [Google Scholar]
- 28.Suzuki H, Asakawa A, Amitani H, Nakamura N, Inui A. Cancer cachexia–pathophysiology and management. J Gastroenterol 48: 574–594, 2013. doi: 10.1007/s00535-013-0787-0. [DOI] [PMC free article] [PubMed] [Google Scholar]
- 29.Tisdale MJ. The ubiquitin-proteasome pathway as a therapeutic target for muscle wasting. J Support Oncol 3: 209–217, 2005. [PubMed] [Google Scholar]


