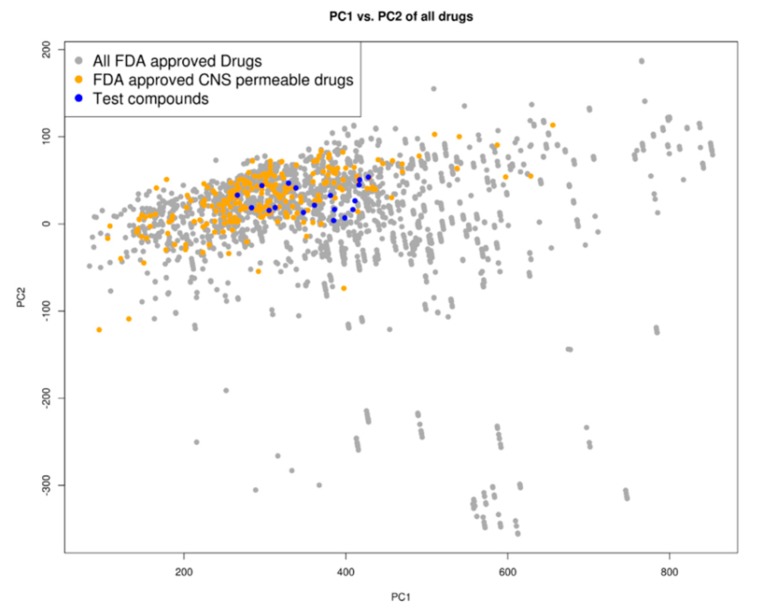
Figure 3.
Chemical space distribution of the test compounds (n = 18), Food and Drug Administration (FDA)-approved drugs (n = 3180), and FDA-approved central nervous system (CNS)-permeable drugs (n = 221). The principal component analysis (PCA) of the molecular descriptors showed that the test compounds clustered well with FDA-approved CNS-permeable drugs. The PCA scatter plot was based on the first (PC1) and second (PC2) components as shown on the two axes. PC1 explained 76% of the variance while PC2 explained 18%. All FDA-approved drugs are shown as grey dots, while FDA-approved CNS-permeable drugs are shown as yellow dots and the test compounds are shown as blue dots.

