Abstract
Trichloroethylene (TCE)-induced liver toxicity and carcinogenesis is believed to be mediated in part by activation of the peroxisome proliferator-activated receptor α (PPARα). However, the contribution of the two TCE metabolites, dichloroacetate (DCA) and trichloroacetate (TCA) to the toxicity of TCE, remains unclear. The aim of the present study was to determine the metabolite profiles in serum and urine upon exposure of mice to TCE, to aid in determining the metabolic response to TCE exposure and the contribution of DCA and TCA to TCE toxicity. C57BL/6 mice were administered TCE, TCA, or DCA, and urine and serum subjected to ultra-performance liquid chromatography coupled with electrospray ionization quadrupole time-of-flight mass spectrometry (UPLC-ESI-QTOFMS)-based global metabolomics analysis. The ions were identified through searching metabolomics databases and by comparison with authentic standards, and quantitated using multiple reactions monitoring. Quantitative polymerase chain reaction of mRNA, biochemical analysis, and liver histology were also performed. TCE exposure resulted in a decrease in urine of metabolites involved in fatty acid metabolism, resulting from altered expression of PPARα target genes. TCE treatment also induced altered phospholipid homeostasis in serum, as revealed by increased serum lysophosphatidylcholine 18:0 and 18:1, and phosphatidylcholine metabolites. TCA administration revealed similar metabolite profiles in urine and serum upon TCE exposure, which correlated with a more robust induction of PPARα target gene expression associated with TCA than DCA treatment. These data show the metabolic response to TCE exposure and demonstrate that TCA is the major contributor to TCE-induced metabolite alterations observed in urine and serum.
Keywords: Trichloroethylene, Dichloroacetate, Trichloroacetate, PPARα, Metabolomics, Toxicity
Introduction
The chlorinated solvent trichloroethylene (TCE) has been widely used for degreasing metals and in garment dry cleaning (Bakke et al. 2007) and has become a major environmental contaminant in soil, air, and water (Candura and Faustman 1991). It was estimated that over 3.5 million people have been occupationally exposed to TCE, and the exposure to TCE appears to be causally associated with the occurrence of several types of cancer in humans, including renal cell carcinoma, non-Hodgkin’s lymphoma, hepatobiliary cancers, and esophageal adenocarcinoma (Wartenberg et al. 2000; Pesch et al. 2000). TCE was evaluated as a probable carcinogen by the International Agency for Research on Cancer (IARC 1995). Additionally, exposure to TCE can result in other severe adverse health effects, including damage to liver, kidney, and the immune system (Byers et al. 1988; Bull 2000; Wartenberg et al. 2000). To date, the molecular mechanisms underlying TCE-induced toxicity remain unclear.
Trichloroethylene-induced liver toxicity and carcinogenesis in mice is believed mediated in part by activation of the peroxisome proliferator-activated receptor α (PPARα) (Keshava and Caldwell 2006). TCE is mainly metabolized by cytochromes P450 to two metabolites, dichloroacetate (DCA) and trichloroacetate (TCA) (Kim and Ghanayem 2006, Ramdhan et al. 2008). In vitro experiments revealed that TCA and DCA, but not TCE itself, can activate PPARα (Zhou and Waxman 1998). Exposure to TCE, TCA, or DCA can induce numerous effects in common with peroxisome proliferator chemicals, such as increased liver weight, hepatocyte proliferation, and markers of peroxisome proliferation (Maronpot et al. 1995). Activation of PPARα target genes is largely abolished in Ppara-null mice treated with these chemicals (Nakajima et al. 2000).
Various “omics” technologies including transcriptomics and proteomics have been employed to aid in elucidating the mechanisms of TCE toxicity. Transcript profiling using microarrays containing approximately 1,200 genes showed that the expression of many PPARα target genes changed in mouse liver after the exposure of TCE (Laughter et al. 2004). Others investigated the alteration in protein expression after human L-02 liver cells were exposed to varying concentrations of TCE and identified ten differential protein spots (Liu et al. 2007). Additionally, TCE can induce the alterations in the expression of, distribution of, and interactions between SET/TAF-Ia and two SET/TAF-Ia-binding proteins, eEF1A1 and eEF1A2 (Hong et al. 2012). Proteomic analysis of TCE-induced changes in rat liver proteins showed that eight liver proteins exhibited at least a twofold alteration in expression level, including three upregulated and five downregulated proteins (Park et al. 2010). However, changes in the production of metabolites by TCE exposure have not been determined.
Metabolomics can play an important role in determining the mechanisms of action of toxicants through unbiased global analysis of all the low-molecular-weight molecules or metabolites in a biofluid, cell, tissue, organ, or organism. Nuclear magnetic resonance (NMR)-based and mass spectrometry (MS)-based metabolomics technologies have been widely applied in numerous studies, such as elucidation of disease mechanisms, identification of mechanisms of drug efficacy and toxicity, and discovery of new targets and biomarkers (Johnson and Gonzalez 2011). One metabolomic study evaluated the toxic actions of TCE toward embryogenesis using 1H-NMR (Viant et al. 2005).
The aim of the present study was to evaluate the urine and serum metabolomic alterations in mice after the exposure to TCE and its two metabolites DCA and TCA using ultra-performance chromatography electrospray ionization quadrupole time-of-flight mass spectrometry (UPLC-ESI-QTOFMS)-based metabolomics and to determine the metabolic alterations that result from TCE exposure that might aid in understanding the mechanism of TCE toxicity. Additionally, the contribution of TCA and DCA to TCE-induced metabolite alterations was also determined.
Materials and methods
Chemicals
Trichloroethylene (purity ≥99.5), sodium dichloroacetate (purity 98 %), and sodium trichloroacetate (purity 97 %) were purchased from Sigma-Aldrich (St. Louis, MO). Hexanoylglycine, phenylpropionylglycine, and phenylacetylglycine were obtained from the Metabolic Laboratory, Vrije Universiteit Medical Center (Amsterdam, the Netherlands). 1-Oleoyl-2-hydroxy-sn-glycero-3-phosphocholine (LPC 18:1, 9Z), 1-heptadecanoyl-sn-glycero-3-phosphocholine (LPC 17:0), and 1-stearoyl-sn-glycero-3-phosphocholine (LPC 18:0) were purchased from Avanti Polar Lipids, Inc. (Alabaster, AL). Pantothenic acid, carnitine, acetylcarnitine, hippuric acid, creatinine hydrochloride, and cinnamoylglycine were purchased from Sigma-Aldrich (St. Louis, MO). All other reagents and solvents were of HPLC grade.
Animals and treatments
Male C57BL/6 mice (6–8 weeks old) were used in the present study. All animal experiments were conducted in accordance with animal study protocols approved by the National Cancer Institute Animal Care and Use Committee under Association for the Assessment and Accreditation of Laboratory Animal Care (AAALAC) guidelines. The mice were maintained under a standard 12-h light:12-h dark cycle with water and chow provided ad libitum. For investigation of TCE-induced metabolomics changes, mice were given TCE at 800 or 1,600 mg/kg body weight per day by oral gavage as previously described (Griffin et al. 2000; Ramdhan et al. 2010). TCE was suspended in corn oil, and the control groups given an equal volume of corn oil. For the DCA and TCA studies, DCA and TCA were administered in the drinking water at 1–5 g/L, respectively (Corton 2008). These two compounds were reported to be stable in solution under these conditions over the time periods of the present experiments (Laughter et al. 2004). For each treatment group, five mice were used. The day 0, 1, 2, 3, and 7 urines of TCE-treated mice and day 0, 1, 2, and 7 urines of DCA- and TCA-treated mice were collected using metabolic cages (Metabowls, Jencons Scientific USA, Bridgeville, PA). Throughout the study period, each mouse was observed for body weight changes, and all cages were checked in the morning and afternoon for moribund animals that were immediately killed. The blood samples (day 7) were collected in BD Microtainer™ serum separator tubes (Franklin Lakes, NJ) by retro-orbital bleeding. Serum was obtained through centrifugation for 15 min at 8,000×g. The livers were then excised and immediately weighed. A small liver section was excised from the median lobe of each mouse and fixed in 10 % neutral buffered formalin.
Histopathology analysis
The histopathology analysis was carried out as previously described (Ramdhan et al. 2010). Tissue blocks were embedded in paraffin and cut into 4-μm-thick sections. The sections were stained by the hematoxylin and eosin method.
Biochemical analysis
The catalytic activities of aspartate aminotransferase (AST) and alanine transaminase (ALT) in serum were determined using Catachem VetSpec™ Kit (Catachem Inc, Bridgeport, CT) in accordance with the manufacturer’s instruction. Briefly, 1 μL serum was mixed with 200 μL ALT or AST assay buffer (Catachem, Bridgeport, CT) in a 96-well microplate, and the oxidation of NADH to NAD+ was monitored at 340 nm for 5 min. Alkaline phosphatase (ALP) analysis was performed to monitor the catalytic conversion of p-nitrophenyl phosphate (PNPP) to p-nitrophenol at 414 nm using Catachem VetSpec™ Kit (Catachem, Bridgeport, CT). Hepatic triglyceride (TG) contents were determined as described elsewhere (Tanaka et al. 2008).
Quantitative polymerase chain reaction (qPCR) analysis
TRIzol reagent (Invitrogen, Carlsbad, CA) was used to extract the total liver RNA, and cDNA generated from 1 μg RNA with a SuperScript II™ Reverse Transcriptase kit and random oligonucleotides (Invitrogen, Grand Island, NY). Quantitative PCR (qPCR) was performed using SYBR green PCR master mix and ABI Prism 7900HT Sequence Detection System (Applied Biosystems, Foster City, CA). The primer pairs were designed using qPrimerDepot and listed in Supplementary Table 1. Messenger RNA quantitation was performed using the comparative cycle threshold (CT) method, and results were normalized to mouse β-actin.
UPLC-ESI-QTOFMS analysis of serum and urine samples
Serum samples were prepared through mixing 10 μL serum with 190 μL 66 % aqueous acetonitrile containing 5 μM chlorpropamide. Urine samples were prepared by mixing 20 μL urine with 180 μL 50 % aqueous acetonitrile containing 5 μM chlorpropamide. After 14,000×g centrifugation for 20 min, a 5-μL aliquot of the supernatants was injected into a Waters UPLC-ESI-QTOFMS system (Waters Corporation, Milford, MA) for analysis. The separation of serum and urinary components was performed using an Acquity UPLC BEH C18 column (1.7 μm, 2.1 × 50 mm, Waters Corp.). The mobile phase was comprised of 0.1 % aqueous formic acid (A) and acetonitrile containing 0.1 % formic acid (B). For serum analysis, the running method was described in the previous study (Li et al. 2011a, b). For urine analysis, the following gradient elution was used: 2 % B for 0.5 min, 2–20 % B in 4 min, 20–95 % B in 8 min, 95–99 % B in 8.1 min, holding at 99 % B up to 9.0 min, bringing back to 2 % at 9.1 min, and holding at 2 % until the end of the run. The flow rate was 0.5 ml/min, and the column temperature was maintained at 40 °C through the run. The positive mode (ESI+) was used, and the capillary and cone voltages were maintained at 3 kV and 20 V, respectively. Source and desolvation temperatures were set at 120 and 350 °C, respectively. Nitrogen was used as both cone gas (50 L/h) and desolvation gas (600 L/h), and argon was used as collision gas. Collision energy ranging from 10 to 40 eV was applied for MS/MS fragmentation of target ions.
Multivariate data analysis
MassLynx software (Waters Corp.) was used to acquire the chromatogram and mass spectrometric data in centroid format. After the generation of a multivariate data matrix, the data set was exported into SIMCA-P+12.0 (Umetrics, Kinnelon, NJ) for further analysis, as previously described (Li et al. 2012).
Identification and quantitation of metabolites in urine and serum
Metabolomics databases (Madison Metabolomics Consortium Database and METLIN) were searched to identify the structure of high-contribution score metabolites. Seven Golden Rules (Kind and Fiehn 2007) were employed to calculate the mass error based on the elemental compositions of each metabolite. Five to 20 μM authentic standards were compared with the urine and serum samples, including comparison of fragmentation patterns and retention times. The metabolites in urine and serum were quantified using an ACQUITY UPLC system coupled with a XEVO triple-quadrupole tandem mass spectrometer (Waters). Multiple reaction monitoring method was employed to quantify the identified metabolites using the following transitions: creatinine (114 → 86; ESI+), carnitine (162 → 60; ESI+), pantothenic acid (220 → 90; ESI+), acetylcarnitine (204 → 85; ESI+), phenylpropionylglycine (208 → 105; ESI+), hexanoylglycine (174 → 76; ESI+), phenylacetylglycine (192 → 74; ESI−), hippuric acid (178 → 134; ESI−), cinnamolyglycine (206 → 131; ESI+), chlorpropamide (277 → 111; ESI+), LPC (18:1, 9Z) (522 → 184; ESI+), LPC(18:0) (524 → 184; ESI+), and LPC(17:0) (510 → 184; ESI+). Chlorpropamide (0.5 μM) was utilized as the internal standard for urine analysis, and 0.5 μM of LPC (17:0) was employed as the internal standard for serum analysis. The concentrations were calculated using fitted standard curve using authentic standards.
Statistical analysis
The data were given as mean ± standard error of mean (SEM). Statistical analysis was carried out using two-tailed Student’s t test, and a p value of <0.05 was considered as statistically significant.
Results
Treatment with TCE and its metabolites DCA and TCA, significantly induced hepatomegaly
No significant differences in body weight and food intake were observed between the control group and TCE-treated groups (Supplemental Fig. 1). No deaths occurred in any of the treatment groups during the experimental periods. TCE at 800 and 1,600 mg/kg/day for 7 days induced 26 % (p < 0.01) and 41 % (p < 0.001) elevation in liver to body weight ratios, respectively (Fig. 1). The liver to body weight ratios increased by 50 % (p < 0.001) and 21 % (p < 0.001) in DCA- and TCA-treated mice, respectively. Treatment with 800 mg/kg/day TCE also significantly increased ALT and AST activities; administration of a higher dose for 7 days (1,600 mg/kg/day) also tended to increase serum ALT and AST activities, although not statistically significantly. ALP activity in serum and the level of TG in liver were not significantly affected by TCE administration (Supplemental Fig. 2). Treatment with DCA did not significantly increase the ALT, AST, and ALP activities but slightly elevated TG levels in liver (Supplemental Fig. 3). Treatment with TCA did not alter ALT, AST, and ALP activities in serum and TG levels in liver (Supplemental Fig. 4). Histopathological analysis using hematoxylin and eosin staining of liver sections (Supplemental Figs. 5, 6) further showed hepatocyte hypertrophy after treatment with TCE, DCA, and TCA. Very mild focal inflammation was detected in TCE-treated mice (Supplemental Fig. 5). However, obvious steatosis, hepatocyte necrosis, and cholestasis were not observed.
Fig. 1.
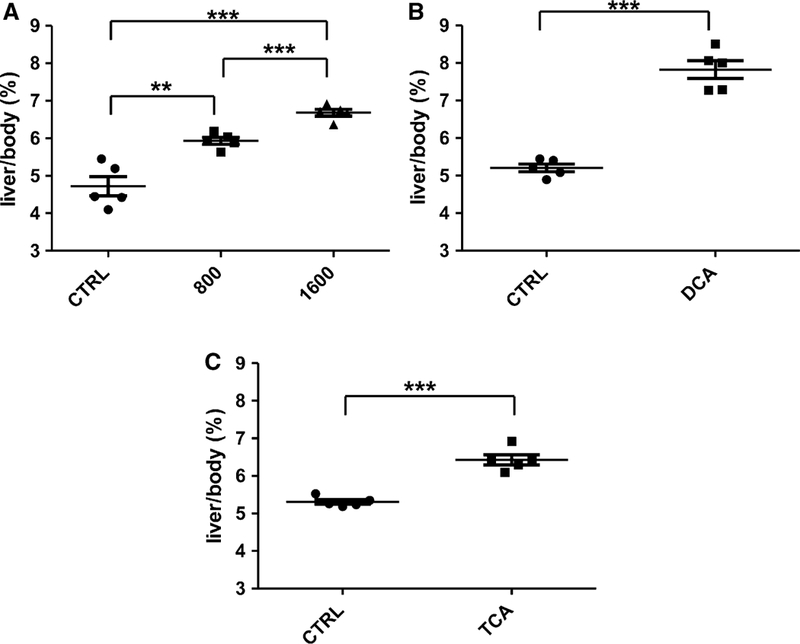
Influence of TCE (a), DCA (b), and TCA (c) on liver/ body weight ratios. Five mice were given 800 or 1,600 mg/kg body weight per day by oral gavage. For the DCA and TCA study, mice were administered DCA and TCA at 4 g/L in the drinking water for 7 days.*p < 0.05, **p < 0.01, ***p < 0.001
TCE exposure induced alteration in fatty acid metabolism-associated metabolites in urine and phospholipid homeostasis in serum
UPLC-ESI-QTOFMS analysis coupled with MDA was employed to profile the urinary metabolome. Unsupervised principal components analysis (PCA) of the urine from the treated (800 and 1,600 mg/kg/day) and untreated C57BL/6 mice revealed that they were not separated at 0 day treatment and separated well after 3 days of treatment (Fig. 2a, b). PCA of the seven-day serum can also separate the control group and TCE-treated groups (800 and 1,600 mg/kg/day) (Fig. 2c). Furthermore, the supervised PLS-DA model could clearly separate the control group, 800 mg/kg/day and 1,600 mg/kg/day-treated groups (Fig. 2d).
Fig. 2.
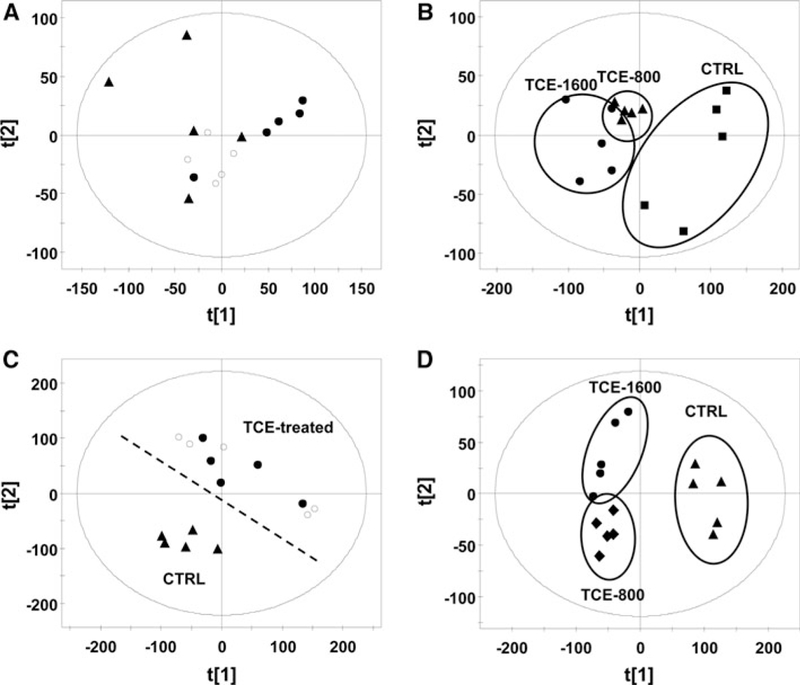
Metabolomic analysis of urine and serum in vehicle- and TCE-treated mice at 800 and 1,600 mg/kg/day doses of TCE. a PCA scores scatter plot for urine of control mice (filled triangle) and TCE-treated mice at 800 mg/kg/day (filled circle) and 1,600 mg/kg/day (open circle) dose at 0 day. b PCA scores scatter plot for urine of control mice and TCE-treated mice at 800 mg/kg/day (filled triangle) and 1,600 mg/kg/day (filled circle) doses at 3 day. c PCA scores scatter plot for serum of control mice (filled triangle) and TCE-treated mice at 800 mg/kg/day (open circle) and 1,600 mg/kg/day (filled circle) dose at 7 day. d PLS-DA scores scatter plot for serum of control mice (filled triangle) and TCE-treated mice at 800 mg/kg/ day (filled diamond) and 1,600 mg/kg/day (filled circle) dose at 7 day
Examination of the contribution table by SIMCA-P software revealed that 19 major ions (P1-P19) and seven major ions (P20-P27) contributed to the separation between the groups for urine and serum, respectively (Table 1). Through mass-based searches of a metabolomics database (Madison Metabolomics Consortium Database) and comparison of the retention times and MS/MS fragmentation patterns between the standard and the urine or serum samples, the altered ions were identified as hippuric acid, cinnamoylglycine, phenylacetylglycine, hexanoyl-glycine, phenylpropionylglycine, pantothenic acid, carnitine, acetylcarnitine, LPC (18:1, 9Z), and LPC (18:0) (Supplement Fig. 7A-J). Through searching the meta-bolomics database only, the five ions, 810.604 (8.40 min), 834.605 (8.29 min), 760.588 (8.47 min), 784.589 (8.2), and 808.589 (8.04), were determined to be likely PC derivatives.
Table 1.
List of ions changed in urine and serum obtained from TCE-treated mice
| Marker | RT (min) | m/z | Trend | Identity |
|---|---|---|---|---|
| Urine | ||||
| P1 | 2.14 | 105.034 | Decrease | Fragment of hippuric acid |
| P2 | 3.81 | 131.050 | Decrease | Fragment of cinnamoylglycine |
| P3 | 2.14 | 180.066 | Decrease | Hippuric acid |
| P4 | 2.55 | 76.040 | Decrease | Fragment of phenylacetylglycine |
| P5 | 3.17 | 127.112 | Decrease | Not identified |
| P6 | 2.55 | 216.065 | Decrease | Sodium adduct of phenylacetylglycine |
| P7 | 1.75 | 144.085 | Decrease | Not identified |
| P8 | 1.36 | 220.118 | Decrease | Pantothenic acid |
| P9 | 3.2 | 226.145 | Decrease | Not identified |
| P10 | 2.55 | 91.0548 | Decrease | Fragment of phenylacetylglycine |
| P11 | 3.2 | 76.04 | Decrease | Fragment of hexanoylglycine |
| P12 | 3.2 | 174.113 | Decrease | Hexanoylglycine |
| P13 | 3.47 | 208.097 | Decrease | Phenylpropionylglycine |
| P14 | 3.47 | 105.070 | Decrease | Fragment of phenylpropionylglycine |
| P15 | 3.47 | 133.065 | Decrease | Fragment of phenylpropionylglycine |
| P16 | 1.36 | 202.108 | Decrease | Fragment of pantothenic acid |
| P17 | 1.36 | 90.0552 | Decrease | Fragment of pantothenic acid |
| P18 | 0.30 | 162.112 | Decrease | Carnitine |
| P19 | 0.33 | 204.128 | Decrease | Acetylcarnitine |
| Serum | ||||
| P20 | 4.86 | 522.356 | Increase | LPC(18:1, 9Z) |
| P21 | 5.33 | 524.372 | Increase | LPC(18:0) |
| P23 | 8.40 | 810.604 | Increase | PC component |
| P24 | 8.29 | 834.605 | Increase | PC component |
| P25 | 8.47 | 760.588 | Increase | PC component |
| P26 | 8.20 | 784.589 | Increase | PC component |
| P27 | 8.04 | 808.589 | Increase | PC component |
Quantitation of metabolites in urine and serum of TCE- treated mice
All identified metabolites in urine listed in Table 1 were quantified by an ACQUITY UPLC system coupled with a XEVO triple-quadrupole tandem mass spectrometer using calibration with chlorpropamide as an internal standard, and the concentrations of metabolites normalized with the concentration of creatinine (Fig. 3). The reduced fold was defined as the value in control group-the value in treatment group)/the value in control group. The levels of carnitine began to decrease after treatment with TCE at 800 mg/kg/ day (1.4-fold, not significant) and 1,600 mg/kg/day (1.9-fold, p < 0.01) for 2 days. At day 3, exposure to 800 and 1.600 mg/kg/day induced 0.5-fold (p < 0.05) and twofold (p < 0.001) reduction in carnitine, respectively. At 7 days, 800 mg/kg/day and 1,600 mg/kg/day treatment induced 0.7-fold (not significant) and 0.9-fold (p < 0.05) reduction in carnitine, respectively. Compared with the control group, the levels of acetylcarnitine exhibited a significant decrease in the 800 mg/kg/day (3.1-fold, p < 0.05) and 1,600 mg/kg/day (3.5-fold, p < 0.01) groups after treatment for 2 days. At day 3, the decreased fold was increased to 3.8 (p < 0.01) and 7.0 (p < 0.01) for the 800 and 1,600 mg/kg/day-treated groups, respectively.
Fig. 3.
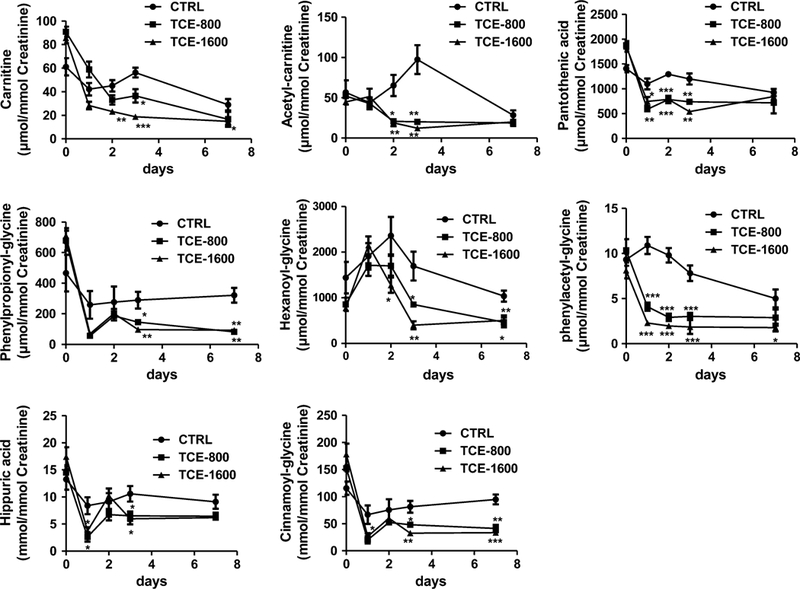
Quantitation of urinary excretion of carnitine, acetylcarnitine, pantothenic acid, phenylpropionylglycine, hexanoylglycine, pheny- lacetylglycine, hippuric acid, and cinnamoylglycine. The mice were exposed to TCE for 0, 1, 2, 3, and 7 days. The concentrations of each metabolite were calculated using standard curves of authentic compounds, and the data given as mean ± SEM (n = 5). *p < 0.05, **p < 0.01, ***p < 0.001
A significant decrease was detected in the level of pantothenic acid in the treatment groups relative to the control group, specifically 800 mg/kg/day-treated (1.9- fold, p < 0.01) and 1,600 mg/kg/day-treated (1.5-fold, p < 0.05) groups after an 1-day exposure. The level of pantothenic acid relative to the control group was decreased 1.7-fold (p < 0.001) and 1.6-fold (p < 0.001) for the 800 and 1,600 mg/kg/day-treated groups at 2-day exposure. Similarly, after 3 days, the decreases were 0.6 (p < 0.01) and 1.2-fold (p < 0.01) after treatment with TCE at 800 and 1,600 mg/kg/day.
The levels of hippuric acid showed significant difference between the control group and TCE-treated group at 1- and 3-day exposure. For the 800 mg/kg/day-treated group, the decrease was 2.2-fold (p < 0.05) and 0.6-fold (p < 0.05) after exposure for 1 and 3 days, respectively. For the 1,600 mg/kg/day-treated group, the decrease was 1.3-fold (p < 0.05) and 0.8-fold (p < 0.05) after exposure for 1 and 3 days, respectively. The levels of glycine conjugates (phenylpropionylglycine, hexanoylglycine, phenylacetyl-glycine, and cinnamoylglycine) also exhibited a decrease in the 800 and 1,600 mg/kg/day-treated group after exposure to TCE for 1 or 2 days, and the decreased trend remained at 3 and 7 days of exposure.
The alterations in LPC (18:1, 9Z) and LPC (18:0) in serum were quantified with authentic standards. The levels of LPC (18:1, 9Z) in the 800 and 1,600 mg/kg/day-treated group were 1.7-fold (p < 0.01) and 2.0-fold (p < 0.01), respectively, as compared to the control group (Fig. 4). Additionally, the levels of LPC(18:0) in the 800 and 1,600 mg/kg/day-treated groups were 1.6-fold (p < 0.001) and 1.6-fold (p < 0.01), respectively, as compared to the control group. The peak areas of PC components were calculated and compared (Supplementary Fig. 8). The levels of these components are higher in the TCE-treated groups than in the control group.
Fig. 4.
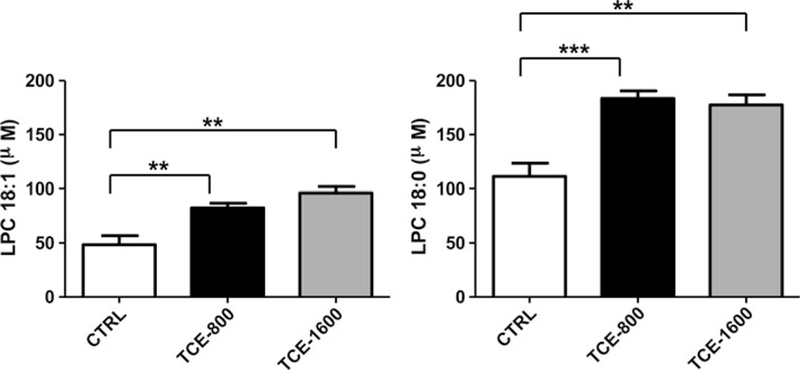
Quantitation of LPC(18:1,9Z) and LPC (18:0) in serum of the control group and TCE-treated group. Each group contained five mice, and the data given as mean ± SEM (n = 5). *p < 0.05, **p < 0.01, ***p < 0.001
Quantification of identified metabolites alteration in DCA- and TCA-treated mice
The presence of altered metabolites in the TCE-treated group was analyzed in DCA- and TCA-treated mice. In urine, among the eight changed metabolites in urine of TCE-treated mice, six metabolites were found to decrease in the TCA-treated groups, including carnitine, acetylcar-nitine, phenylpropionylglycine, hexanoylglycine, hippuric acid, and cinnamoylglycine. Four metabolites were decreased in the DCA-treated group, including acetylcar-nitine, phenylpropionylglycine, hexanoylglycine, and cin-namoylglycine (Fig. 5). The levels of carnitine in the control group were 2.1-fold (p < 0.01) that in the TCA- treated group after exposure to TCA for 7 days. In contrast, the level of carnitine in the DCA treatment group did not show significant changes at any time point. The level of acetylcarnitine in the control group was 3.5-fold (p < 0.01) and 3.6-fold (p < 0.001) that in the TCA-treated group at 2- and 7-day treatment, respectively. Treatment with DCA only induced a significant alteration (2.6-fold, p < 0.05) at 7-day exposure. For phenylpropionylglycine, a significant difference was observed after treatment with TCA for 1 day (2.5-fold, p < 0.01), 2 days (2.6-fold, p < 0.05), and 7 days (6.1-fold, p < 0.001). The level of phenylpropio- nylglycine in the control group was 1.8-fold that in the DCA-treated group after 7 days exposure. The level of hexanoylglycine in control group was 3.5-fold (p < 0.01) and 1.8-fold (p < 0.05) that in the TCA-treated group and DCA-treated group after 7-day treatment. Hippuric acid levels in the control group were 1.4-fold (p < 0.05) that in TCA-treated mice treated for 7 days. However, treatment with DCA did not induce significant alterations in hippuric acid at any time point. A significant difference was observed for cinnamoylglycine after treatment with TCA for 1 day (2.1-fold, p < 0.01), 2 days (2.0-fold, p < 0.01), and 7 days (3.7-fold, p < 0.001). The level of cinnamoyl- glycine in control group was 1.7-fold (p < 0.05) that in DCA-treated group after a 7-day exposure. Treatment with both TCA and DCA did not cause a significant change in pantothenic acid and phenylacetylglycine (Supplemental Fig. 9).
Fig. 5.
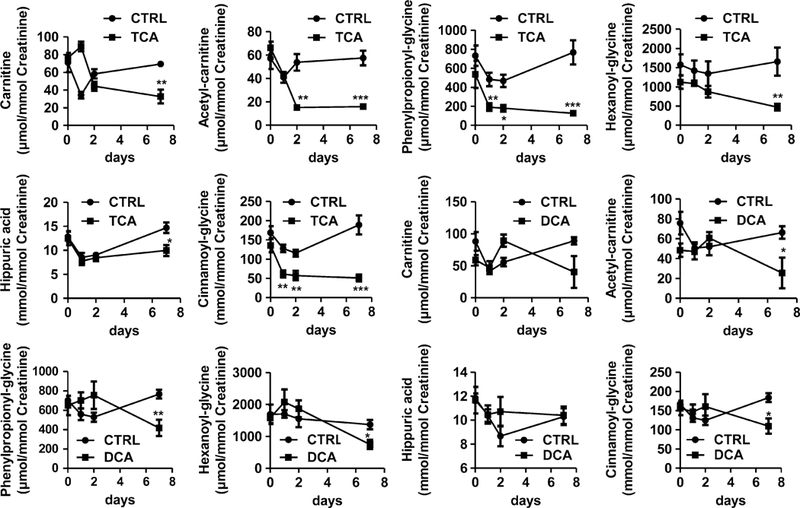
Comparison of the alterations in carnitine, acetylcarnitine, phenylpropionylglycine, hexanoylglycine, hippuric acid, and cinna- moylglycine in TCA- and DCA-treated mice. The mice were exposed to TCE for 0, 1, 2, and 7 days. The concentrations of each metabolite were calculated using standard curves of authentic compounds, and the data were given as mean ± SEM (n = 5). *p < 0.05, **p < 0.01, ***p < 0.001
In serum, LPC 18:1 exhibited higher levels in the TCA- treated groups than in the control group (p < 0.001), and no significant change in LPC18:1 was detected between the control group and DCA-treated group (Fig. 6). The LPC 18:0 levels were lower in the DCA-treated group than in the control group, and no difference was found between the TCA-treated group and control group.
Fig. 6.
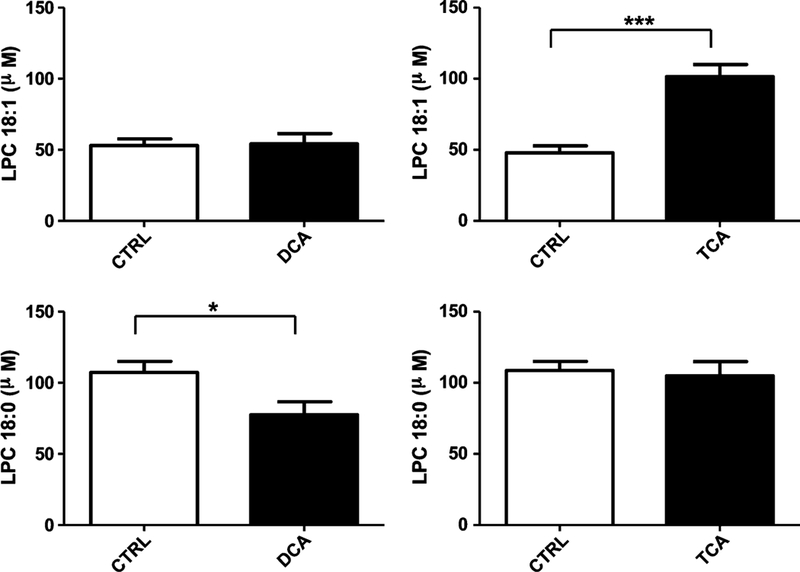
Quantitation of LPC(18:1,9Z) and LPC (18:0) in serum of control group, DCA- treated, and TCA-treated group. Each group contains five mice, and the data given as mean ± SEM (n = 5).*p < 0.05, **p < 0.01,***p < 0.001
Influence of TCE and its metabolites (DCA, TCA) exposure on expression of PPARα target genes
Treatment of 800 and 1,600 mg/kg/day TCE for 7 days significantly increased the expression of Acox-1, Cyp4a10, Acadm, Ehhadh, Acadl, and Acaa1a mRNAs, while the levels of Ppara, Cpt-1a, Cpt-2, and Acot-1 mRNAs were not significantly changed (Fig. 7). Treatment with DCA for 7 days significantly increased the levels of Cyp4a10, Ehhadh, Acadl, and Acot-1 mRNAs by 9.2 (p < 0.05), 12.1 (p < 0.05), 3.1 (p < 0.01), and 15.8 (p < 0.05)-fold, respectively. While levels of other mRNAs did not show a significant difference, treatment with TCA significantly increased the expression of Acox1 (3.7-fold, p < 0.05), Cyp4a10 (20.8-fold, p < 0.05), Ehhadh (21-fold, p < 0.01), Acadl (2.3-fold, p < 0.01), Acaa1a (1.3-fold, p < 0.05), Cpt2 (1.4-fold, p < 0.05), and Acot1 (14.9, p < 0.05) mRNAs (Fig. 8).
Fig. 7.
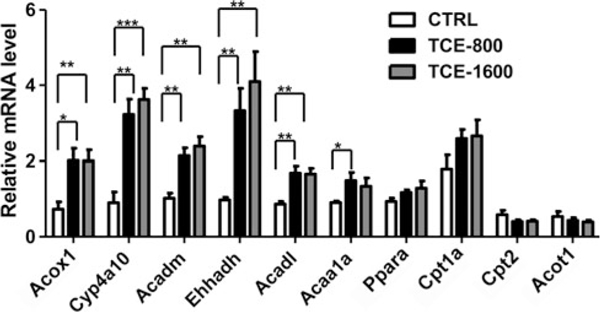
The influence of TCE treatment on mRNAs encoding PPARα and its target genes associated with fatty acid metabolism. The data are given as mean ± SEM (n = 5). Messenger RNA levels were normalized to levels of β-actin mRNA in same preparation. *p < 0.05, **p < 0.01, ***p < 0.001
Fig. 8.
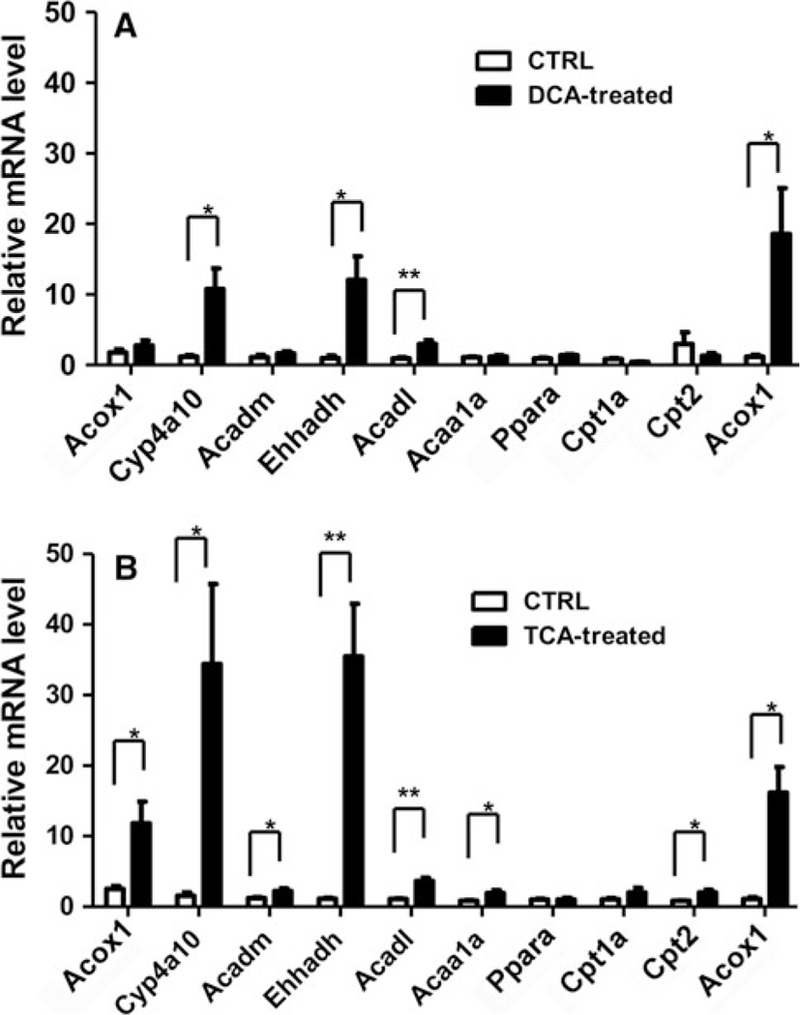
Comparison of the effects of DCA and TCA exposures on the levels of Ppara mRNA and its target genes associated with fatty acid metabolism. Values represent mean ± SEM for five mice per group. Messenger RNA levels were normalized to levels of β-actin mRNA in the same preparation. *p < 0.05, **p < 0.01, ***p < 0.001
Discussion
Peroxisome proliferator-activated receptor α regulates key genes controlling glucose and lipid metabolism, and influences cell proliferation and inflammatory responses (Michalik et al. 2006). Previous studies trying to correlate tumor induction with PPARα activation demonstrated that the mode of action of TCE is likely dominated by PPARα- dependent mechanisms in mice (Corton 2008). The introduction of metabolomics in this study facilitates a more complete understanding of the relationship between PPARα activation and TCE-induced liver toxicity.Additionally, the detection of metabolites in urine and serum could be employed as noninvasive method for the determination of TCE exposure.
The behavior of TCE, DCA, and TCA as PPs was demonstrated in previous studies. For example, the increased liver to body weight ratios at various doses of TCE, DCA, and TCA was clearly described by others (Elcombe et al. 1985; Nakajima et al. 2000; Laughter et al. 2004). The same results were verified in the present study. Eight urine metabolites underwent significant decrease after exposure of mice to TCE, including hip-puric acid, cinnamoylglycine, phenylacetylglycine, hexanoylglycine, phenylpropionylglycine, pantothenic acid, carnitine, and acetylcarnitine. As previously reported, a significant depletion of urinary pantothenic acid, carnitine, and acetylcarnitine reflected enhanced fatty acid β-oxidation, thus indicating that surplus pools of these three metabolites were decreased from the urinary excretory pathway through uptake by mitochondria (Patterson et al. 2009). The decreased levels of glycine conjugates were also detected in the previous study in which the PPARα activator Wy-14,643 ([4-chloro-6- (2,3-xylidino)-2-pyrimidinylthio] acetic acid) was employed (Zhen et al. 2007). A possible explanation might be that the level of coenzyme A available for mitochondrial glycine conjugation reaction was reduced with the upregulation of mitochondrial fatty acid β-oxidation activity. Therefore, the decreased metabolites in urine might be due to increased fatty acid metabolism in liver as a result of the increased expression of PPARα target genes involved in fatty acid beta-oxidation. The results showed that TCE exposure significantly increased the levels of Acox1, Cyp4a10, Acadm, Ehhadh, Acadl, and Acaa1a mRNAs which correlated with decreased metabolites that result from increased fatty acid metabolism after TCE exposure.
Trichloroethylene-induced serum metabolomics revealed an elevation of LPC 18:0, LPC 18:1 (9Z), and some PC components in the serum. Lipids play a key role in cell, tissue, and organ physiology, and many diseases are due to disruption of lipid metabolism (Lee et al. 2011). LPC and PC are two major phospholipid components in serum and are altered by liver toxicity. For example, lithocholic acid (LCA)-induced hepatic injury resulted in a decrease in several LPC components, including LPC 16:0, LPC 18:0, LPC18:1, and LPC 18:2 (Matsubara et al. 2011). In a metabolomics study of he-patocarcinogenesis, LPC 22:5 and LPC 16:0 exhibited significant elevation (Tan et al. 2012). In mice xeno- grafted with hepatocellular carcinoma cells, PC levels were significantly higher. Additionally, LPCs containing saturated or monounsaturated fatty acids decreased, while LPCs containing polyunsaturated fatty acids increased (Li et al. 2011a, b). The decrease in a series of LPC components was also detected in cholic acid (CA)-triggered liver injury and methionine- and choline-deficient (MCD) diet-induced non-alcoholic steatohepatitis (Li et al. 2012; Tanaka et al. 2012). Therefore, the increased levels of LPC and PC components might be induced by liver toxicity caused by TCE.
Controversies remain on the contribution of DCA and TCA to the toxicity of TCE. Some studies supported a similar mode of action of TCE and TCA. For example, TCE and TCA have significant similarities to the typical peroxisome proliferator, such as dose-dependent behaviors showing that PPARα-dependent responses were coincident with liver tumor induction, and lack of TCE and TCA effects in Ppara-null mice (Corton 2008). Additionally, the in vivo formation of DCA remains to be determined. Some studies have detected the formation of DCA after administration of TCE (Templin et al. 1993), while others have been unable to determine its presence (Larson and Bull 1992; Templin et al. 1995). An explanation for this discrepancy in DCA levels might be the result of non-enzy- matic conversion of TCA into DCA during sample preparation or the lack of accumulation of measurable amounts of DCA due to its rapid elimination (Merdink et al. 1998). Contradictory data also exist to indicate that DCA might play a role in TCE-induced toxicity. For example, TCE-induced tumors exhibit more similar characteristics to DCA-induced tumors than to TCA-induced tumors (Bull et al. 2002). To discern the role of oxidative metabolism in TCE-induced hepatomegaly, a physiologically based pharmacokinetic (PBPK) model was used to show that the proportionality of dose to response for TCE- and DCA-induced hepatomegaly cannot be observed for administered doses of TCA (Evans et al. 2009). In the present study, the metabolomic changes were compared in mice treated with TCE and its metabolites DCA and TCA, with the aim to provide new information on the contribution of DCA and TCA. A more comparable metabolomic profile was found after TCA exposure than DCA exposure. Among eight metabolites reduced in the urine of TCE- treated mice, six were found to decrease in the TCA-treated group, and four metabolites were found to decrease in DCA-treated group. The stronger alteration in these metabolites in the TCA-treated group might be explained by a more robust activation of fatty acid metabolism- related genes. Additionally, for the same metabolites, the decreased fold-changes in the TCA-treated group were higher than those in the DCA-treated group. For LPC 18:1 (9Z) and LPC 18:0 in serum, the TCA-treated mice exhibited a more similar alteration trend with the TCE- treated mice than DCA-treated mice. All these results suggest a major contribution of TCA toward TCE-induced metabolites alteration.
In conclusion, the influence of TCE toward fatty acid metabolism and phospholipid homeostasis is schematically depicted in Fig. 9. TCE can be metabolized to DCA and TCA, which change the levels of metabolites in urine as a result of altered fatty acid metabolism through regulating the expression of PPARα target genes encoding enzymes involved in fatty acid metabolism. Additionally, the liver hepatomegaly induced by PPARα activation can alter phospholipid homeostasis. It should be noted that complex factors might affect the levels of these metabolites in mice as compared to humans. For example, others found that TCE exposure induced hepatic lipid accumulation in PPARα-humanized mice but not in wild-type mice (Ramdhan et al. 2010). Therefore, the metabolomic profile might differ between humans and mice.
Fig. 9.
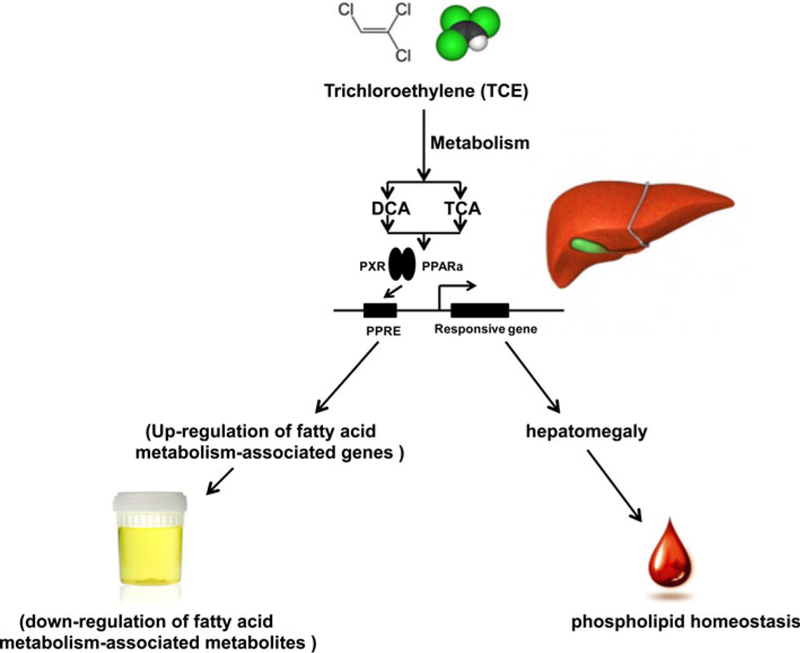
A schematic summary of TCE exposure-induced changes of mRNA levels in liver and metabolites in urine and serum. TCE is metabolized to its two metabolites DCA and TCA. Induction of PPARα target genes by these two metabolites (especially TCA) results in increased fatty acid metabolism and hepatomegaly resulting in alteration of metabolite profiles in urine and serum
Supplementary Material
Acknowledgments
This work was supported in part by the Intramural Research Program of the Center for Cancer Research, National Cancer Institute, National Institutes of Health.
Abbreviations
- Acaa1a
Acetyl-CoA acyltransferase 1a
- Acadl
Acyl-CoA dehydrogenase, long chain
- Acadm
Acyl-CoA dehydrogenase, C-4 to C-12 straight chain
- Acox
Acyl-CoA oxidase
- Acot1
Acyl-CoA thioesterase 1
- ALT
Alanine transaminase
- ALP
Alkaline phosphatase
- AST
Aspartate aminotransferase
- Cpt1a
Carnitine palmitoyltransferase 1a
- Cpt2
Carnitine palmitoyltransferase 2
- Cyp4a10
Cytochrome P450 4a10
- DCA
Dichloroacetate
- eEF
Eukaryotic translation elongation factor
- Ehhadh
Enoyl-CoA hydratase/3-hydroxyacyl CoA dehydrogenase
- IACR
International Agency for Cancer Research
- LPC
Lysophosphatidylcholine
- MS
Mass spectrometry
- NMR
Nuclear magnetic resonance
- PC
Phosphatidylcholine
- PP
Peroxisome proliferator chemicals
- PPAR
Peroxisome proliferator-activated receptor
- qPCR
Quantitative polymerase chain reaction
- TAF
Template-activating factor
- TCA
Trichloroacetate
- TCE
Trichloroethylene
- TG
Triglyceride
- UPLC
Ultra-performance liquid chromatography
- Wy-14,643
[4-chloro-6-(2,3-xylidino)-2-pyrimidinylthio]acetic acid
Footnotes
Conflict of interest The authors have declared that there are no conflicts of interest.
Electronic supplementary material The online version of this article (doi:10.1007/s00204-013-1053-1) contains supplementary material, which is available to authorized users.
References
- Bakke B, Stewart PA, Waters MA (2007) Uses of and exposure to trichloroethylene in US industry: a systemic literature review. J Occup Environ Hyg 4(5):375–390 [DOI] [PubMed] [Google Scholar]
- Bull RJ (2000) Mode of action of liver tumor induction by trichloroethylene and its metabolites, trichloroacetate and dichloroacetate. Environ Health Perspect 108(Suppl2):241–259 [DOI] [PMC free article] [PubMed] [Google Scholar]
- Bull RJ, Orner GA, Cheng RS, Stillwell L, Stauber AJ, Sasser LB, Lingohr MK, Thrall BD (2002) Contribution of dichloroacetate and trichloroacetate to liver tumor induction in mice by trichloroethylene. Toxicol Appl Pharmacol 182:55–65 [DOI] [PubMed] [Google Scholar]
- Byers VS, Levin AS, Ozonoff DM, Baldwin RW (1988) Association between clinical symptoms and lymphocyte abnormalities in a population with chronic domestic exposure to industrial solvent contaminated domestic water supply and a high incidence of leukaemia. Cancer Immunol Immunother 27(1):77–81 [DOI] [PMC free article] [PubMed] [Google Scholar]
- Candura SM, Faustman EM (1991) Trichloroethylene: toxicology and health hazards. G Ital Med Lav 13(1–6):17–25 [PubMed] [Google Scholar]
- Corton JC (2008) Evaluation of the role of peroxisome proliferator- activated receptor a (PPARα) in mouse liver tumor induction by trichloroethylene and metabolites. Crit Rev Toxicol 38:857–875 [DOI] [PubMed] [Google Scholar]
- Elcombe CR, Rose MS, Pratt IS (1985) Biochemical, histological, and ultrastructural changes in rat and mouse liver following the administration of trichloroethylene: possible relevance to species differences in hepatocarcinogenicity. Toxicol Appl Pharmacol 67:392–401 [DOI] [PubMed] [Google Scholar]
- Evans MV, Chiu WA, Okino MS, Caldwell JC (2009) Development of an updated PBPK model for trichloroethylene and metabolites in mice, and its application to discern the role of oxidative metabolism in TCE-induced hepatomegaly. Toxicol Appl Pharmacol 236:329–340 [DOI] [PubMed] [Google Scholar]
- Griffin JM, Gilbert KM, Lamps LW, Pumford NR (2000) CD4 + T cell activation and induction of autoimmune hepatitis following trichloroethylene treatment in MRL +/+ mice. Toxicol Sci 57:345–352 [DOI] [PubMed] [Google Scholar]
- Hong WX, Yang L, Chen M, Yang X, Ren X, Fang S, Ye J, Huang H, Peng C, Zhou L, Huang X, Yang F, Wu D, Zhuang Z, Liu J (2012) Proteomic analysis of trichloroethylene-induced alterations in expression, distribution, and interactions of SET/TAF-Ia and two SET/TAF-Ia-binding proteins, eEF1A1 and eEF1A2, in hepatic L-02 cells. Toxicol Appl Pharmacol 263(2):259–272 [DOI] [PubMed] [Google Scholar]
- Johnson CH, Gonzalez FJ (2011) Challenges and opportunities of metabolomics. J Cell Physiol 227(8):2975–2981 [DOI] [PMC free article] [PubMed] [Google Scholar]
- Keshava N, Caldwell JC (2006) Key issues in the role of peroxisome proliferator-activated receptor agonism and cell signaling in trichloroethylene toxicity. Environ Health Perspect 114(9):1464–1470 [DOI] [PMC free article] [PubMed] [Google Scholar]
- Kim D, Ghanayem BI (2006) Comparative metabolism and disposition of trichloroethylene in Cyp2e1−/− and wild-type mice. Drug Metab Dispos 34(12):2020–2027 [DOI] [PubMed] [Google Scholar]
- Kind T, Fiehn O (2007) Seven Golden Rules for heuristic filtering of molecular formulas obtained by accurate mass spectrometry. BMC Bioinformatics 8:105. [DOI] [PMC free article] [PubMed] [Google Scholar]
- Larson JL, Bull RJ (1992) Metabolism and lipoperoxidative activity of trichloroethylene and dichloroacetate in rats and mice. Toxicol Appl Pharmacol 115:268–277 [DOI] [PubMed] [Google Scholar]
- Laughter AR, Dunn CS, Swanson CL, Howroyd P (2004) Role of the peroxisome proliferator-activated receptor a (PPARa) in responses to trichloroethylene and metabolites, trichloroacetate and dichloroacetate in mouse liver. Toxicology 203:83–98 [DOI] [PubMed] [Google Scholar]
- Lee JW, Yamamoto T, Uchikata T, Matsubara A, Fukusaki E, Bamba T (2011) Development of a polar lipid profiling method by supercritical fluid chromatography/mass spectrometry. J Sep Sci 34:3553–3560 [DOI] [PubMed] [Google Scholar]
- Li F, Patterson AD, Höfer CC, Krausz KW, Gonzalez FJ, Idle JR (2011a) A comprehensive understanding of thioTEPA metabolism in the mouse using UPLC-ESI-QTOFMS-based metabolo-mics. Biochem Pharmacol 81:1043–1053 [DOI] [PMC free article] [PubMed] [Google Scholar]
- Li S, Liu H, Jin Y, Lin S, Cai Z, Jiang Y (2011b) Metabolomics study of alcohol-induced liver injury and hepatocellular carcinoma xenografts in mice. J Chromatogr B 879:2369–2375 [DOI] [PubMed] [Google Scholar]
- Li F, Patterson AD, Krausz KW, Tanaka N, Gonzalez FJ (2012) Metabolomics reveals an essential role for peroxisome prolifer-ator-activated receptor alpha in bile acid homeostasis. J Lipid Res 53(8):1625–1635 [DOI] [PMC free article] [PubMed] [Google Scholar]
- Liu J, Huang H, Xing X, Xi R, Zhuang Z, Yuan J, Yang F, Zhao J (2007) Comparative proteomic analysis on human L-02 liver cells treated with varying concentrations of trichloroethylene. Toxicol Ind Health 23(2):91–101 [DOI] [PubMed] [Google Scholar]
- Maronpot RR, Anna CH, Devereux TR, Lucier GW, Butterworth BE, Anderson MW (1995) Considerations concerning the murine hepatocarcinogenicity of selected chlorinated hydrocarbons. Prog Clin Biol Res 391:305–323 [PubMed] [Google Scholar]
- Matsubara T, Tanaka N, Patterson AD, Cho JY, Krausz KW, Gonzalez FJ (2011) Lithocholic acid disrupts phospholipid and sphingolipid homeostasis leading to cholestasis in mice. Hepa-tology 53(4):1282–1293 [DOI] [PMC free article] [PubMed] [Google Scholar]
- Merdink JL, Gonzalez-Leon A, Bull RJ, Schultz IR (1998) The extent of dichloroacetate formation from trichloroethylene, chloral hydrate, trichloroacetate, and trichloroethanol in B6C3F1 mice. Toxicol Sci 45:33–41 [DOI] [PubMed] [Google Scholar]
- Michalik L, Auwerx J, Berger JP, Chatterjee VK, Glass CK, Gonzalez FJ, Grimaldi PA, Kadowaki T, Lazar MA, O’Rahilly S, Palmer CN, Plutzky J, Reddy JK, Spiegelman BM, Staels B, Wahli W (2006) International union of pharmacology. LXI peroxisome proliferator-activated receptors. Pharmacol Rev 58(4):726–741 [DOI] [PubMed] [Google Scholar]
- Nakajima T, Kamijo Y, Usuda N, Liang Y, Fukushima Y, Kametani K, Gonzalez FJ, Aoyama T (2000) Sex-dependent regulation of hepatic peroxisome proliferation in mice by trichloroethylene via peroxisome proliferator-activated receptor α (PPARα). Carcinogenesis 21(4):677–682 [DOI] [PubMed] [Google Scholar]
- Park SK, Nam SW, Ryu JC, Ham JH, Lee MY (2010) Proteomic analysis of rat liver proteins differentially induced by trichloro- ethylene. Biochip J 4(1):57–62 [Google Scholar]
- Patterson AD, Slanar O, Krausz KW, Li F, Hofer CC, Perík F, Gonzalez FJ, Idle JR (2009) Human urinary metabolomic profile of PPARa induced fatty acid β-oxidation. J Proteome Res 8:4293–4300 [DOI] [PMC free article] [PubMed] [Google Scholar]
- Pesch B, Haerting J, Ranft U, Klimpel A, Oelschlägel B, Schill W (2000) Occupational risk factors for renal cell carcinoma: agent-specific results from a case-control study in Germany, MURC Study Group. Multicenter urothelial and renal cancer study. Int J Epidemiol 29(6):1014–1024 [DOI] [PubMed] [Google Scholar]
- Ramdhan DH, Kamijima M, Yamada N, Ito Y, Yanagiba Y, Nakamura D, Okamura A, Ichihara G, Aoyama T, Gonzalez FJ, Nakajima T (2008) Molecular mechanism of trichloroethylene-induced hepatotoxicity mediated by CYP2E1. Toxicol Appl Pharmacol 231(3):300–307 [DOI] [PMC free article] [PubMed] [Google Scholar]
- Ramdhan DH, Kamijima M, Wang D, Ito Y, Naito H, Yanagiba Y, Hayashi Y, Tanaka N, Aoyama T, Gonzalez FJ, Nakajima T (2010) Differential response to trichloroethylene-induced hepa-tosteatosis in wild-type and PPARα-humanized mice. Environ Health Perspect 118(11):1557–1563 [DOI] [PMC free article] [PubMed] [Google Scholar]
- Tan Y, Yin P, Tang L, Xing W, Huang Q, Cao D, Zhao X, Wang W, Lu X, Xu Z, Wang H, Xu G (2012) Metabolomics study of stepwise hepatocarcinogenesis from the model rats to patients: potential biomarkers effective for small hepatocellular carcinoma diagnosis. Mol Cell Proteomics 11(2): DOI: 10.1074/mcp.M111.010694 [DOI] [PMC free article] [PubMed] [Google Scholar]
- Tanaka N, Moriya K, Kiyosawa K, Koike K, Gonzalez FJ, Aoyama T (2008) PPARalpha activation is essential for HCV core protein- induced hepatic steatosis and hepatocellular carcinoma in mice. J Clin Invest 118:683–694 [DOI] [PMC free article] [PubMed] [Google Scholar]
- Tanaka N, Matsubara T, Krausz KW, Patterson AD, Gonzalez FJ (2012) Disruption of phospholipid and bile acid homeostasis in mice with nonalcoholic steatohepatitis. Hepatology 56(1): 118–129 [DOI] [PMC free article] [PubMed] [Google Scholar]
- Templin MV, Parker JC, Bull RJ (1993) Relative formation of dichloroacetate and trichloroacetate from trichloroethylene in male B6C3F1 mice. Toxicol Appl Pharmacol 123:1–8 [DOI] [PubMed] [Google Scholar]
- Templin MV, Stevens DK, Stenner RD, Bonate PL, Tuman D, Bull RJ (1995) Factors affecting species differences in the kinetics of metabolites of trichloroethylene. J Tocicol Environ Health 44:435–447 [DOI] [PubMed] [Google Scholar]
- Viant MR, Bundy JG, Pincetich CA, de Ropp JS, Tjeerdema RS (2005) NMR-derived developmental metabolic trajectories: an approach for visualizing the toxic actions of trichloroethylene during embryogenesis. Metabolomics 1(2):149–158 [Google Scholar]
- Wartenberg D, Reyner D, Scott CS (2000) Trichloroethylene and cancer: epidemiologic evidence. Environ Health Perspect 108(Suppl. 2):161–176 [DOI] [PMC free article] [PubMed] [Google Scholar]
- Zhen Y, Krausz KW, Chen C, Idle JR, Gonzalez FJ (2007) Metabolomic and genetic analysis of biomarkers for peroxisome proliferator-activated receptor a expression and activation. Mol Endocrinol 21(9):2136–2151 [DOI] [PMC free article] [PubMed] [Google Scholar]
- Zhou YC, Waxman DJ (1998) Activation of peroxisome proliferator-activated receptors by chlorinated hydrocarbons and endogenous steroids. Environ Health Perspect 106(Suppl 4):983–988 [DOI] [PMC free article] [PubMed] [Google Scholar]
Associated Data
This section collects any data citations, data availability statements, or supplementary materials included in this article.


