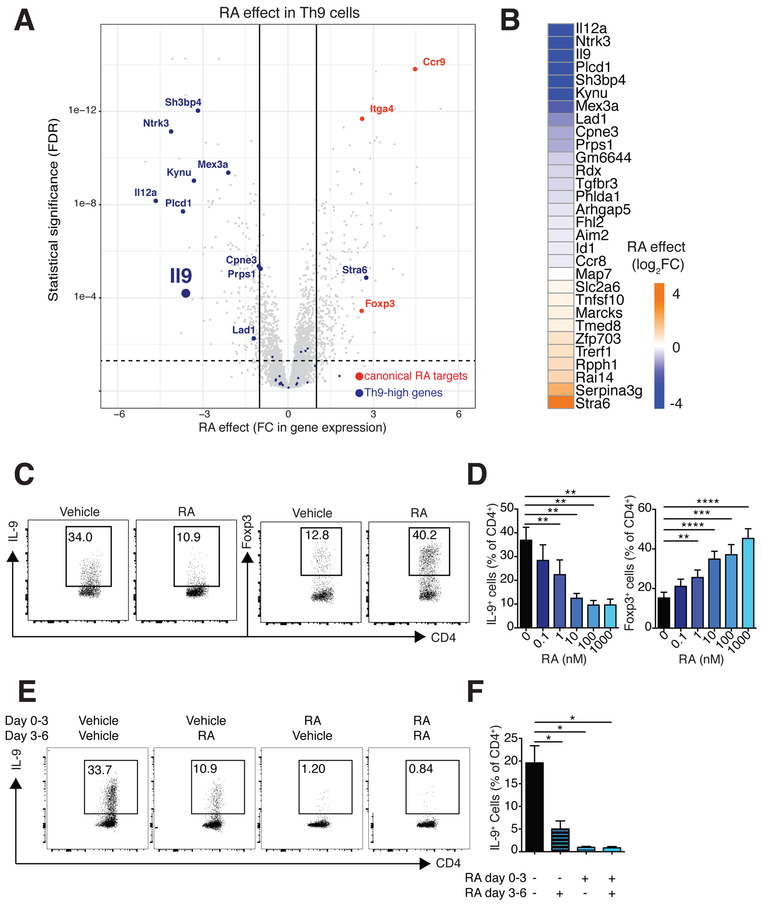
Figure 3. RA represses a Th9 transcriptional program.
A. Volcano plot of gene expression in Th9 cells. Fold change in gene expression (RA vs. vehicle control) vs. FDR is shown for the transcriptomes of Th9 cells (n=2). Selected RAregulated genes (FC>2 or <−2, FDR<0.05) are highlighted: canonical RA-regulated genes (orange); and Th9-high genes (blue). B. Th9-high genes and RA effect on these genes. Heatmap depicts log2 normalized average fold change in gene expression (RA vs. vehicle control, n=2) for Th9-high genes, which were selectively expressed in Th9 cells more than in Th1, Th2, Th17, and iTreg cells (n=30) C-F. Flow cytometric analysis of Th9 cells cultured in the presence of RA vs. vehicle control. C. Representative plots of IL-9 and Foxp3 expression in Th9 cells cultured with vehicle control or 1000 nM RA. D. Bar graph summarizing IL-9 and Foxp3 expression in Th9 cells cultured with vehicle control or escalating doses of RA (n=6). E. Representative plots of IL-9 expression in Th9 cells exposed to 1000nM RA at different time points. F. Bar graph summarizing IL-9 expression (n=3) (data shown as mean ± SEM; *p<0.05,**p<0.01,***p<0.005, ****p<0.001, paired t-test). See also Figure S1.

