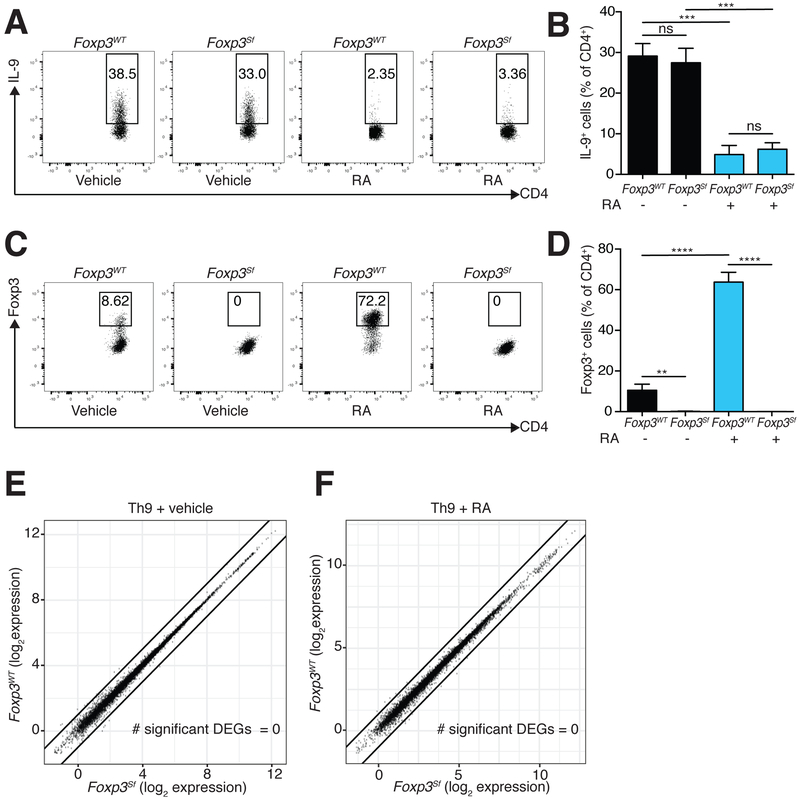
Figure 4: RA acts independently of Foxp3.
A-D. Flow cytometric analysis of Rag2−/− OT-II (FoxpWT) and Rag2−/− OT-II Foxp3Sf (Foxp3Sf) cells cultured under Th9 conditions in the presence of RA vs. vehicle control. A. Representative plots of IL-9 expression in FoxpWT and Foxp3Sf cells cultured with vehicle control or RA. B. Bar graph summarizing IL-9 expression (n=6). C. Representative plots of Foxp3 expression in cells cultured with vehicle control or RA. D. Bar graph summarizing Foxp3 expression (n=6). (data shown as mean ± SEM; **p<0.01, ***p<0.005, ****p<0.001, paired ttest.) E,F. Scatterplots comparing average gene expression in Foxp3WT and Foxp3Sf cells cultured under Th9 conditions, with vehicle control (E) and RA (F). Black lines indicate fold-change in gene expression (FC) ≥2 or ≤−2 in FoxpWT vs. Foxp3Sf cells. No significant differentially expressed genes were seen (FC≥2 or ≤−2, FDR<0.05) (n=2). RA = 1000 nM for all experiments. See also Figure S2.

