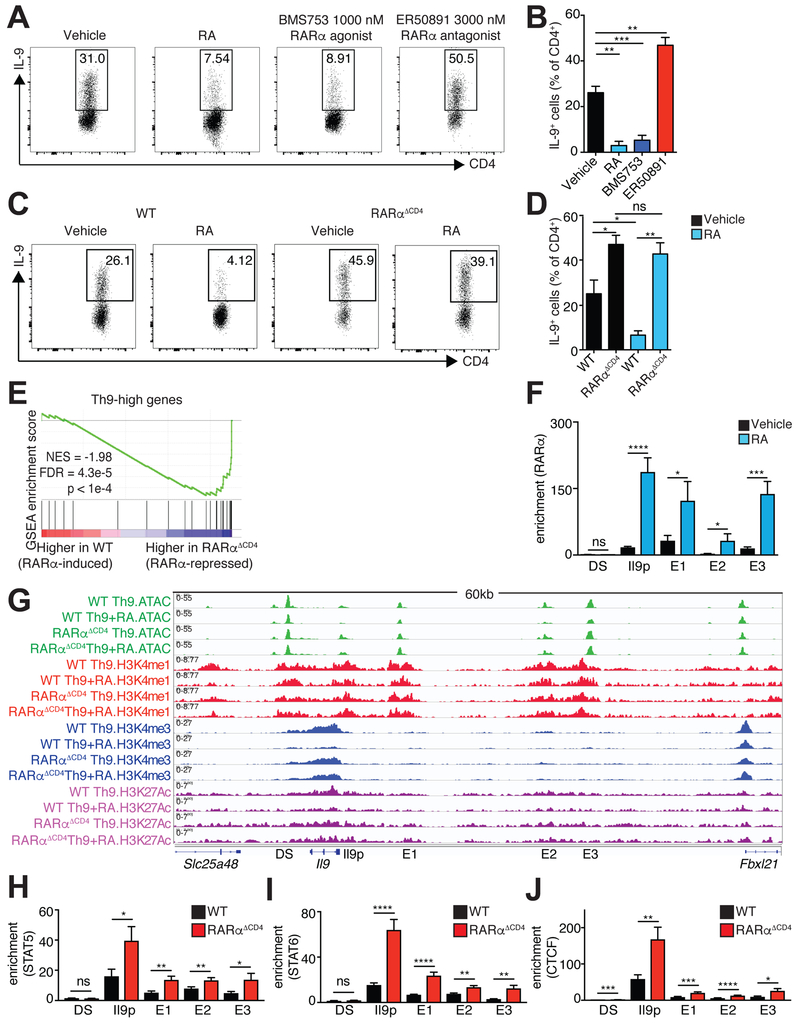
Figure 6: RA directly represses IL-9 via RARα.
A,B. Effect of RA, RARα agonist, and RARα antagonist on generation of Th9 cells. A. Representative flow cytometric plots of IL-9 expression in cells cultured under Th9 conditions with vehicle control, 1000 nM RA, 1000 nM RARα agonist (BMS753), or 3000 nM RARα antagonist (ER50891). B. Bar graph summarizing IL-9 expression (n=5). C,D. IL-9 expression in WT vs. RARαΔCD4 Th9 cells. C. Representative flow cytometric plots of IL-9 expression in cultured under Th9 conditions with vehicle control or 1000 nM RA. D. Bar graph summarizing IL-9 expression (n=5). Flow data shown as mean ± SEM; *p<0.05, **p<0.01,***p<0.005,****p<0.001, paired t-test. E. RARα suppresses net expression of Th9high genes. Gene Set Enrichment Analysis (GSEA) plot depicts effect of RARα deletion on Th9-high genes, accounting for the net, or average, effect on all the genes in the geneset. F. ChIP-qPCR for RARα at Il9 regulatory elements in Th9 cells treated with vehicle control or RA. Bar graphs summarize binding enrichment for RARα relative to input at the five Il9 regulatory elements (n=3). G. RA effect on histone modifications and accessibility of Il9 regulatory elements (REs) in WT vs RARαΔCD4 Th9 cells. Representative Il9 gene tracks of ATAC, H3K4M1, H3K4M3, and H3K27Ac in WT or RARαΔCD4 Th9 cells polarized in the presence of vehicle control or RA. (n=2–4). H-J. ChIP-qPCR for STAT5, and STAT6, and CTCF at Il9 regulatory elements in WT or RARαΔCD4 Th9 cells. Bar graphs summarize binding enrichment for STAT5 (H), STAT6 (I), and CTCF (J) at the five Il9 regulatory elements, in WT or RARαΔCD4 Th9 cells (n=3–5); ChIP-qPCR data shown as mean ± SEM; *p<0.05,**p<0.01,***p<0.005,****p<0.001, unpaired t-test. See also Figure S4.

