

Abstract
A long-standing challenge of untargeted meta-bolomic profiling by ultrahigh-performance liquid chromatography-high-resolution mass spectrometry (UHPLC-HRMS) is efficient transition from unknown mass spectral features to confident metabolite annotations. The compMS2Miner (Comprehensive MS2 Miner) package was developed in the R language to facilitate rapid, comprehensive feature annotation using a peak-picker-output and MS2 data files as inputs. The number of MS2 spectra that can be collected during a metabolomic profiling experiment far outweigh the amount of time required for pain-staking manual interpretation; therefore, a degree of software workflow autonomy is required for broad- scale metabolite annotation. CompMS2Miner integrates many useful tools in a single workflow for metabolite annotation and also provides a means to overview the MS2 data with a Web application GUI compMS2Explorer (Comprehensive MS2 Explorer) that also facilitates data-sharing and transparency. The automatable compMS2Miner workflow consists of the following steps: (i) matching unknown MS1 features to precursor MS2 scans, (ii) filtration of spectral noise (dynamic noise filter), (iii) generation of composite mass spectra by multiple similar spectrum signal summation and redundant/contaminant spectra removal, (iv) interpretation of possible fragment ion substructure using an internal database, (v) annotation of unknowns with chemical and spectral databases with prediction of mammalian biotransformation metabolites, wrapper functions for in silico fragmentation software, nearest neighbor chemical similarity scoring, random forest based retention time prediction, text-mining based false positive removal/true positive ranking, chemical taxonomic prediction and differential evolution based global annotation score optimization, and (vi) network graph visualizations, data curation, and sharing are made possible via the compMS2Explorer application. Metabolite identities and comments can also be recorded using an interactive table within compMS2Explorer. The utility of the package is illustrated with a data set of blood serum samples from 7 diet induced obese (DIO) and 7 nonobese (NO) C57BL/6J mice, which were also treated with an antibiotic (streptomycin) to knockdown the gut microbiota. The results of fully autonomous and objective usage of compMS2Miner are presented here. All automatically annotated spectra output by the workflow are provided in the Supporting Information and can alternatively be explored as publically available compMS2Explorer applications for both positive and negative modes (https://wmbedmands.shinyapps.io/compMS2_mouseSera_POS and https://wmbedmands.shinyapps.io/compMS2_mouseSera_NEG). The workflow provided rapid annotation of a diversity of endogenous and gut microbially derived metabolites affected by both diet and antibiotic treatment, which conformed to previously published reports. Composite spectra (n = 173) were autonomously matched to entries of the Massbank of North America (MoNA) spectral repository. These experimental and virtual (lipidBlast) spectra corresponded to 29 common endogenous compound classes (e.g., 51 lysophosphatidylcholines spectra) and were then used to calculate the ranking capability of 7 individual scoring metrics. It was found that an average of the 7 individual scoring metrics provided the most effective weighted average ranking ability of 3 for the MoNA matched spectra in spite of potential risk of false positive annotations emerging from automation. Minor structural differences such as relative carbon—carbon double bond positions were found in several cases to affect the correct rank of the MoNA annotated metabolite. The latest release and an example workflow is available in the package vignette (https://github.com/WMBEdmands/compMS2Miner) and a version of the published application is available on the shinyapps.io site (https://wmbedmands.shinyapps.io/compMS2Example).
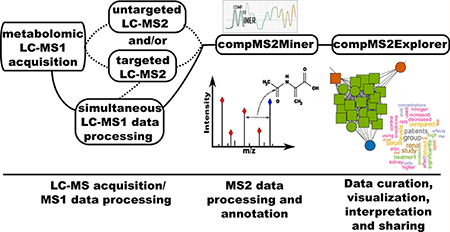
Graphical Abstract
A major bottleneck in interpretation of UHPLC—HRMS based metabolomic data sets is identification of unknown MS1 features due to enormous potential compound structural heterogeneity.1 For the vast majority of metabolites, no commercially available standards are available and therefore no experimental spectra exist in any database.
We developed the open-source compMS2Miner package as a comprehensive metabolite annotation workflow for data- dependent/targeted MS2 data, which is modular, readily extensible, and provides facile data curation, visualization, and sharing. Many existing, disparate software tools partially address the challenges of UHPLC—HRMS based identification such as in silico fragmentation prediction, for example.2–13 However, until recently, few workflows provide a comprehensive solution to the UHPLC—HRMS based metabolite identification challenge.13–17 Broad and comprehensive metabolite annotation is highly desirous to gain an understanding of and accurately interpret the chemical content of a UHPLC—HRMS based metabolomic data set. Ideally, an effort is made to collect untargeted data-dependent or the less commonly available data- independent MS2 fragmentation experimental methodologies during the course of metabolomic MS1 profiling as this is critical for precise and accurate matching of unknown features to MS2 spectra.14,18 Fragmentation spectra collected can be utilized to provide an overview of the chemical constituents of a sample set (including potential contaminants and electrospray ionization (ESI) artifacts) and helps to pre-empt future metabolite annotation requirements during statistical investigations.
MS2 fragmentation in combination with additional metabolite annotation methods such as retention time prediction, experimental spectral database matching, in silico fragmentation prediction, literature based biological plausibility, substructure annotation, substructure reconstruction, and chemometric methods such as chemical similarity distance metrics provide powerful evidence for metabolite identification.13–17
The compMS2Miner package therefore combines a number of these useful annotation methods and seeks to present the user with as much evidence as possible within the user interface while maximizing organization and efficiency. Annotation of at the very least the compound class of an unknown is facilitated by a final consensus score calculation which makes use of existing R packages and external software.19–35 Unlike pre-existing metabolite annotation workflows, compMS2Miner allows truly automated first-pass metabolite annotation at several stages prior to any result visualization and interpretation. This is achieved by experimental spectrum database similarity scoring, a mean maximum nearest neighbor chemical similarity score (MMNNCSS) and a mean consensus annotation score which can be further optimized using the differential evolution search heuristic.36–40
The mean consensus score is based upon mass accuracy, substructure similarity, first-neighbor chemical similarity, predicted retention time, in silico fragmentation, and also the number of PubMed abstracts containing the metabolite name, for example, (compMS2Miner v.2.2.3). These objective functions can optionally add the most likely assignment to a metabolite annotation comments table which can then be modified in the user interface compMS2Explorer.
For the majority of common metabolites these automated annotation processes can save a great deal of time and effort. The investigator can also automatically remove false positive annotations using an average prohibited word frequency in text- mined abstracts of the PubMed repository. Annotations can be further ranked based on an average word count of words of interest (e.g., bacterial, gut, microbiota, etc.) in randomly sampled abstracts also downloaded from the PubMed repository providing a crude first-pass literature review for each putative annotation.41 Chemical taxonomic annotation and prediction is also implemented to facilitate rapid data interpretation.
Following the automated metabolite annotation process a fully informed decision for the identity of each unknown can be made within the compMS2Explorer application. Ideally, upon final publication, relevant data files (including the workflow code utilized) can be bundled alongside the compMS2Explorer application providing a fully reproducible workflow.
As an example, we illustrate compMS2Miner with a metabolomic study of blood serum collected from diet induced DIO and NO mice, which were treated with a broad spectrum antibiotic to knock-down the gut microbiota. The automatically selected annotations corresponded to endogenous and gut- microbially derived metabolites that conformed to previously published reports. A set of composite spectra matched to experimental spectrum entries of the MoNA were used to establish the ranking ability of each of the 7 compMS2Miner annotation scoring metrics.42 An averaged consensus score of all 7 metrics was determined to be the most effective annotation ranking score based on the weighted mean rank of the MoNA spectrum annotations.
EXPERIMENTAL SECTION
Study Design.
Fourteen age matched (18–22 week) male C57BL/6J mice, seven DIO, and seven NO mice were purchased from The Jackson Laboratories. DIO and NO mice are phenotypically preconditioned beginning at 6 weeks of age by exclusive feeding of source matched diets containing either 60% fat or 10% fat, respectively.
Mice were acclimated for 1 week following arrival. All mice were maintained on their specific diets and were housed in individual cages in the Tulane vivarium under IACUC approved protocols. During the acclimation period stool pellets were collected from each individual mouse. Stool pellets were processed into inoculums, which were used to repopulate intestinal microorganisms following antibiotic treatment.43
One day before antibiotic treatment a small submandibular blood sample (0.2–0.5 mL) was collected from each animal.44 The following day all mice received a single gavage dose (25 mg) of streptomycin in 0.1 mL of sterile water to deplete the gut flora.45
Postantibiotic treatment all mice were housed on wire mesh floors to prevent coprophagia. A second set of blood samples were collected 2 days post antibiotic treatment. Following blood collection the mice received oral gavage inoculation with 0.05 mL of their own fecal preparations to repopulate the gut flora. Fecal inoculation treatments occurred four times over 7 days. The 24 h following the final fecal inoculation treatment, a final stool and blood sample were obtained from each individual mouse. Following collection, all blood samples were processed by centrifugation to separate cellular material from serum/plasma. Processed samples were stored at −20 °C before shipment as a batch.
Sample Preparation and Metabolomic Data Acquisition.
Serum proteins were precipitated prior to UHPLC- HRMS analysis by adding 43 μL of a combination of LC-MS grade (Sigma-Aldrich LC-MS Ultra chromasolv tested for UHPLC—MS) methanol—water (80:20) to an aliquot of sera (2 μL) on ice (final volume 45 μL). The samples were then briefly vortexed and allowed to further precipitate for 3 h on ice. The samples were then ultracentrifuged (10 min, 10345 rcf) to pellet the protein precipitate. Supernatant (35 μL) of each sample was transferred to a high recovery LC-MS grade glass vial and diluted with LC—MS grade water (35 μL) to a final volume of 75 μL. A local quality control was created by equivolume pooling of 4 μL of the supernatant of every sample (n = 39). An equal volume of LC—MS grade water (156 μL) was then added to the pooled supernatant and then briefly vortexed. Samples were transferred to an autosampler (Agilent 1290 autosampler, Santa Clara, CA) thermostatically controlled at 5 °C.
Samples were injected (5 μL injection volume) with a sequential stacked injection using the sample loop with 14 μL of UHPLC-grade water (total volume of 19 μL) on to an Agilent 1290 Infinity microflow UHPLC pumping system (Agilent, Santa Clara, CA). The Agilent Zorbax SB-Aq (1.8 μM × 2.1 mm × 5.1 mm) UHPLC column (Agilent, Santa Clara, CA) was utilized with an Agilent Zorbax-SB-C8 Rapid Resolution Cartridge guard column for the small molecule separation. Mobile phase eluents consisted of A, 0.2% acetic acid in water and B, 0.2% acetic acid in methanol. Following sample injection, the chromatographic gradient was as follows: 98% to 2% mobile phase A from 0 to 13 min, held at 2% A from 13 to 19 min to wash the column, and finally 5 min column equilibration at 98% A.
The UHPLC pumping system was interfaced to an Agilent 6550 Dual AJS quadrupole time-of-flight (Q-TOF) mass spectrometer operated in both negative and positive ionization modes and precalibrated for small molecule applications. A scan rate of 1.67 spectra/s was utilized for MS1 profiling data acquisition which was collected in centroid mode. The dual Agilent Jetstream source parameters were as follows: a sheath gas flow of 14 L/min at a temperature of 400 °C, a fragmentor voltage of 175 V, a nozzle voltage of 300 V, and a capillary voltage of 3500 V. Data-dependent MS2 acquisition was performed using the same gradient elution and instrumental conditions at the end of the column conditioning and at the end of the MS1 profiling worklist. The data-dependent (DDA) acquisition was separated into MS1 and MS2 scan events of MS1 scans (4 spectra/s) where up to 4 precursor masses above 2000 abundance were selected, followed by precursor fragmentation during MS2 scans (2 spectra/s). Ions selected by the quadrupole (~4 Da medium isolation width) were fragmented using 4 fixed collision energies of 10, 20, 40, and 50 eV and each precursor mass was actively excluded after 2 spectra and then released after 30 s. Potentially chimeric spectra were identified postacquisition by compMS2Miner. Following isotope detection for each MS1 precursor scan, any additional potentially interfering ions within the 4 Da isolation width parameter were identified. The spectra were flagged as potentially chimeric if the additional ions which would also be expected to fragment within the collision cell were greater than 40% relative abundance of the precursor ion.
Fifteen data-dependent acquisition (DDA) MS2 files in total were collected (NEG, 6; POS, 9) of which 5 were fully untargeted DDA files (NEG, 2; POS, 3). Features of interest were determined by processing the data prior to the completion of the worklist. The rapid processing of MS2 data with compMS2Miner and a simple mean fold change analysis with a significant proportion of the final MS1 data set allowed annotation of features of interest prior to worklist completion. PCA analysis also allowed identification of any outlying MS1 data files that required reinjection.
The semiuntargeted DDA experiments and samples for reinjection were appended to the MS1 profiling worklist before final sample collection and consisted of a set of preferred ion lists to maximize coverage of unknown features of interest. Preferred ions were interspersed with other precursor ions (above the minimum abundance limit); thus, we refer to these experiments as “semiuntargeted”.
Data Preprocessing and Analysis.
All MS2 data files were converted to the mzXML open file format format (.mzML and .mgf files are also supported) using the MSConvert software (ProteoWizard 3.0.6965 64 bit).46 Peak-picking and nonlinear retention time alignment was performed using XCMS.26–28 Following XCMS preprocessing, the CAMERA package was used to identify isotopes, ESI adducts, and in source fragments, and the custom rule set used was taken from Stanstrup et al.47,48 The R code for the XCMS and CAMERA processing steps and parameters utilized for both positive and negative ionization modes can be found in the Supporting Information pdf file and in the publically available compMS2Explorer applications published alongside this manuscript. Prior to compMS2Miner metabolite annotation, the MS1 peak table was preprocessed. All singleton CAMERA pseudospectra and isotopes were removed. The MS1 peak table was zero-filled with half the smallest peak area, background subtracted (mean fold change samples/blank > 5) and natural log transformed (MetMSLine v1.0.1).49
Features of the preprocessed peak table were then matched to MS2 spectra using compMS2Miner (v2.2.3). The code and parameters used to generate the compMS2Miner results presented here are included in the Supporting Information pdf file.
compMS2Miner Workflow.
A scheme illustrating the compMS2Miner workflow is shown in Scheme 1. The analytical workflow is broken down into six fully automatable stages:
compMS2 class object construction from MS1 features table and either mzML, mzXML, or mgf MS2 data files (compMS2Construct) and possible chimeric spectra identification.50,51
Noise filtration presented here is the dynamic-noise filter (DNF) adapted from the work of Xu et al. (deconvNoise.DNF).52
Composite spectra generation by fragment ion grouping and signal summation. Constituent spectra are combined based on minimum constituent spectra similarity. Possible contaminant spectra defined as repeating isobaric precursors with high spectral similarity were also removed (combineMS2.Ions, combineMS2.Spectra, combineMS2.removeContam).
MS2 substructure annotation using a literature curated internal database (subStructure.Annotate, subStructure.Prob, subStructure.probSummary). A copy of the database is included in the Supporting Information (Table S-1).
Comprehensive metabolite annotation: (i) Metabolomic database annotation with fully customizable electrospray ion and metabolite substructure types. Annotations can also optionally be guided by the MS1-level ESI adducts/in-source fragments detected by software such as CAMERA and included as the fourth column of the initial MS1 feature table (metID.dbAnnotate). The ESI adducts/in-source fragments are automatically interpreted by compMS2Miner by the function adduct2Mass. (ii) Experimental spectral database matching (.msp NIST ASCII database format file) annotation (metID.matchSpectralDB). (iii) Probable/best annotation filtering and substructure scoring (metID.dbProb). (iv) Phase II metabolite prediction based on presence of functional groups for conjugation (metID.predS- MILES). (v) In silico fragmentation prediction using both the MetFrag (v2.3-CL) and the CFM fragmentation graph prediction (v 2.2_win32) softwares with optional automatic annotation (metID.metFragandmetID.CFM).6,53 (vi) Correlation network and spectral similarity (dot product) network graph calculation (metID.corrNetwork and metID.specSimNetwork). Correlation and spectral similarity cutoffs can be automatically optimized based on network density.34,54,55 (vii) Nearest neighbor chemical similarity scoring. A weighted mean of the maximum chemical similarity (Tanimoto similarity metric) of all annotations is calculated for all first-neighbor/adjacent composite spectra connected by correlation and/or fragment and neutral loss spectral similarity. The function provides optional automatic metabolite identification which adds annotations above a minimum MMNNCSS to the metID comments table (metID.chemSim). (viii) Random forest-based recursive feature elimination quantitative structure-retention relationship (QSRR) predictive modeling. This function selects an optimal set of precalculated molecular descriptors (MDs) for the QSRR model (metID.rtPred).56–59 (ix) Mean consensus metabolite identification score calculation based on a user defined set of annotation scores to include such as substructure, mass accuracy, in silico fragmentation, the number of PubMed abstracts from querying the PubMed database, predicted retention time and MMNNCSS (metID.buildConsensus). (x) Optimization of the weighted mean consensus score using the differential evolution search heuristic (metID.optimConsen- sus).36–40 (xi) False positive removal and true positive annotation ranking based upon an average prohibited/pertinant word frequency in randomly sampled abstracts downloaded from the PubMed repository (falsePosIdentify).41 (xii) Chemical taxonomic annotation and prediction based on chemical similarity to the metabolomic databases internal to compMS2Miner (annoCompoundClass). (xiii) False positive and false negative summary calculation and score metric ranking based on confidently annotated metabolites (trueFalseSum). (xiv) Final result publication as a standalone Web application database, a zip file (publishApp), or as an annotated NIST msp format database file (metID.compMS2toMsp). Upon publication, spectral hash codes (splash) are generated for each unique composite spectrum.60
Scheme 1.

Schematic Illustrating the Implementation of the compMS2Miner Metabolite Identification Workflowa a Ideally MS1 profiling and MS2 fragmentation data should be collected simultaneously and under similar experimental conditions. (1) The peak-picker output peak table is matched to MS2 fragmentation data files (.mzXML/.mzML/.mgf open-file formats). (2) MS1 feature matched spectra are then noise filtered (currently a dynamic noise filter). (3) Spectrally similar intrafile and interfile MS2 scans matched to the same precursor are combined by signal summation producing a composite MS2 spectrum. (4) Characteristic neutral loss and fragment ions are identified using a literature-based database, and the intensity of annotated features are summed to give an indication of the metabolite class. (5) Comprehensive metabolite annotation, by accurate mass/spectral database matching combined with biotransformation metabolite prediction and electrospray adduct formation, in silico fragmentation prediction, correlation network visualization, QSRR modeling, chemoinformatic tools, an interactive table visualization, and also PubMed based text-mining to provide a rapid and objective means to assess annotation strength. (6) Data-curation either by shiny app visualization (compMS2Explorer) and online publication, as a zip file or a NIST.msp file output. At any stage of the workflow the data can be visualized to monitor progress.
A detailed description of each stage of the compMS2Miner workflow can be found in the Supporting Information. Additionally a workflow with example data illustrating all of the stages of compMS2Miner processing can be found in the package vignette and individual function documentation pages (compMS2Miner v2.2.3).
RESULTS AND DISCUSSION
The compMS2Miner workflow is illustrated here with a data set of mouse sera maintained on different dietary regimens and also treated with a broad spectrum antibiotic (streptomycin). Metabolites objectively annotated by compMS2Miner were found to be in agreement with previously published reports.
Metabolite annotation strength was established by building a mean consensus of 7 optional score metrics (metID.buildConsensus). Composite spectra were automatically matched to both experimental and virtual spectra of MoNA. Putative MoNA annotations represented a range of both hydrophilic (amino acids, indoles, purines, peptides) and hydrophobic (fatty acids, phospholipids, steroids) compound classes (n = 29) Figure 1A
Figure 1.

(A) Bar plot representing the predicted compound classes and ESI adduct types of composite spectra matched to MoNA entries (n = 173); the majority (~75%) corresponded to virtual spectra of lipids from lipidBlast. (B) Bar plot summarizing the mean, median, and weighted mean ranking ability of the various compMS2Miner scoring metrics. A consensus mean score of all 7 individual scoring metrics was found to provide the most effective ranking ability. For many of the scoring metrics, a percentage of all composite spectra had all zero scores and therefore could not be ranked. (C) Pie chart summarizing the compound classes (n = 74) annotated automatically above a mean consensus score of 0.5 (values ranging between 0 and 1), these automatic compound class annotations accounted for 72% or 569 out of 789 total composite spectra following removal of flagged false positive, no annotations, and remaining potential contaminants (positive and negative modes combined). Six percent (n = 59) of the total composite spectra had no annotations to either Human Metabolome Database (HMDB), Lipid Maps Structure Database (LMSD), or MoNA or were identified as potential contaminants missed by the combineMS2.removeContam function (repeating isobaric precursors but with low spectral similarity). The bulk of the automatically annotated compound classes in the mouse sera samples corresponded to common lipid classes and also prosaic endogenous metabolite classes such as amino acids, steroids, purines, and peptides.
Comprehensive Metabolite Annotation.
Composite spectra of both modes were matched (<10 ppm) to both the HMDB and the LMSD, both of which are internal to the compMS2Miner package.61,62 Annotation of each composite spectrum was guided by the ESI adducts and in-source fragments annotated by the CAMERA package.47,48 In total, 139 unique ESI adducts and in-source fragments were identified by CAMERA in both negative (n = 65) and positive modes (n = 74).
Expected mass shifts for each ESI adduct/in-source fragments identified were automatically calculated (adduct2Mass compMS2Miner v2.2.3) from their text representations (e.g., “[M-H]−”, “ [2M+2CH3OH]2−”, “[M-H+C2H4O2+Na]−”). A list of common mandatory ESI adducts considered for every composite spectrum and mass shifts of the various Phase II metabolites detected such as sulfate, acetyl, and glutathione conjugates were included in the metID.dbAnnotate function. Of the total composite spectra, 859 were matched to the expected masses of 38 731 unique database entries.
Fewer than 10% of the total composite spectra (n = 173) were autonomously matched (dot product spectral similarity >0.65) to experimental and virtual MS2 spectra from the MoNA repository.42 We estimated ~71 000 unique structures (based on InChI key) in the msp files downloaded from MoNA (08/09/2016), and that of these more than half were virtual spectra (~65%) many of which originated from lipidBlast.17 Three quarters of the composite spectra matched to MoNA entries originated from lipidBlast and were therefore virtual spectra. Lipids demonstrate characteristic fragmentation patterns and for many classes of phospholipid virtual spectra would be expected to be highly similar to a chemical standard with relative fragment intensities also not varying fundamentally between instrumental platforms.17 In spite of the risk for false positive annotation, the lipidBlast matches in particular combined with the spectral similarity and correlation network graphs provided an excellent overview of the observed content of our sample set. At minimum, this overview provided a degree of confidence in the annotation of the compound class and a short list of possible structural isomers. Analysis of the network graphs both programmatically (metID.chemSim) and visually (compMS2Explorer) provides further assistance to the user in the annotation of statistically relevant unknowns. The automatic putative MoNA annotations were then utilized to train the QSRR models and also to compare the ranking ability of the annotation scoring metrics.
The mean, median, and weighted mean rank of each scoring metric was calculated for the 7 scoring metrics. The weighted mean rank was calculated to take in to account the effect of the total number of annotations on the ranking capability among the HMDB and LMSD accurate mass annotations. The hierarchy of ranking ability remained the same by any of the measures of central tendency, with the exception of the median ranks of the mass accuracy and CFM scores. N.B. the number of annotations to curated metabolomic/lipidomic (and therefore more relevant) databases such as HMDB and LMSD can often be an order of magnitude lower than the number annotations to extensive chemical structure databases such as ChemSpider and PubMed compound. A barplot summarizing the mean, median and weighted mean rank of each of the 7 scores and the consensus mean score for each ionization mode is shown in Figure 1B.
The hierarchy of ranking ability for each scoring metric was determined by summing the median, mean, and weighted mean ranks of the MoNA annotations. Annotations were not considered if all of the scoring metric values were zero and therefore could not be ranked, e.g., an ESI adduct/in-source fragment type was not available for an in silico fragmentation software or there was no correlation/spectral similarity edge on the network graph between two spectra, for example. The percentage of all zero scores ranged from ~40% for the literature curated substructure annotation score to ~4% for the number of PubMed abstracts returned.
The mean consensus score represented the lowest weighted mean rank of 3 and was consistent for both positive and negative ionization modes. Unsurprisingly, the number of PubMed abstracts score had the second lowest weighted mean rank (4.4), as most of the MoNA entry matches were common phospholipids or commercially available and therefore likely to be frequently represented in scientific publications. This was closely followed by the CFM score (4.5), mass accuracy score (5.3), MetFrag score (6.5), substructure (7.6), MMNNCSS (8.5), and the least effective being the QSRR score (9.2).
For the mean annotation score (BC_meanScore), incorrect ranking was found to be related to structural isomerism such as relative C=C double bond positions for 2 of the MoNA annotated fatty acids (FA), 2 phosphatidylethanolamines (PE), and fatty acid tail lengths of phospholipids for example. For example, in positive mode 4 out of 5 MoNA annotations with a low dot product score turned out to be poorly matched. A threshold of 0.65 (dot product) was established by visual inspection of MoNA matches at a very low cutoff value (0.5) in the negative mode data set. However, there was some difficulty in striking a balance between accounting for instrumental variation and false positive database matches. These false positive matches were found to originate from MoNA entries with noisy spectra which would benefit from some form of filtration.
The chemical similarity score (BC_chemSim/MMNNCSS) leverages both the correlation and spectral similarity network graphs and ranked just above the QSRR score. This method has the advantage of being able to rank annotations regardless of ESI adduct or in-source fragment type. However, this score requires a minimum of a high correlation and/or spectral similarity and therefore biological or structural connection between at least two spectra.
The in silico fragmentation scores (BC_metFragScore and BC_cfmScore) performed well except in the cases of an ESI adduct type not being implemented. The authors note that the full functionality of CFM in particular was not made use of, and the fragmentation graph generation function (fraggraph-gen) was found to be computationally faster and therefore far more practical for larger numbers of structures.
The literature curated substructure score (“BC_subStructure”) performed well only when the compound class of interest was present in the internal database. In the case of the MoNA annotations, many of these characteristic substructures could be identified. However, the “BC_subStructure” score failed when it encountered less common substructures or when there was a metabolite with few characteristic fragment ions/neutral losses at typical collision induced dissociation (CID) energies (i.e., 10–50 eV) such as fatty acids.
To prevent the predicted retention time score from biasing the mean consensus score, the random-forest based QSRR model was calculated for the negative mode data using stringently filtered (>0.9 dot product) positive mode MoNA spectrum annotations and vice versa. The retention time prediction function (metID.rtPred) codifies the molecular descriptor based QSRR modeling described in Cao et al.59 Expectedly, because of the relatively low resolution of UHPLC the BC_rtPred score in isolation performed the least well at correct ranking of MoNA matched spectra. At the very least, the BC_rtPred score could be used to rule out annotations highly deviated from the QSRR model.
Automated Annotation.
Full details of the XCMS, CAMERA, and compMS2Miner parameters and code used for both ionization modes are included in the Supporting Information as a pdf file (generated using the Rmarkdown and knitr packages).63–66 Additionally, the completed output of the compMS2Miner workflow with the top annotation, structures, compound class and relevant scoring metrics can be found as an Excel spreadsheet in Supporting Information (Table S-1). Automatically flagged false positive annotations (n = 76) based on literature text mining accounted for 8% of the composite spectra. A further 6% (n = 59) had either no annotations or were potential contaminants missed by the combineMS2.remove- Contam function (i.e., repeating isobaric precursors but with low spectral similarity). Of the 789 remaining composite spectra, 72% (n = 569) were automatically annotated above a mean consensus score of 0.5 and were composed of 74 unique compound classes taken or predicted from the entries of HMDB and LMSD. A pie chart summarizing the compound classes autonomously annotated by compMS2Miner is shown in Figure 1C. The bulk of the annotated compound class types in the mouse sera samples corresponded to common lipid classes and also prosaic endogenous metabolite classes, such as amino acids, steroids, purines, and peptides annotated 3 or more times. Other compound classes (n = 40) represented on the pie chart were any remaining compound class that was annotated only 1 or 2 times but these also corresponded to expected endogenous metabolite classes such as eicosanoids, bile acids, and purine nucleotides, for example.
Broad compound class annotation can greatly facilitate the annotation of statistically relevant unknown UHPLC-HRMS features. For example, if a handful of unknown UHPLC—HRMS features of interest are targeted for MS2 and therefore considered in isolation, then much of the broader context of the unknowns would be lost such as correlation/spectral similarity to clusters of known compound classes. It can often be the case that an unknown is simply an ESI adduct/in-source fragment type that was either not considered or was not detected in MS1 profiling data by deconvolution softwares such as CAMERA due to parametrization (the exhaustive lists of Stanstrup et al.48 are the internal default ESI adduct/in-source fragment types considered by the metID.dbAnnotate function).
The metID.buildConsensus function mean annotation ranking score combines evidence from previous functions to rank annotations and also allows automatic annotation above a minimum mean consensus score to the comments table. The weight each metric contributes to the mean consensus score can also be optimized using a differential evolution function metID.optim-Consensus which provided a modest improvement in the mean ranking of the validation set metabolites.36–40 This takes all of the automatically or manually added annotations in the comments table and seeks to globally minimize the mean rank of these identified metabolites by adjusting the contribution of each score included to the weighted mean.
By setting the mean consensus score to just above zero (0.1), the most highly ranked annotation for each composite spectrum can be automatically added to the metID comments table. Low scoring annotations for reasons such as low numbers of PubMed IDs, poor mass accuracy agreement due to poor ion statistics/bioinformatic errors, or poor substructure scoring can then be scrutinized. In order to mitigate for false positive annotations, we developed the function falsePosIdentify which seeks to identify potential false positives based on a minimum mean summed prohibited word frequency of text-mined and cleaned abstracts returned from the PubMed entrez system.41 With a minimum mean summed frequency score of 0.6–0.61 per abstract and the prohibited words “drug”, “pesticide”, “antibiotic”, and “placebo”. We were able to flag 76 false positive annotations. Following false positive flagging and/or removal the broad compound class can be added to the metID comments table based on its presence in HMDB, LMSD, DrugBank, or T3DB. If not present, the possible compound class can be predicted based on the most highly ranked Tanimoto chemical similarity score and most frequent compound class (if tied) above a minimum similarity score (0.8).
Alternatively, a true positive rank can be calculated by textmining sampled abstracts downloaded through the PubMed Entrez system.41 Abstracts are cleaned and the word frequencies summarized, an average frequency of a list of keywords of interest can then be calculated. This average key word of interest frequency can then be used to rank the most likely annotation based on literature reports and provides a rapid means to summarize any available literature for a compound on PubMed.
Spectra matched to experimental spectrum databases such as MoNA can be considered to be well annotated and in combination with several lines of evidence; as is the case with the compMS2Miner workflow; the identification may be considered a metabolomics standards initiative (MSI) level 2–3 identification.67 These multiple lines of evidence when considered collectively provide a means to broadly comprehend the chemical constituents of a sample type for which MS2 data has been obtained. This overview of the MS2 data and the combined scoring metrics can serve to efficiently shortlist available commercial standards which are also often prohibitively expensive.
Biological Validation of compMS2Miner Annotations.
Putative metabolites automatically annotated by compMS2Miner corresponded to serum phospholipids but also purines/nucleotides, steroids, amino acids, vitamins, hormones, fatty acids, eicosanoids, and bile acids. Many of the putative annotations were also found to be affected by both dietary regimen and antibiotic treatment and conformed to previous reports.
A correlation network map of the UHPLC–HRMS features matched to MS2 data is shown in Figure 2A,B (generated by Cytoscape v3.4.0).68 In Figure 2A, metabolites affected by the dietary regimen are shown and in metabolites affected by antibiotic treatment are shown. Box-and-whisker plots highlight metabolites which were affected by diet or antibiotic treatment.
Figure 2.

Correlation network map showing highly correlated UHPLC—HRMS features which were matched to MS2 spectra by compMS2Miner. The color of each node corresponds to the instrument polarity (blue = negative mode, red = positive mode). In each panel, metabolites which were affected (>1.5 mean-fold change) by diet (A) and antibiotic treatment (B) are shown as enlarged nodes. Network nodes are connected by an edge above a minimum correlation coefficient (>0.8 Spearman’s Rho). Box-and-whisker plots highlight various automatically annotated metabolites with previously reported association with both diet and antibiotic treatment. Box-and-whisker plots correspond to the following putative annotations: (i) vitamin D3, (ii) phosphatidylcholine (PC)(32:1), (iii) phosphatidylserine (PS) (38:1), (iv) lysophosphatidylinositol (lysoPI)(18:0), (v) adenosine, (vi) inosine, (vii) lactosyl-ceramide (lac-Cer), (viii) corticosterone, (ix) arachidonic acid, (x) taurocholic acid, (xi) lysophosphatidylcholine (lysoPC)(15:0), (xii) PC(42:3), (xiii) quinaldic acid, (xix) indoxyl sulfate, (xx) phosphatidylserine (PS)(39:1), (xxi) leukotriene E4, (xxii) hypoxanthine, (xxiii) p-cresol sulfate.
Diet.
Many metabolites annotated by compMS2Miner were associated with the dietary regimen of the experimental animals, i.e., >1.5 mean-fold change. Elevated concentrations of many serum phospholipids were observed in the DIO mice due to higher dietary fat intake.69 We also observed elevated serum concentrations of arachidonic acid, corticosterone, lactosylceramide, and taurocholic acid which have been previously reported in diet induced obese mice.70–72 Conversely, adenosine and it is major degradation product inosine were found to be in higher concentration in the NO mice both of which have been previously reported as depleted in obese mouse samples. Interestingly, adenosine and inosine have been shown to have an anti-inflammatory effect in the intestine and also to be protective against DIO and diabetes in mice.73–75 In line with previous findings, a phosphatidylcholine containing a 16:1 fatty acid tail was also elevated in the NO mice.69
Antibiotic Treatment.
Treatment of the experimental mice with the antibiotic streptomycin resulted in reduced serum concentrations of the gut microbial protein fermentation products p-cresol sulfate (tyrosine catabolism) and indoxyl sulfate (tryptophan catabolism) 2 days following treatment.76–80 Interestingly, on the 10th day following antibiotic treatment, relative indoxyl sulfate serum concentrations returned to levels similar to those observed prior to pretreatment. However, p-cresol sulfate concentrations failed to return 10 days post treatment. This observation indicated a longer term or perhaps permanent shift in the gut microbial ecology and thus metabolic potential following antibiotic treatment. A possible explanation is that the microbes responsible for p-cresol sulfate formation either were not present or failed to persist in the preserved preantibiotic treatment fecal pellets utilized for reinoculation. Hypoxanthine levels were also lowered 2 days postantibiotic treatment indicating the absence of Escherichia coli and other bacteria known to participate in purine metabolism.81 A proinflammatory eicosonoid leukotriene E4, an important mediator in the gut-immune axis, was also found to be decreased following antibiotic knock-down of the gut microbiota.82,83
Many of the annotated metabolites affected by antibiotic treatment corresponded to serum phospholipids. The gut microbiota is known to play a key role in lipolysis, and we observed a concomitant elevation of serum phospholipids and a decrease in the lyso-forms of serum lipid subtypes 2 days postantibiotic treatment.79 Furthermore, we observed the elevation in serum concentration of bile acid taurocholic acid 2 days postantibiotic treatment. The elevation of bile acids such as taurocholic acid following streptomycin treatment results from an absence of gut microbial degradation of unconjugated bile salts.84
CONCLUSIONS
Following potential false positive removal, a diversity of metabolite classes were rapidly and automatically annotated by compMS2Miner (n = 74, above a mean consensus score of 0.5). A set of composite spectra matched to the MoNA repository was found to most accurately annotated by the compMS2Miner mean consensus score annotation score (a combination of 7 individual scoring metrics). Putative annotations were further strengthened by biological plausibility and previous literature reports.
The compMS2Miner R package represents a comprehensive, integrated open-source workflow and data-sharing mechanism for UHPLC-HRMS based metabolite identification. It unifies many useful metabolite identification tools, including spectral-noise filtering, generation of composite spectra, annotation of fragments and neutral losses, metabolomic-database annotation, chemoinformatic tools, and identification of compound classes. To assist metabolomic investigators in rapidly interpreting their data, the graphical user interface compMS2Explorer combines many useful visualization tools, including literature text-mining, correlation and spectral similarity network visualizations, an interactive annotation table, metabolite prediction, text-mining based false positive removal/true positive ranking, compound class annotation, and in silico fragmentation software.
Applications such as compMS2Explorer also provide an avenue to publish metabolite assignments and to further elucidate unknown identifications alongside metabolomic/lipidomic publications. This approach could substantially improve data-sharing and transparency. Future work will entail assessment of the accuracy and precision of the package against additional benchmark data sets and recursive testing and improvement as further functions/methods are added.
Supplementary Material
ACKNOWLEDGMENTS
We gratefully acknowledge the assistance of Agilent Technologies (Santa Clara, CA, USA) for the loans of the liquid- chromatography mass-spectrometry instruments used in these analyses.
Funding
This research was supported by NIEHS under Award Numbers P50ES018172 and P42ES004705, by Tulane University’s 170th Early Career Professor Award, and by a postdoctoral fellowship from the Environment and Health Fund, Jerusalem, Israel. The content is solely the responsibility of the authors and does not necessarily represent the official views of either NIH or NIEHS.
Footnotes
The authors declare no competing financial interest.
The compMS2Miner package with example data, a detailed vignette, and documentation is freely available on our GitHub repository (https://github.com/WMBEdmands/compMS2Miner), with stable package versions concurrently available on the Zenodo repository (https://zenodo.org/). The output of the compMS2Miner workflow for the mouse serum data set presented within this manuscript can be viewed publically as two separate compMS2Explorer Web applications for both positive (https://wmbedmands.shinyapps.io/compMS2_mouseSera_POS) and negative (https://wmbedmands.shinyapps.io/compMS2_mouseSera_NEG) modes. NIST msp files for both data sets are also hosted on our GitHub repository (https://github.com/WMBEdmands)
ASSOCIATED CONTENT
Supporting Information
The Supporting Information is available free of charge on the ACS Publications website at DOI: 10.1021/acs.analchem.6b02394.
Detailed description of all functions of the compMS2Miner workflow (PDF)
File generated from R containing the XCMS, CAMERA, and compMS2Miner R code and all parameters used to analyze the mouse sera data for both positive and negative modes (PDF)
Excel spreadsheet of 264 MS2 fragments and neutral losses compiled from literature sources and a table of the metabolites automatically annotated with compMS2Miner (XLSX)
REFERENCES
- (1).Rathahao-Paris E; Alves S; Junot C; Tabet J-C Metabolomics 2016, 12, 1–15. [Google Scholar]
- (2).Li L; Li R; Zhou J; Zuniga A; Stanislaus AE; Wu Y; Huan T; Zheng J; Shi Y; Wishart DS; Lin G Anal. Chem 2013, 85, 3401–3408. [DOI] [PubMed] [Google Scholar]
- (3).Wolf S; Schmidt S; Muller-Hannemann M; Neumann S BMC Bioinf 2010, 11, 148. [DOI] [PMC free article] [PubMed] [Google Scholar]
- (4).Wang Y; Kora G; Bowen BP; Pan C Anal. Chem 2014, 86, 9496–9503. [DOI] [PubMed] [Google Scholar]
- (5).Kangas LJ; Metz TO; Isaac G; Schrom BT; Ginovska- Pangovska B; Wang L; Tan L; Lewis RR; Miller JH Bioinformatics 2012, 28, 1705–1713. [DOI] [PMC free article] [PubMed] [Google Scholar]
- (6).Allen F; Pon A; Wilson M; Greiner R; Wishart D Nucleic Acids Res 2014, 42, W94–W99. [DOI] [PMC free article] [PubMed] [Google Scholar]
- (7).Heinonen M; Shen H; Zamboni N; Rousu J Bioinformatics 2012, 28, 2333–2341. [DOI] [PubMed] [Google Scholar]
- (8).Kessler N; Neuweger H; Bonte A; Langenkamper G; Niehaus K; Nattkemper TW; Goesmann A Bioinformatics 2013, 29, 2452–2459. [DOI] [PMC free article] [PubMed] [Google Scholar]
- (9).Heinonen M; Rantanen A; Mielikainen T; Kokkonen J; Kiuru J; Ketola RA; Rousu J Rapid Commun. Mass Spectrom 2008, 22, 3043–3052. [DOI] [PubMed] [Google Scholar]
- (10).Menikarachchi LC; Cawley S; Hill DW; Hall LM; Hall L; Lai S; Wilder J; Grant DF Anal. Chem 2012, 84, 9388–9394. [DOI] [PMC free article] [PubMed] [Google Scholar]
- (11).Allen F; Greiner R; Wishart D Metabolomics 2015, 11, 98–110. [Google Scholar]
- (12).Tsugawa H; Arita M; Kanazawa M; Ogiwara A; Bamba T; Fukusaki E Anal. Chem 2013, 85, 5191–5199. [DOI] [PubMed] [Google Scholar]
- (13).van der Hooft JJJ; Wandy J; Barrett MP; Burgess KEV; Rogers S Proc. Natl.Acad. Sci U. S.A 2016, 113, 13738–13743. [DOI] [PMC free article] [PubMed] [Google Scholar]
- (14).Tsugawa H; Cajka T; Kind T; Ma Y; Higgins B; Ikeda K; Kanazawa M; VanderGheynst J; Fiehn O; Arita M Nat. Methods 2015, 12, 523–526. [DOI] [PMC free article] [PubMed] [Google Scholar]
- (15).Gerlich M; Neumann SJ Mass Spectrom. 2013, 48, 291–298. [DOI] [PubMed] [Google Scholar]
- (16).Huan T; Tang C; Li R; Shi Y; Lin G; Li L Anal. Chem 2015, 87, 10619–10626. [DOI] [PubMed] [Google Scholar]
- (17).Kind T; Liu K-H; Lee DY; DeFelice B; Meissen JK; Fiehn O Nat. Methods 2013, 10, 755–758. [DOI] [PMC free article] [PubMed] [Google Scholar]
- (18).Egertson JD; MacLean B; Johnson R; Xuan Y; MacCoss MJ Nat. Protoc 2015, 10, 887–903. [DOI] [PMC free article] [PubMed] [Google Scholar]
- (19).Chambers MC; Maclean B; Burke R; Amodei D; Ruderman DL; Neumann S; Gatto L; Fischer B; Pratt B; Egertson J; Hoff K; Kessner D; Tasman N; Shulman N; Frewen B; Baker TA; Brusniak M-Y; Paulse C; Creasy D; Flashner L; Kani K; Moulding C; Seymour SL; Nuwaysir LM; Lefebvre B; Kuhlmann F; Roark J; Rainer P; Detlev S; Hemenway T; Huhmer A; Langridge J; Connolly B; Chadick T; Holly K; Eckels J; Deutsch EW; Moritz RL; Katz JE; Agus DB; MacCoss M; Tabb DL; Mallick P Nat. Biotechnol 2012, 30, 918–920. [DOI] [PMC free article] [PubMed] [Google Scholar]
- (20).Martens L; Chambers M; Sturm M; Kessner D; Levander F; Shofstahl J; Tang WH; Rompp A; Neumann S; Pizarro AD; Montecchi-Palazzi L; Tasman N; Coleman M; Reisinger F; Souda P; Hermjakob H; Binz P-A; Deutsch EW Mol. Cell. Proteomics 2011, 10, R110.000133. [DOI] [PMC free article] [PubMed] [Google Scholar]
- (21).Pedrioli PGA; Eng JK; Hubley R; Vogelzang M; Deutsch EW; Raught B; Pratt B; Nilsson E; Angeletti RH; Apweiler R; Cheung K; Costello CE; Hermjakob H; Huang S; Julian RK; Kapp E; McComb ME; Oliver SG; Omenn G; Paton NW; Simpson R; Smith R; Taylor CF; Zhu W; Aebersold R Nat. Biotechnol 2004, 22, 1459–1466. [DOI] [PubMed] [Google Scholar]
- (22).Keller A; Eng J; Zhang N; Li X.-j.; Aebersold R Mol. Syst. Biol 2005, 1, E1. [DOI] [PMC free article] [PubMed] [Google Scholar]
- (23).Kessner D; Chambers M; Burke R; Agus D; Mallick P Bioinformatics 2008, 24, 2534–2536. [DOI] [PMC free article] [PubMed] [Google Scholar]
- (24).Tierney L; Rossini AJ; Li N; Sevcikova H Snow: Simple Network of Workstations, version 0.4–2; https://CRAN.R-project.org/package=snow (accessed October 2016).
- (25).Analytics R; Weston S Foreach: Provides for Each Looping Construct for r, version 1.4.3; https://CRAN.R-project.org/package=foreach (accessed October 2016).
- (26).Smith CA; Want EJ; O’Maille G; Abagyan R; Siuzdak G Anal. Chem. 2006, 78, 779–787. [DOI] [PubMed] [Google Scholar]
- (27).Tautenhahn R; Boettcher C; Neumann S BMC Bioinf. 2008, 9, 504. [DOI] [PMC free article] [PubMed] [Google Scholar]
- (28).Benton HP; Want EJ; Ebbels TM D. Bioinformatics 2010, 26, 2488. [DOI] [PubMed] [Google Scholar]
- (29).Cao Y; Charisi A; Cheng L-C; Jiang T; Girke T Bioinformatics 2008, 24, 1733–1734. [DOI] [PMC free article] [PubMed] [Google Scholar]
- (30).Horan K; Girke T ChemmineOB: R interface to a subset of openBabel functionalities, version 1.12.0; https://github.com/girke-lab/ChemmineOB (accessed October 2016).
- (31).Chang W; Cheng J; Allaire J; Xie Y; McPherson J Shiny: Web application framework for r, version 1.0.0; https://CRAN.R-project.org/package=shiny (accessed January 2017).
- (32).Xie Y DT: A wrapper of the javaScript library ‘dataTables, version 0.2; https://CRAN.R-project.org/package=DT (accessed October 2016).
- (33).Fan FY PubMedWordcloud: Pubmed word clouds, version 0.3.3; https://CRAN.R-project.org/package=PubMedWordcloud (accessed January 2017).
- (34).Csardi G; Nepusz T InterJournal Complex Systems 2006, 1, 1695. [Google Scholar]
- (35).Owen J Rhandsontable: Interface to the handsontable.js library, version 0.3.4; https://CRAN.R-project.org/package=rhandsontable (accessed December 2016).
- (36).Ardia D; Mullen KM; Peterson BG; Ulrich J DEoptim: Differential evolution in R, version 2.2–4; https://CRAN.R-project.org/package=DEoptim (accessed January 2017).
- (37).Mullen K; Ardia D; Gil D; Windover D; Cline JJ Stat. Softw 2011, 40, 1–26. [Google Scholar]
- (38).Ardia D; Boudt K; Carl P; Mullen KM; Peterson BG R J. 2011, 3, 27–34. [Google Scholar]
- (39).Ardia D; David J; Arango O; Gomez NDG Wilmott Magazine 2011, 55, 76–79. [Google Scholar]
- (40).Price KV; Storn RM; Lampinen JA Differential Evolution: A Practical Approach to Global Optimization; Springer-Verlag: Berlin, Germany, 2006. [Google Scholar]
- (41).Roberts RJ Proc. Natl. Acad. Sci. U. S. A 2001, 98, 381–382. [DOI] [PMC free article] [PubMed] [Google Scholar]
- (42).Horai H; Arita M; Kanaya S; Nihei Y; Ikeda T; Suwa K; Ojima Y; Tanaka K; Tanaka S; Aoshima K; Oda Y; Kakazu Y; Kusano M; Tohge T; Matsuda F; Sawada Y; Hirai MY; Nakanishi H; Ikeda K; Akimoto N; Maoka T; Takahashi H; Ara T; Sakurai N; Suzuki H; Shibata D; Neumann S; Iida T; Tanaka K; Funatsu K; Matsuura F; Soga T; Taguchi R; Saito K; Nishioka TJ Mass Spectrom. 2010, 45, 703–714. [DOI] [PubMed] [Google Scholar]
- (43).Willing BP; Vacharaksa A; Croxen M; Thanachayanont T; Finlay BB PLoS One 2011, 6, e26988. [DOI] [PMC free article] [PubMed] [Google Scholar]
- (44).Golde WT; Gollobin P; Rodriguez LL Lab Anim. 2005, 34, 39–43. [DOI] [PubMed] [Google Scholar]
- (45).Myers-Morales T; Bussell KM; D’Orazio SE F1000Research 2013, 1, 2–177. [DOI] [PMC free article] [PubMed] [Google Scholar]
- (46).Chambers MC; Maclean B; Burke R; Amodei D; Ruderman DL; Neumann S; Gatto L; Fischer B; Pratt B; Egertson J; Hoff K; Kessner D; Tasman N; Shulman N; Frewen B; Baker TA; Brusniak M-Y; Paulse C; Creasy D; Flashner L; Kani K; Moulding C; Seymour SL; Nuwaysir LM; Lefebvre B; Kuhlmann F; Roark J; Rainer P; Detlev S; Hemenway T; Huhmer A; Langridge J; Connolly B; Chadick T; Holly K; Eckels J; Deutsch EW; Moritz RL; Katz JE; Agus DB; MacCoss M; Tabb DL; Mallick P Nat. Biotechnol 2012, 30, 918–920. [DOI] [PMC free article] [PubMed] [Google Scholar]
- (47).Kuhl C; Tautenhahn R; Boettcher C; Larson TR; Neumann S Anal. Chem. 2012, 84, 283–289. [DOI] [PMC free article] [PubMed] [Google Scholar]
- (48).Stanstrup J; Gerlich M; Dragsted LO; Neumann S Anal. Bioanal. Chem 2013, 405, 5037–5048. [DOI] [PubMed] [Google Scholar]
- (49).Edmands WMB; Barupal DK; Scalbert A Bioinformatics 2015, 31,788–790. [DOI] [PMC free article] [PubMed] [Google Scholar]
- (50).Pedrioli PGA; Eng JK; Hubley R; Vogelzang M; Deutsch EW; Raught B; Pratt B; Nilsson E; Angeletti RH; Apweiler R; Cheung K; Costello CE; Hermjakob H; Huang S; Julian RK; Kapp E; McComb ME; Oliver SG; Omenn G; Paton NW; Simpson R; Smith R; Taylor CF; Zhu W; Aebersold R Nat. Biotechnol 2004, 22, 1459–1466. [DOI] [PubMed] [Google Scholar]
- (51).Deutsch EW Mol. Cell. Proteomics 2012, 11, 1612–1621. [DOI] [PMC free article] [PubMed] [Google Scholar]
- (52).Xu H; Freitas MA BMC Bioinf. 2010, 11, 436. [DOI] [PMC free article] [PubMed] [Google Scholar]
- (53).Ruttkies C; Schymanski EL; Wolf S; Hollender J; Neumann SJ Cheminf. 2016, 8, 3. [DOI] [PMC free article] [PubMed] [Google Scholar]
- (54).Aoki K; Ogata Y; Shibata D Plant Cell Physiol. 2007, 48, 381–390. [DOI] [PubMed] [Google Scholar]
- (55).van Verk MC; Bol JF; Linthorst HJ BMC Plant Biol. 2011, 11, 88. [DOI] [PMC free article] [PubMed] [Google Scholar]
- (56).Guha RJ Stat. Softw 2007, 18,18. [Google Scholar]
- (57).Kuhn M; Wing J; Weston S; Williams A; Keefer C; Engelhardt A; Cooper T; Mayer Z; Kenkel B; R Core Team; Benesty M; Lescarbeau R; Ziem A; Scrucca L; Tang Y; Candan C; Hunt T Caret: Classification and regression training, version 6.0–73; https://CRAN.R-project.org/package=caret (accessed January 2017).
- (58).Liaw A; Wiener M R News 2002, 2, 18–22. [Google Scholar]
- (59).Cao M; Fraser K; Huege J; Featonby T; Rasmussen S;Jones C Metabolomics 2015, 11, 696–706. [DOI] [PMC free article] [PubMed] [Google Scholar]
- (60).Wohlgemuth G; Mehta SS; Mejia RF; Neumann S; Pedrosa D; Pluskal T; Schymanski EL; Willighagen EL; Wilson M; Wishart DS; Arita M; Dorrestein PC; Bandeira N; Wang M; Schulze T; Salek RM; Steinbeck C; Nainala VC; Mistrik R; Nishioka T; Fiehn O Nat. Biotechnol 2016, 34, 1099–1101. [DOI] [PMC free article] [PubMed] [Google Scholar]
- (61).Wishart DS; Tzur D; Knox C; Eisner R; Guo AC; Young N; Cheng D; Jewell K; Arndt D; Sawhney S; Fung C; Nikolai L; Lewis M; Coutouly M-A; Forsythe I; Tang P; Shrivastava S; Jeroncic K; Stothard P; Amegbey G; Block D; Hau DD; Wagner J; Miniaci J; Clements M; Gebremedhin M; Guo N; Zhang Y; Duggan GE; MacInnis GD; Weljie AM; Dowlatabadi R; Bamforth F; Clive D; Greiner R; Li L; Marrie T; Sykes BD; Vogel HJ; Querengesser L Nucleic Acids Res. 2007, 35 (Database), D521–D526. [DOI] [PMC free article] [PubMed] [Google Scholar]
- (62).Sud M; Fahy E; Cotter D; Brown A; Dennis EA; Glass CK; Merrill AH; Murphy RC; Raetz CRH; Russell DW; Subramaniam S Nucleic Acids Res. 2007, 35 (Database), D527–D532. [DOI] [PMC free article] [PubMed] [Google Scholar]
- (63).Allaire J; Cheng J; Xie Y; McPherson J; Chang W; Allen J; Wickham H; Atkins A; Hyndman R Rmarkdown: Dynamic documents for r, version 1.3; https://CRAN.R-project.org/package=rmarkdown (accessed January 2017).
- (64).Xie Y Knitr: A general-purpose package for dynamic report generation in r, version 1.15.1; https://cran.r-project.org/package=knitr (accessed December 2016).
- (65).Xie Y Dynamic Documents with R and knitr, 2nd ed.; Chapman, Hall/CRC: Boca Raton, FL, 2015. [Google Scholar]
- (66).Xie Y, Stodden V, Leisch F, Peng RD Implementing Reproducible Computational Research; Chapman, Hall/CRC: Boca Raton, FL, 2014. [Google Scholar]
- (67).Sansone S-A; Fan T; Goodacre R; Griffin JL; Hardy NW; Kaddurah-Daouk R; Kristal BS; Lindon J; Mendes P; Morrison N; Nikolau B; Robertson D; Sumner LW; Taylor C; van der Werf M; van Ommen B; Fiehn O Nat. Biotechnol 2007, 25, 846–848. [DOI] [PubMed] [Google Scholar]
- (68).Shannon P Genome Res. 2003, 13, 2498–2504. [DOI] [PMC free article] [PubMed] [Google Scholar]
- (69).Eisinger K; Liebisch G; Schmitz G; Aslanidis C; Krautbauer S; Buechler C Int. J. Mol. Sci 2014, 15, 2991–3002. [DOI] [PMC free article] [PubMed] [Google Scholar]
- (70).Kubeck R; Bonet-Ripoll C; Hoffmann C; Walker A; Muller VM; Schuppel VL; Lagkouvardos I; Scholz B; Engel K-H; Daniel H; Schmitt-Kopplin P; Haller D; Clavel T; Klingenspor M Mol. Metab 2016, 5, 1162–1174. [DOI] [PMC free article] [PubMed] [Google Scholar]
- (71).Shah C; Yang G; Lee I; Bielawski J; Hannun YA; Samad FJ Biol. Chem 2008, 283, 13538–13548. [DOI] [PMC free article] [PubMed] [Google Scholar]
- (72).Qi Y; Jiang C; Cheng J; Krausz KW; Li T; Ferrell JM; Gonzalez FJ; Chiang JY Biochim. Biophys. Acta, Mol. Cell Biol. Lipids 2015, 1851, 19–29. [DOI] [PMC free article] [PubMed] [Google Scholar]
- (73).Gnad T; Scheibler S; von Kugelgen I; Scheele C; Kili’c A; Glode A; Hoffmann LS; Reverte-Salisa L; Horn P; Mutlu S; El- Tayeb A; Kranz M; Deuther-Conrad W; Brust P; Lidell ME; Betz MJ; Enerback S; Schrader J; Yegutkin GG; Muller CE; Pfeifer A Nature 2014, 516, 395–399. [DOI] [PubMed] [Google Scholar]
- (74).Pfalzer AC; Nesbeth P-DC; Parnell LD; Iyer LK; Liu Z; Kane AV; Chen C-YO; Tai AK; Bowman TA; Obin MS; Mason JB; Greenberg AS; Choi S-W; Selhub J; Paul L; Crott JW PLoS One 2015, 10, e0135758. [DOI] [PMC free article] [PubMed] [Google Scholar]
- (75).Mabley J; Rabinovitch A Mol. Med 2003, 9, 1. [Google Scholar]
- (76).Wikoff WR; Anfora AT; Liu J; Schultz PG; Lesley SA; Peters EC; Siuzdak G Proc. Natl. Acad. Sci. U. S. A 2009,106, 3698–3703. [DOI] [PMC free article] [PubMed] [Google Scholar]
- (77).Aronov PA; Luo FJG; Plummer NS; Quan Z; Holmes S; Hostetter TH; Meyer TW J. Am. Soc. Nephrol 2011, 22, 1769–1776. [DOI] [PMC free article] [PubMed] [Google Scholar]
- (78).Carmona M; Zamarro MT; Blazquez B; Durante-Rodriguez G; Juarez JF; Valderrama JA; Barragan MJL; Garcia JL; Diaz E Microbiol. Mol. Biol. Rev 2009, 73, 71–133. [DOI] [PMC free article] [PubMed] [Google Scholar]
- (79).Frohlich EE; Farzi A; Mayerhofer R; Reichmann F; Ja can A; Wagner B; Zinser E; Bordag N; Magnes C; Frohlich E; Kashofer K; Gorkiewicz G; Holzer P Brain, Behav., Immun 2016, 56, 140–155. [DOI] [PMC free article] [PubMed] [Google Scholar]
- (80).Meijers BKI; Evenepoel P Nephrol., Dial., Transplant 2011, 26, 759–761. [DOI] [PubMed] [Google Scholar]
- (81).Guo Z; Zhang J; Wang Z; Ang KY; Huang S; Hou Q; Su X; Qiao J; Zheng Y; Wang L; Koh E; Danliang H; Xu J; Lee YK; Zhang H Sci. Rep 2016, 6, 20602. [DOI] [PMC free article] [PubMed] [Google Scholar]
- (82).Stanke-Labesque F; Pofelski J; Moreau-Gaudry A; Bessard G; Bonaz B Inflamm. Bowel Dis 2008, 14, 769–774. [DOI] [PubMed] [Google Scholar]
- (83).Mohajer B; Ma TY Prostaglandins Other Lipid Mediators 2000, 61, 125–143. [DOI] [PubMed] [Google Scholar]
- (84).Ridlon JM; Kang DJ; Hylemon PB; Bajaj JS Curr. Opin. Gastroenterol 2014, 30, 332–338. [DOI] [PMC free article] [PubMed] [Google Scholar]
Associated Data
This section collects any data citations, data availability statements, or supplementary materials included in this article.