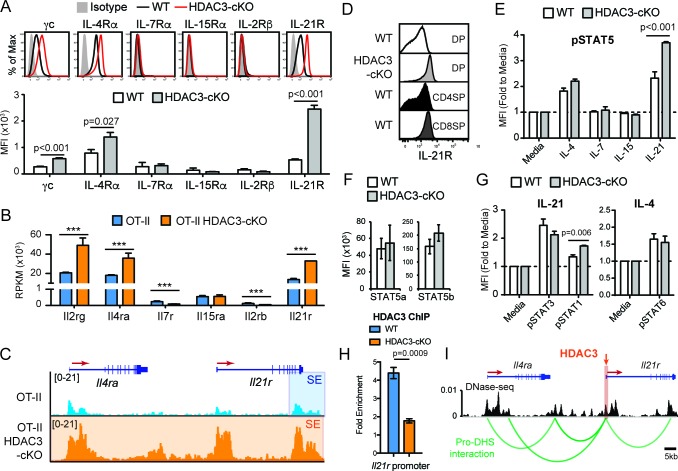
Figure 5. DP thymocytes from HDAC3-cKO mice show increased STAT5 activation in response to IL-21.
(A) Surface expression of cytokine receptor chains γc, IL-4Rα, IL-7Rα, IL-15Rα, IL-2Rβ, and IL-21R on DP thymocytes from WT and HDAC3-cKO mice. Flow cytometric plots have an isotype control to illustrate background level of expression. (B) Gene expression (RNA-seq) of Il2rg, Il4ra, Il7r, Il15ra, Il2rb, and Il21r in Immature (DP) cells from OT-II and OT-II HDAC3-cKO mice. (C) Snapshot of H3K27ac ChIP-seq tracks at the Il4ra and Il21r gene loci in Immature (DP) thymocytes from OT-II and OT-II HDAC3-cKO mice. Shaded regions identify super-enhancers. (D) Protein expression of IL-21R on DP, CD4SP and CD8SP thymocytes from WT mice and DP thymocytes from HDAC3-cKO mice. (E) pSTAT5 levels in DP thymocytes from WT and HDAC3-cKO mice after 10 min ex vivo stimulation with IL-21, IL-15, IL-7, IL4, or media alone. (F) Protein expression of STAT5a and STAT5b in DP thymocytes from WT and HDAC3-cKO mice. (G) pSTAT3 and pSTAT1 levels after a 10 min in vitro IL-21 stimulation, and pSTAT6 levels after IL-4 stimulation of DP thymocytes from WT and HDAC3-cKO mice. (H) Quantitative ChIP (qChIP) of HDAC3 binding at the Il21r promoter in DP thymocytes from WT and HDAC3-cKO mice. Graph depicts fold enrichment over Rpl30 (n = 4 mice/group from four indpendent experiments). (I) DNase-seq and Hi-C arc plots at the Il4ra and Il21r gene loci in DP thymocytes and pooled DN3-to-DP thymocytes, respectively. Shaded region highlights where HDAC3 binds, as shown in Figure 5H. (DHS, DNA hypersensitivity sites). (A, E, G) Bar graph shows mean ± SEM of MFI from 4 to 5 mice from at least three independent experiments. (D, H) Plots are representative of at least three mice from three independent experiments. (F) Bar graph shows mean ± SEM of MFI from three mice from two independent experiments. (***, p < 0.001). See also Figure 5—figure supplements 1–2.
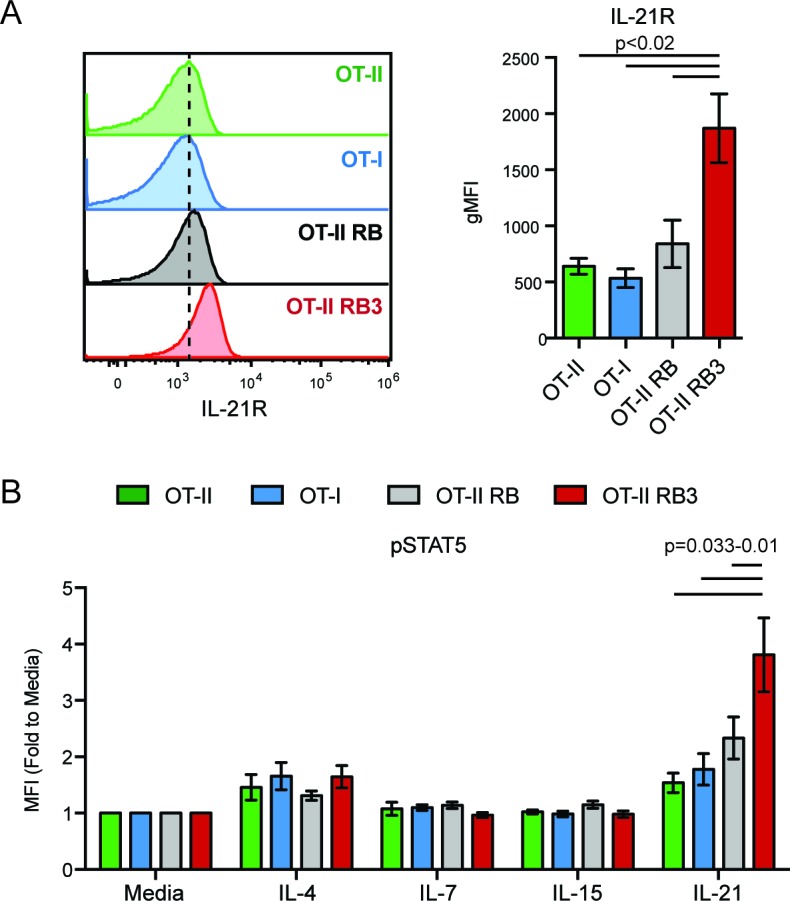
Figure 5—figure supplement 1. IL-21R expression and signaling in OT-II RB3 mice.


