Abstract
Purpose
Data from claims and electronic medical records (EMRs) are frequently used to identify clinical events (eg, cancer diagnosis, stroke). However, accurately determining the time of clinical events can be challenging, and the methods used to generate time estimates are underdeveloped. We sought to develop an approach to determine the time of a clinical event—cancer recurrence—using high-dimensional longitudinal structured data.
Methods
Manual chart abstraction provided information regarding the actual time of cancer recurrence. These data were linked to claims from Medicare or structured EMR data from the Cancer Research Network, which were used to determine time of recurrence for patients with lung or colorectal cancer. We analyzed the longitudinal profile of codes that could help determine the time of recurrence, adjusted for systematic differences between code dates and recurrence dates, and integrated time estimates from different codes to empirically derive an optimal algorithm.
Results
We identified twelve code groups that could help determine the time of recurrence. Using claims data for patients with lung cancer, the optimal algorithm consisted of three code groups and provided an average prediction error of 4.8 months. Using EMR data or applying this approach to patients with colorectal cancer yielded similar results.
Conclusion
Time estimates were improved by selecting codes not necessarily the same as those used to identify recurrence, combining time estimates from multiple code groups, and adjusting for systematic bias between code dates and recurrence dates. Improving the accuracy of time estimates for clinical events can facilitate research, quality measurement, and process improvement.
INTRODUCTION
Enormous quantities of data are collected by administrative systems and electronic medical records (EMRs) during the routine delivery of health care. Increasingly, these data are being used for reasons other than just delivering care (EMR systems) and requesting reimbursement (administrative systems), including population health management; epidemiologic, comparative effectiveness, and outcomes research; quality measurement; and operational improvement. For many of these secondary uses, an essential first step is to identify which patients have a specific condition or have experienced a clinical event. When trying to identify these events, diagnosis and procedure codes are particularly helpful, because they are based on structured data elements (eg, International Classification of Diseases, 10th revision [ICD-10], Healthcare Common Procedure Coding System, Systematized Nomenclature of Medicine) and they are used widely by EMRs and administrative systems.
However, extracting accurate and reliable clinical information from structured EMR/claims data can be challenging, because many different codes are entered by many different users. To determine who had a clinical event and when that event occurred, one must decide which codes to trust and figure out how to synthesize all the available information when many different codes have been documented. Algorithms that systematically address these challenges have been developed.1-11 For example, a breast cancer–detection algorithm concludes that any patient who has a claim associated with the C50 code (ICD-10) has breast cancer, and that the date of the first C50-associated claim is the date of the breast cancer diagnosis.12
Although many investigators have described methods for detecting who had a clinical event, approaches to characterize the timing of clinical events are underdeveloped. We hypothesized that existing event-detection algorithms could yield biased or inaccurate estimates of an event’s timing for several reasons. First, there could be systematic differences between the date associated with a code used to detect an event and the date on which the event actually occurred. Second, the codes best suited to detect an event may differ from the codes best suited to determine the timing of that event. Third, if a patient does not have the code being used to characterize timing, then no timing estimate can be generated. If timing estimates are missing or inaccurate, then efforts to analyze the quality of care delivered to, outcomes experienced by, and costs associated with a condition could be biased.
Recurrence—the return of cancer in a patient who completed therapy for localized disease and was believed to have been disease free—is a critically important outcome for patients with cancer. Not surprisingly, recurrence has been the focus of many epidemiologic, comparative-effectiveness, and outcomes research studies.13-16 Although tumor registries reliably capture cancer diagnoses, they do not typically capture recurrence status. In previous articles, we described highly accurate algorithms that use claims or EMR data to detect recurrence for patients with lung, colorectal, and breast cancer.17,18 In this article, we build on that work by describing a systematic and reproducible method for determining the timing of cancer recurrence using structured data and developing tools that can be used to compare the performance of different timing estimation algorithms.
METHODS
Data Sources and Patient Sample
To develop and validate an algorithm that determines the timing of cancer recurrence, we used two data sets that contained codes that could suggest when recurrence occurred linked to information describing when recurrence actually occurred. The Cancer Care Outcomes Research and Surveillance (CanCORS) Consortium was a large, prospective study of the care provided to and outcomes experienced by patients with lung or colorectal cancer diagnosed in 2003 to 2005 and followed through 2011.19 Medical record abstract data from CanCORS (used to identify gold-standard recurrence status) were linked to Medicare fee-for-service claims from 2002 to 2011 (used to estimate the timing of recurrence).20 The Cancer Research Network (CRN) is a consortium of health maintenance organizations (HMOs) affiliated with the HMO Research Network. Two CRN sites have certified tumor registrars collect recurrence status data: Kaiser Permanente Colorado, Denver, Colorado, and Kaiser Permanente Northwest, Portland, Oregon. The CRN also maintains a Virtual Data Warehouse (VDW)1 that links tumor registry data (used to identify gold-standard recurrence status) with diagnosis and procedure codes documented in an EPIC-based EMR and with claims for services delivered by contract providers (used to estimate the timing of recurrence).
Gold-standard recurrence status was ascertained through manual abstraction of the medical record by study personnel (for CanCORS) or the tumor registry (for the CRN) and recorded using the North American Association of Central Cancer Registry’s cancer status variable. To estimate the timing of recurrence, we used diagnosis and procedure codes associated with the following events: secondary malignant neoplasm involving a solid organ site, secondary malignant neoplasm involving either a solid organ or lymph node site, chemotherapy, radiotherapy, hospice, high-cost imaging, cancer symptoms, narcotic/pain medications, inpatient encounters, observation encounters, emergency department encounters, and any procedure. The codes represented commonly used data standards: ICD-9th Revision–Clinical Modification, Current Procedural Terminology 4th Edition, Healthcare Common Procedure Coding System, National Drug Codes, Diagnosis-Related Groups, Berenson-Eggers Type of Service, and facility revenue centers (Data Supplement).1,3,21 Codes were extracted from all available Medicare files and from procedure, diagnosis, encounter, pharmacy, and infusion files from the VDW.22,23 The claim through date or the discharge date was used to assign a date to each code. The primary sample included 308 patients with stage I to IIIa lung cancer from CanCORS/Medicare, of whom 89 (29%) developed recurrence. In secondary analyses, we determined the timing of recurrence using CanCORS/Medicare data for 600 patients with colorectal cancer (14% developed recurrence), CRN/VDW data for 792 patients with lung cancer (27% developed recurrence), and CRN/VDW data for 2,827 patients with colorectal cancer (13% developed recurrence).17 The institutional review boards from Dana-Farber and the participating Kaiser Permanente sites provided project oversight.
General Approach
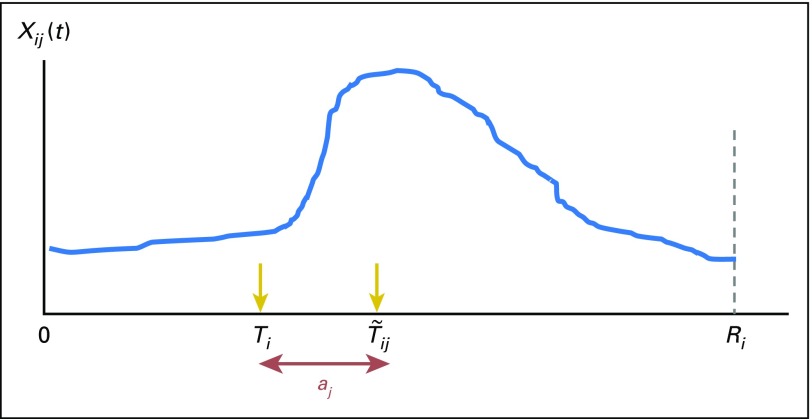
Month was chosen as the unit of analysis, because it was the most granular level for which we could ascertain changes in claims over time. Let [0, Ri] be a time window for subject i (i = 1,…,n). We assumed that each subject experienced a clinical event within this time window. Let Ti ∈ [0, Ri] denote the actual recurrence time. Consider J kinds of indicators, let Xij (t), (i = 1,…,n; j = 1,…,J) be a nonnegative function defined on the domain [0, Ri]. We consider the case that there exists such that Xij (t) takes a large change around or after Ti. For example, suppose we are interested in detecting the time of cancer recurrence. The trajectory of the count of codes for secondary malignant neoplasm between time 0 and Ri would be an example of Xij (t), because the incidence of such codes would increase around recurrence. For additional explanation of the identification problem, let X*i (t) be the perfect identifier in the sense that X*i (t) = I (Ti = t) or I (Ti ≤ t) for all i, where I (.) is the indicator function. With X*i (t), we could accurately identify Ti for each subject by finding the smallest t when X*i (t) = 1. Of course, a perfect identifier X*i (t) does not exist, but we assume there exist several Xij (t)’s that behave as such. Specifically, in our notation, we consider J kinds of indicators, Xij (t), j = 1,…,J, for each subject (i = 1,…,n). Here we are interested in deriving an algorithm to identify the timing of the event Ti for each subject, integrating information from the Xij (t)’s.
Figure 1 illustrates a typical pattern of Xij (t) we use to identify Ti. In this example, we see a large increase in Xij (t) at where aj is an unknown offset parameter that takes account of the potential difference between the event occurrence time Ti and the time, when we observe a large change in Xij (t). In this example, aj denotes the delay between when the event occurred and when it was reflected in Xij (t). Note that aj can be positive or negative, depending on the temporal relationship between the event and the indicator. After deriving a best estimate for Ti from the trajectory of Xij (t),i = 1,…,n for each j (j = 1,…,J), the proposed method integrates the (where denotes a set of estimators for Ti for subject i(i = 1,…,n)) to derive an algorithm that gives a single Ti estimate for each subject
Fig 1.
Illustration of a typical pattern of the trajectory of indicators. Xij (t) = longitudinal profile of a potential indicator j for subject i (eg, the trajectory of the count of diagnosis codes for secondary malignant neoplasm). 0 = start of the observation period (eg, initial cancer diagnosis). Ri = end of the observation period for subject i (eg, end of observation/follow-up time). Ti = time of the event occurrence for subject i (eg, cancer recurs). = time when a large gap in Xij is observed (eg, the count of diagnosis codes for secondary malignant neoplasm per month increases more than a specified threshold compared with the previous months). aj = an unknown parameter that takes account of the potential difference between the event occurrence time Ti and the time when the observed gap in Xij is observed ().
Derivation of Estimates
From here on, we assume Xij (t) is a nonnegative, discrete function of time. We also assume that t is discrete and takes on the values 0,1,2,…. Let be the cumulative function of Xij (.) at t. We then standardize Kij (t) by t and calculate:
where Lij (t) can be viewed as the average speed of the increment in Xij (t) per unit time. We derive the difference of Lij (t) with respect to time, to capture the time corresponding to the largest increase in the average speed. Specifically, at each t, we calculate
For (t = 1,2,…), where , which is added to avoid division by 0. Note that bij (t) is a change in the average speed of rising codes per unit time, which can be viewed as an acceleration rate of Xij (t). We then extract the time point when bij (t) takes the maximum for the first time within the given time window
As illustrated in Figure 1, because we model we then estimate the unknown parameter aj for each j, from the observed data In our empirical example, we used the median, rather than the mean, because of its robustness to extreme values. Let be the empirical counterpart for aj. The estimated event time, Ti, from the trajectory of the j-th indicator is then given by
We perform this procedure for each of the J indicators. Note that when bij (t) is 0 for all t, we replace and by missing values.
Now we integrate the multiple estimated times and derive a single value for each subject. Let ξij be the indicator variable for i-th subject and j-th indicator, which takes 1 if is not missing and 0 otherwise. We derive the integrated estimated time for Ti through
where Wj indicates a weight for the j-th indicator. Because the estimated time with smaller deviation from the observed recurrence time is more reliable, we determine Wj by the reciprocal of the variance of across n subjects. From a practical perspective, we used a trimmed variance instead to reduce the impact of a small number of extreme values in on the weight Wj. Specifically, we empirically determined to exclude the top and bottom 3% when calculating the variance. When is missing for all j, we substitute the naïve prediction Ri/2 to .
Variable Selection and Algorithm Assessment
Several standard measures quantify the performance of prediction models for continuous variables. For example, the average absolute prediction error is given by
and the average squared error is given by
One may standardize these measures by taking the width of the time window into account. The standardized versions of these measures are given by and respectively. Also, for a given cutoff value, we can estimate a correct classification rate by:
To adjust for the optimistic bias that is generally included in these substitution performance estimates, we use a Monte Carlo cross-validation procedure to estimate performance metrics for each of the 4,095 (ie, 212 − 1) candidate algorithms. Specifically, we randomly split the data into two equally sized groups, use one to determine the unknown parameters included in , and use the other to estimate the performance metric. We then repeated this process M times and took the average. For example, the cross-validation estimate for the average absolute prediction error is given by
where and Θm are the disjoint subsets created by the m-th random split—the former is used to estimate the unknown parameters of the algorithm, and the latter is used to calculate the performance. Here, denotes the estimate for Ti, when it is derived without using the data elements in Θm. Such a cross-validation estimate for selected performance metrics can be used to choose a final algorithm from the several candidate algorithms. Confidence intervals for performance metrics are calculated via a standard bootstrap method.
RESULTS
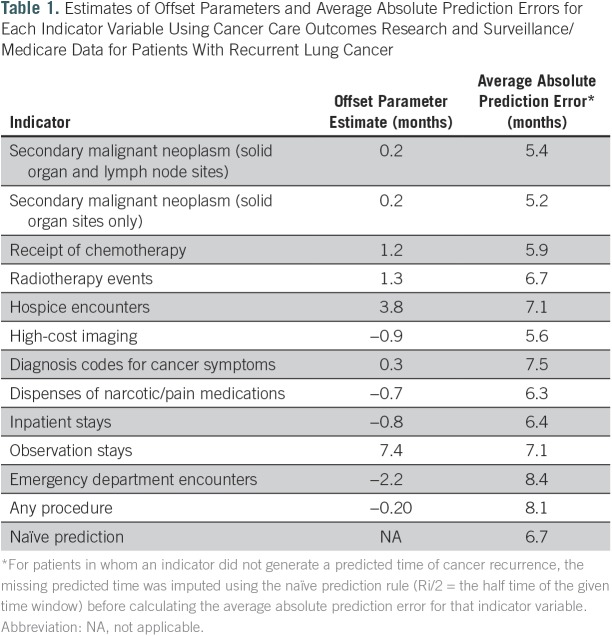
First, we applied this method to patients with recurrent lung cancer from the CanCORS/Medicare data set. Table 1 shows the offset parameters and absolute prediction errors for 12 indicators. A negative offset parameter indicates that the peak in the code count was observed before the event occurrence. For example, the offset parameter for the imaging codes was −0.9 months. This is expected, because imaging is often performed to evaluate symptoms before a biopsy is done and recurrence is confirmed. On the other hand, the offset parameter for chemotherapy was positive (0.2 months), which is also reasonable, because chemotherapy is a consequence of having recurrent cancer.
Table 1.
Estimates of Offset Parameters and Average Absolute Prediction Errors for Each Indicator Variable Using Cancer Care Outcomes Research and Surveillance/Medicare Data for Patients With Recurrent Lung Cancer
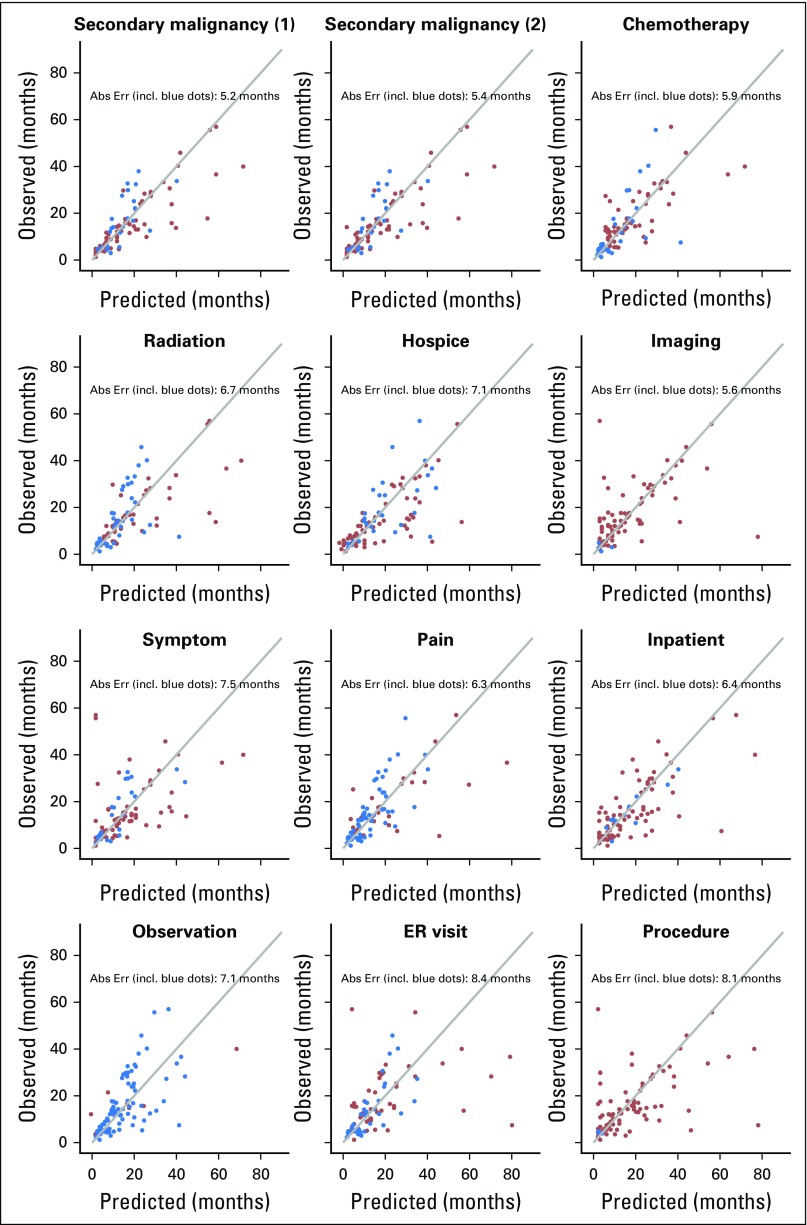
Figure 2 shows scatter plots between the predicted and the observed time of recurrence for 89 patients with recurrent disease across all 12 indicators. The blue dots indicate patients in whom the naïve prediction was used because the predicted time was not determined by the corresponding code group. The estimated absolute prediction error analysis shows that secondary malignant neoplasm involving solid organ sites was the strongest indicator among the 12; the corresponding absolute prediction error was 5.2 months. As a reference, the absolute prediction error on the basis of the naïve prediction was 6.7 months (Table 1).
Fig 2.
Scatter plots of the predicted time of recurrence and the observed time of recurrence, in months after definitive local therapy, for each indicator variable using Cancer Care Outcomes Research and Surveillance/Medicare data for patients with lung cancer. Secondary malignancy (1): secondary malignant neoplasm codes without lymph node sites of disease. Secondary malignancy (2): secondary malignant neoplasm codes including lymph node sites of disease. Red dots indicate subjects for whom the indicator variable produced a predicted time of recurrence. Blue dots indicate the subjects for whom the indicator variable produced no predicted time of recurrence, so the predicted time of recurrence displayed in the figure was estimated by the naïve prediction rule (ie, Ri/2; the half time of the given time window). Abs Err, absolute error; ER, emergency room; incl, including.
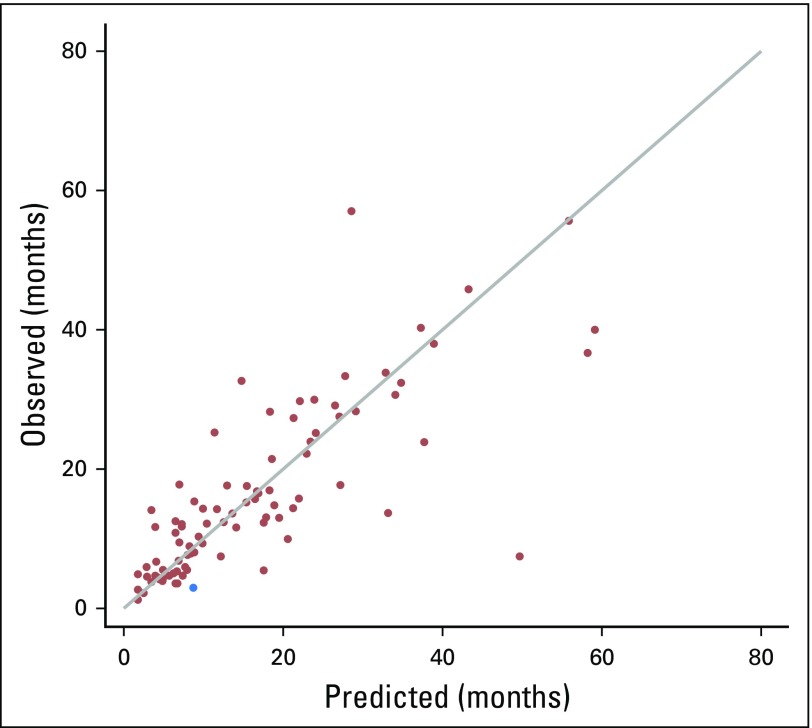
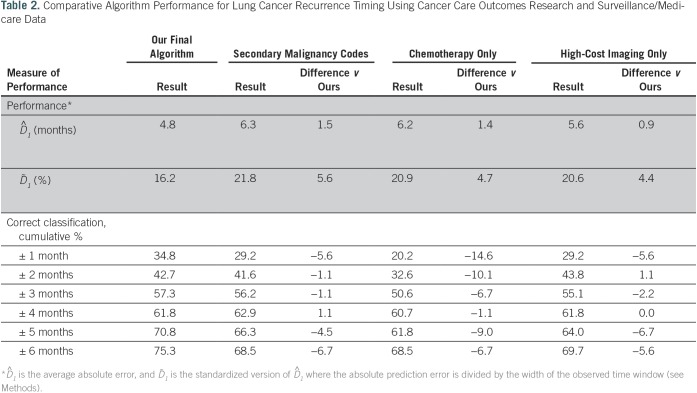
To select the final algorithm, we examined all possible combinations of the 12 indicators and calculated the average absolute prediction error for each one, selecting the combination of indicators, weights, and offset parameters that offered the best performance. The indicators in the final selected algorithm and their relative weights were: secondary malignant neoplasm involving solid organ or lymph node sites (0.279), chemotherapy (0.296), and high-cost imaging (0.425). Figure 3 shows a scatter plot of the 89 patients with recurrent disease, with the predicted time of recurrence on the basis of the final model plotted against the observed time of recurrence. The estimated absolute prediction error was 4.8 months (0.95 CI, 3.5 to 6.3). The correct classification rate (± 3-month time window) was 57.3% (0.95 CI, 47.2% to 67.4%). Model performance was compared with three alternatives: secondary malignancy involving either solid organ or lymph node sites only, chemotherapy only, and high-cost imaging only. The absolute prediction error of our algorithm was better (ie, smaller) than any of the single indicator–based alternatives (Table 2).
Fig 3.
Scatter plot between the predicted time of recurrence and the observed time of recurrence for the final model using Cancer Care Outcomes Research and Surveillance/Medicare data for patients with lung cancer, in months after definitive local therapy. Red dots indicate subjects for whom the indicator variable produced a predicted time of recurrence. The blue dot indicates the subject whose predicted time of recurrence was estimated by the naïve prediction rule (ie, Ri/2; the half time of the given time window).
Table 2.
Comparative Algorithm Performance for Lung Cancer Recurrence Timing Using Cancer Care Outcomes Research and Surveillance/Medicare Data
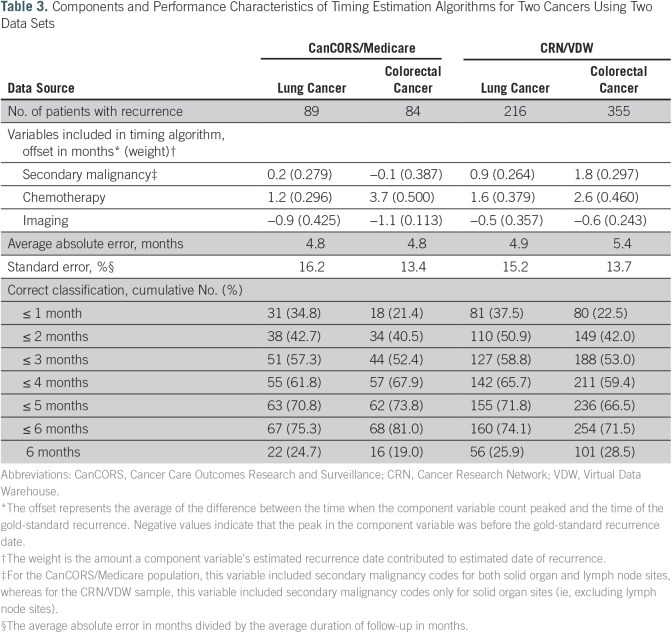
To evaluate this technique in other cancers using data from other sources, we applied the same method to colorectal cancer cases from CanCORS/Medicare and to lung and colorectal cancer cases from the CRN/VDW. Whether using claims data from CanCORS/Medicare or EMR data from the CRN/VDW, and whether detecting recurrence after a colorectal or lung cancer diagnosis, the same three code groups were part of the final algorithm (Table 3). Although the directionality of the offsets was similar, the weights for the codes varied somewhat across the four algorithms.
Table 3.
Components and Performance Characteristics of Timing Estimation Algorithms for Two Cancers Using Two Data Sets
DISCUSSION
Compared with the methods used to detect which patients experience an event, the methods used to determine the timing of an event have been underdeveloped. Historically, timing estimation algorithms have relied on only one code (eg, secondary malignancy) or a small set of homogenous codes (eg, chemotherapy). We found that using just one code yielded estimates that tended to be less accurate and meant that many patients had no timing estimate. A key strength of our approach is the use of multiple complimentary code sets. Of 89 patients with recurrent lung cancer in CanCORS/Medicare, our algorithm provided a timing estimate for all but one subject. Also, in situations where the algorithm does not derive a timing estimate, we describe a straightforward imputation method on the basis of the time half way between the original cancer diagnosis and the end of follow-up.
Timing estimation algorithms often assume that the dates of the codes used to detect events can also be used to determine the timing of events. We found that the codes best suited to determine the timing of an event were not necessarily the same as the codes best suited to detect who had an event. For example, hospice was part of the model that determined who had recurrence but not part of the model that determined when recurrence occurred.17 Also, imaging was a relatively weak predictor of developing recurrence but a strong factor when estimating the timing of recurrence. The date associated with the code in claims/EMR-based systems often differed systematically from the actual recurrence date, and the directionality of this difference made intuitive sense.
Limitations of our approach include that it is more complex than previous techniques.12 Also, the accuracy of timing estimates still remains suboptimal for a meaningful subset of patients. Although estimates were within a few months for most patients, one quarter had estimates with an average absolute error > 6 months, and model performance was only 2 months better than the naïve estimate. We are not aware of methods that derive more accurate estimates. No standard threshold for optimal accuracy has been defined, but we believe better timing estimates are needed. Caution should be taken when using most existing timing estimation algorithms. An inaccurate timing estimate could lead to the inappropriate inclusion of expenditures in an episode of care or a biased estimate of an outcome (ie, recurrence-free survival) in a comparative effectiveness research study.
The tools that we developed to determine the timing of recurrence for patients with lung and colorectal cancer can be applied to other data sources (eg, SEER-Medicare, CancerLinq), and the methodology that we described can be used to determine the timing of other cancers or other events. In fact, we have already used this technique to estimate the timing of recurrence for patients with breast cancer.18 Although our approach relied on claims- and EMR-based data sources, it could easily incorporate other data types too. For example, natural language processing could be used to convert unstructured text into structured format, and then our methodology could be used to combine natural language processing– and claims-based information to generate a refined timing estimate. Having consistent methods for assessing the performance of timing-estimation algorithms offers important advantages to those who develop and use these tools. Regardless, efforts to develop better timing estimation algorithms are still warranted. The need for accurate timing estimates will continue to grow as the use of clinical and administrative data for quality measurement, clinical research, and reimbursement expands.
Footnotes
Supported by National Cancer Institute (NCI) Grant No. R01 CA172143 (M.J.H. and D.P.R.) and NCI Cooperative Agreement No. U19 CA79689 to the Cancer Research Network. The work of the Cancer Care Outcomes Research and Surveillance Consortium was supported by NCI Grants No. U01 CA093344 (Statistical Coordinating Center), U01 CA093332 (Dana-Farber Cancer Institute/Cancer Research Network), U01 CA093324 (Harvard Medical School/Northern California Cancer Center), U01 CA01013 (University of Iowa), and U01 CA093326 (University of North Carolina); and by a Department of Veterans Affairs Grant No. VA HSRD CRS-02-164 (Durham VA Medical Center).
AUTHOR CONTRIBUTIONS
Conception and design: Hajime Uno, Debra P. Ritzwoller, Mark C. Hornbrook, Michael J. Hassett
Financial support: Michael J. Hassett, Debra P. Ritzwoller
Provision of study materials or patients: Debra P. Ritzwoller
Collection and assembly of data: Debra P. Ritzwoller, Angel M. Cronin, Nikki M. Carrol, Mark C. Hornbrook, Michael J. Hassett
Data analysis and interpretation: Hajime Uno, Debra P. Ritzwoller, Mark C. Hornbrook, Michael J. Hassett
Manuscript writing: All authors
Final approval of manuscript: All authors
Accountable for all aspects of the work: All authors
AUTHORS' DISCLOSURES OF POTENTIAL CONFLICTS OF INTEREST
The following represents disclosure information provided by authors of this manuscript. All relationships are considered compensated. Relationships are self-held unless noted. I = Immediate Family Member, Inst = My Institution. Relationships may not relate to the subject matter of this manuscript. For more information about ASCO's conflict of interest policy, please refer to www.asco.org/rwc or ascopubs.org/jco/site/ifc.
Hajime Uno
No relationship to disclose
Debra P. Ritzwoller
No relationship to disclose
Angel M. Cronin
No relationship to disclose
Nikki M. Carroll
No relationship to disclose
Mark C. Hornbrook
No relationship to disclose
Michael J. Hassett
No relationship to disclose
REFERENCES
- 1.Hassett MJ, Ritzwoller DP, Taback N, et al. : Validating billing/encounter codes as indicators of lung, colorectal, breast, and prostate cancer recurrence using 2 large contemporary cohorts. Med Care 52:e65-e73, 2014 [DOI] [PMC free article] [PubMed] [Google Scholar]
- 2.Chubak J, Yu O, Pocobelli G, et al. : Administrative data algorithms to identify second breast cancer events following early-stage invasive breast cancer. J Natl Cancer Inst 104:931-940, 2012 [DOI] [PMC free article] [PubMed] [Google Scholar]
- 3.Earle CC, Nattinger AB, Potosky AL, et al. : Identifying cancer relapse using SEER-Medicare data. Med Care 40:IV-75-IV-81, 2002 (suppl 8) [DOI] [PubMed] [Google Scholar]
- 4.Deshpande AD, Schootman M, Mayer A: Development of a claims-based algorithm to identify colorectal cancer recurrence. Ann Epidemiol 25:297-300, 2015 [DOI] [PMC free article] [PubMed] [Google Scholar]
- 5.McClish D, Penberthy L, Pugh A: Using Medicare claims to identify second primary cancers and recurrences in order to supplement a cancer registry. J Clin Epidemiol 56:760-767, 2003 [DOI] [PubMed] [Google Scholar]
- 6.Fleet JL, Dixon SN, Shariff SZ, et al. : Detecting chronic kidney disease in population-based administrative databases using an algorithm of hospital encounter and physician claim codes. BMC Nephrol 14:81, 2013 [DOI] [PMC free article] [PubMed] [Google Scholar]
- 7.Thyagarajan V, Su S, Gee J, et al. : Identification of seizures among adults and children following influenza vaccination using health insurance claims data. Vaccine 31:5997-6002, 2013 [DOI] [PMC free article] [PubMed] [Google Scholar]
- 8.Sewell JM, Rao A, Elliott SP: Validating a claims-based method for assessing severe rectal and urinary adverse effects of radiotherapy. Urology 82:335-340, 2013 [DOI] [PubMed] [Google Scholar]
- 9.Saczynski JS, Andrade SE, Harrold LR, et al. : A systematic review of validated methods for identifying heart failure using administrative data. Pharmacoepidemiol Drug Saf 21:129-140, 2012 (suppl 1) [DOI] [PMC free article] [PubMed] [Google Scholar]
- 10.Klompas M, Eggleston E, McVetta J, et al. : Automated detection and classification of type 1 versus type 2 diabetes using electronic health record data. Diabetes Care 36:914-921, 2013 [DOI] [PMC free article] [PubMed] [Google Scholar]
- 11.Hlatky MA, Ray RM, Burwen DR, et al. : Use of Medicare data to identify coronary heart disease outcomes in the Women’s Health Initiative. Circ Cardiovasc Qual Outcomes 7:157-162, 2014 [DOI] [PMC free article] [PubMed] [Google Scholar]
- 12.Chubak J, Onega T, Zhu W, et al. : An electronic health record-based algorithm to ascertain the date of second breast cancer events. Med Care 55:e81-e87, 2017 [DOI] [PMC free article] [PubMed] [Google Scholar]
- 13.Stokes ME, Thompson D, Montoya EL, et al. : Ten-year survival and cost following breast cancer recurrence: Estimates from SEER-medicare data. Value Health 11:213-220, 2008 [DOI] [PubMed] [Google Scholar]
- 14.Schootman M, Jeffe DB, Gillanders WE, et al. : Racial disparities in the development of breast cancer metastases among older women: A multilevel study. Cancer 115:731-740, 2009 [DOI] [PMC free article] [PubMed] [Google Scholar]
- 15.Gooden KM, Howard DL, Carpenter WR, et al. : The effect of hospital and surgeon volume on racial differences in recurrence-free survival after radical prostatectomy. Med Care 46:1170-1176, 2008 [DOI] [PMC free article] [PubMed] [Google Scholar]
- 16.Cummings KC, III, Xu F, Cummings LC, et al. : A comparison of epidural analgesia and traditional pain management effects on survival and cancer recurrence after colectomy: A population-based study. Anesthesiology 116:797-806, 2012 [DOI] [PubMed] [Google Scholar]
- 17.Hassett MJ, Uno H, Cronin AM, et al. : Detecting lung and colorectal cancer recurrence using structured clinical/administrative data to enable outcomes research and population health management. Med Care 55:e88-e98, 2017 [DOI] [PMC free article] [PubMed] [Google Scholar]
- 18.Ritzwoller D, Hassett MJ, Uno H, et al. : Development, validation, and dissemination of a breast cancer recurrence detection and timing informatics algorithm. J Natl Cancer Inst, 2018. 10.1093/jnci/djx200 [DOI] [PMC free article] [PubMed] [Google Scholar]
- 19.Catalano PJ, Ayanian JZ, Weeks JC, et al. : Representativeness of participants in the cancer care outcomes research and surveillance consortium relative to the surveillance, epidemiology, and end results program. Med Care 51:e9-e15, 2013 [DOI] [PMC free article] [PubMed] [Google Scholar]
- 20.Ayanian JZ, Chrischilles EA, Fletcher RH, et al. : Understanding cancer treatment and outcomes: The Cancer Care Outcomes Research and Surveillance Consortium. J Clin Oncol 22:2992-2996, 2004 [DOI] [PubMed] [Google Scholar]
- 21.Lamont EB, Herndon JE, II, Weeks JC, et al. : Measuring disease-free survival and cancer relapse using Medicare claims from CALGB breast cancer trial participants (companion to 9344). J Natl Cancer Inst 98:1335-1338, 2006 [DOI] [PMC free article] [PubMed] [Google Scholar]
- 22.Ross TC, Ng D, Brown JS, et al. : The HMO Research Network virtual data warehouse: A public data model to support collaboration. EGEMS (Wash DC) 2:1049, 2014. 10.13063/2327-9214.1049 [DOI] [PMC free article] [PubMed] [Google Scholar]
- 23.Hornbrook MC, Hart G, Ellis JL, et al. : Building a virtual cancer research organization. J Natl Cancer Inst Monogr 35:12-25, 2005 [DOI] [PubMed] [Google Scholar]


