

Summary
The ubiquitin proteasome system (UPS) maintains the integrity of the proteome by selectively degrading misfolded or mis-assembled proteins, but the rules that govern how conformationally-defective proteins in the secretory pathway are selected from the structurally and topologically diverse constellation of correctly folded membrane and secretory proteins for efficient degradation by cytosolic proteasomes is not well understood. Here we combine parallel pooled genome-wide CRISPR-Cas9 forward genetic screening with a highly quantitative and sensitive protein turnover assay to discover a previously undescribed collaboration between membrane-embedded cytoplasmic ubiquitin E3 ligases to conjugate heterotypic branched or mixed ubiquitin (Ub) chains on substrates of endoplasmic reticulum-associated degradation (ERAD). These findings demonstrate that parallel CRISPR analysis can be used to deconvolve highly complex cell biological processes and identify new biochemical pathways in protein quality control.
eTOC Blurb
ER-associated degradation (ERAD) is a protein quality control system that targets misfolded proteins in the early secretory pathway to the cytosol for degradation. Leto et al. use a functional genomic approach to identify distinct cellular machinery that destroys structurally and topologically diverse ERAD substrates.
Graphical Abstract
Introduction
Approximately one third of the eukaryotic proteome is synthesized on ribosomes at the cytoplasmic surface of the endoplasmic reticulum (ER) and translocated into or through the lipid bilayer to become membrane or secreted proteins, respectively (Ghaemmaghami et al., 2003). Proteins that fail to fold or assemble correctly in the ER are degraded by cytoplasmic proteasomes via a process known as ER-associated degradation (ERAD) (McCracken and Brodsky, 1996; Olzmann et al., 2013). Because ERAD substrates are partially or completely physically separated from the cytoplasmic ubiquitin proteasome system (UPS) by the ER membrane phospholipid bilayer, incorrectly folded or mis-assembled proteins or protein domains must first be recognized and dislocated through the ER membrane prior to being conjugated with Ub and degraded by cytoplasmic proteasomes (Christianson and Ye, 2014; Olzmann et al., 2013). Understanding how ERAD correctly recognizes its substrates, given the immense structural and topological diversity of the metazoan secretory and membrane proteome, and how, once dislocated from their native environments, these often very hydrophobic polypeptides are efficiently destroyed by proteasomes without aggregating en route is a formidable problem in cell biology.
ERAD clients can be classified as “-L” (lumen), “-M” (membrane) or “-C” (cytosol) based on the initial topological orientation of the clients’ folding or assembly lesion relative to the ER membrane (Vashist and Ng, 2004). Folding-defective variants of normally secreted proteins that are fully translocated into the ER lumen prior to being engaged by the ERAD machinery, exemplified by the null Hong Kong mutant of the human serum protein, alpha-1 antitrypsin (A1ATNHK), are, by definition, ERAD-L. ERAD-M designations can be less straightforward because missense mutations or assembly defects in membrane proteins can interfere with - or promote - partitioning into lipid bilayers (Shin et al., 1993) or can lead to gross structural alterations, particularly at domain interfaces. ERAD-C substrates can include large multipass integral membrane proteins with mutations in cytosolic domains like the ΔF508 mutant of the cystic fibrosis transmembrane conductance regulator (CFTR) (Guerriero and Brodsky, 2012), improperly integrated tail-anchored proteins (Boname et al., 2014) and cytoplasmic proteins with surface-exposed hydrophobic patches, such as those found at domain or subunit interfaces (Johnson et al., 1998). In yeast, two membrane-integrated E3s, Hrd1 and Doa10, handle essentially all ERAD, with Hrd1 mediating ERAD-L and ERAD-M and Doa10 specific for ERAD-C (Carvalho et al., 2006). By contrast, at least a dozen E3s, including orthologs of Hrd1 (HRD1) and Doa10 (MARCH6), and a large cohort of accessory factors are linked to ERAD in mammalian cells, reflecting the greatly expanded structural and topological complexity of the secretory and membrane proteomes of metazoans (Christianson and Ye, 2014). A priori assignment, therefore, of any given substrate in mammalian cells to one of the three ERAD classes (i.e., ERAD-L/M/C) may be less straightforward than in yeast because, these multiple E3 modules could act individually or in concert with one another, particularly for topologically complex substrates with ambiguous or multiple degrons. Although biochemical analysis has provided some insights into metazoan ERAD mechanisms, understanding how this system accurately distinguishes its diverse clients from the vast pool of partially folded and assembled clients requires systems-level deconvolution.
Here we combine a powerful kinetic assay of protein turnover with a pooled genome-wide CRISPR library and quantitative phenotype metrics to identify unique fingerprints of cellular machinery that destroy structurally and topologically diverse ERAD clients in human cells with exquisite specificity. Unexpectedly, we find that efficient degradation of ERAD substrates requires collaboration between membrane-embedded Ub E3 ligases and cytosolic Ub conjugation machinery to attach heterotypic Ub chains to ERAD clients.
Results
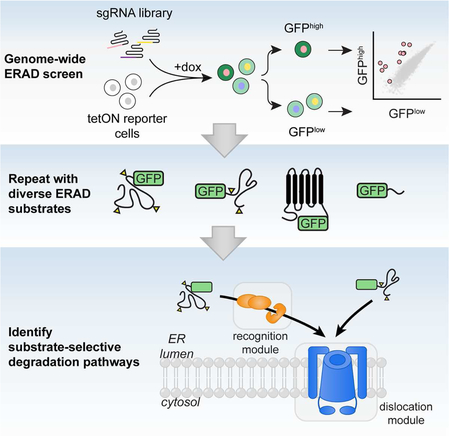
Parallel genome-wide screens reveal exquisite substrate specificity in ERAD
To map the molecular pathways that underlie substrate-selective ERAD, we developed a pooled CRISPR-Cas9-based screening approach to identify genes that enhance or decrease the turnover kinetics of topologically diverse GFP-tagged ERAD clients. The substrates (Fig. 1A) included two well-established ERAD-L and ERAD-M clients, A1ATNHK-GFP (Christianson et al., 2008) and INSIG1-GFP (Lee et al., 2006), respectively, and the A chain of the plant toxin, ricin (RTAE177Q), engineered with a murine signal sequence for direct cotranslational delivery into the host cell ER (Redmann et al., 2011) and a point mutation (E177Q) to attenuate its cytotoxity (Ready et al., 1991). RTA normally enters cells via endocytosis as a covalent heterodimer with the membrane binding ricin B subunit and is trafficked to the ER via retrograde transport, whereupon it hijacks ERAD dislocons to gain access to the cytosol (Spooner and Lord, 2015). In yeast, RTA dislocation requires the ERAD-L Ub ligase Hrd1 and its substrate adaptor Hrd3 (Li et al., 2010), but the E3 required for RTA dislocation in mammals has not been identified. We also screened GFPu*, a widely-used reporter of cytosolic UPS activity (Bence et al., 2001) with the expectation that it would help to distinguish ERAD-specific genes.
Figure 1. Parallel forward genetic analysis maps substrate-selective ERAD pathways.

(A) Schematic of the reporters used in this study. Triangles represent N-glycosylation sequons; -SH represents cysteines. (B) Fluorescence histograms of the indicated cell lines treated +/− doxycycline (dox) for 16 hr before adding inhibitors for 3 hr; representative of three independent experiments. See also Fig. S1B–C. (C) Cells were treated with inhibitors for 3 hr and median fluorescence intensity (MFI) was measured by flow cytometry analysis at the indicated times after inhibiting protein synthesis with emetine; representative of two independent experiments. (D) Genetic analysis workflow. (E) Screen metrics are well correlated with substrate degradation rates. Linear least-squares regression of gene effects from all four screens plotted against normalized degradation rates, calculated as the slope of the log-transformed decay kinetics, obtained by translation shut-off analysis in cells expressing single sgRNAs. Each data point represents the disruption of a specific gene for a given substrate indicated by color. Grey, control sgRNA. (F) Hierarchical clustering of genes by gene score. Gene score signs were assigned based on guide enrichment, with a negative sign indicating guide disenrichment in the GFPhigh population relative to the GFPlow population and a positive sign indicating guide enrichment in the GFPhigh population relative to the GFPlow population. Analysis includes genes in the indicated categories at ≤1% FDR in at least one screen. (G) Bubble plot of ERAD genes. Cytosolic E3 ligases identified in the genetic screens are in the dashed box. See also Figures S1–3 and Tables S1-4.
The reporters were expressed under tetracycline regulated control (Fig. 1B) to permit reporter silencing during cell line selection and propagation, thereby minimizing the potential for adaptive changes (Neal et al., 2018). Basal fluorescence in clonal reporter K562 cell lines was indistinguishable from untransfected cells but increased substantially and in proportion to protein half-life following induction with doxycycline (dox) (Fig. 1B and Fig. S1B). XBP1 splicing was unaltered upon dox induction, indicating that expression of these ERAD clients did not activate the unfolded protein response (UPR) and confirming that reporter expression did not exceed the folding or degradative capacity of the ER (Fig. S1D). The reporters were degraded with half-lives ranging from 10–90 min (Fig. 1C and Fig. S1A) and were strongly stabilized by acute inhibition of proteasomes with MG132 or of p97/VCP with NMS-873 (Figs. 1B–C and Figs. S1C).
Because steady-state fluorescence is a relatively insensitive measure of protein turnover for substrates with half-lives typical of ERAD substrates, we used a transcriptional shut-off “chase” to enhance the dynamic range for phenotypic selection. Rapid transcriptional shutoff was enabled by omitting a polyadenylation signal downstream of the longer-lived reporters A1ATNHK-GFP, INSIG1-GFP, and GFPu*, resulting in rapid RNA decay (Hager et al., 2008). Reporter fluorescence remained stable for ~120 min following dox washout, reflecting the latency of mRNA decay, then declined at rates proportional to the protein’s intrinsic half-life (Fig. S1E). Strikingly, we found that knocking out HRD1, which codes for an E3 Ub ligase known to be essential for A1ATNHK degradation (Christianson et al., 2008), caused a 35-fold increase in fluorescence following dox washout, compared with only ~3.5-fold increase in steady-state fluorescence in the presence of the inducer (Figs. S1F–G). Knockout of HERPUD2, a gene of unknown function that is required semi-redundantly with HERPUD1 for A1ATNHK degradation (Huang et al., 2014; Sugimoto et al., 2017), led to a more modest, ~4.5-fold increase following dox washout, compared to only ~1.3-fold steady state increase, recapitulating the partial stabilization of ERAD-L clients previously observed upon siRNA-directed knockdown (Huang et al., 2014), and suggesting that reporter fluorescence following transcriptional shut-off is proportional to protein half-life. These findings confirm that transcriptional shut-off substantially enhances the dynamic range of fluorescence-based screens for degradation of UPS substrates.
To identify genes involved in reporter degradation, we developed a functional genomics pipeline (Fig. 1D) in which each cell line was infected with a full-genome single-guide RNA (sgRNA) library (10 sgRNAs/gene) and sorted into GFPhigh and GFPlow populations. Guide frequencies in the two populations were compared to generate an adjusted log2 enrichment value (referred to here as the gene effect), a confidence metric calculated from the log-likelihood ratio (referred to here as the gene score), and P-value for each gene (Morgens et al., 2016; Morgens et al., 2017) (Table S1 and S2). The gene effects were extremely well-correlated with actual reporter degradation rates measured by standard translational shut-off analysis in reporter cells expressing single sgRNAs, establishing that screen metrics accurately and quantitatively reflect experimentally determined protein half-lives across a wide range of reporters and effect sizes (Fig. 1E).
The four screens were highly reproducible, identifying ~400–700 genes for each reporter at a 1% false discovery rate (FDR) (Fig. S2A; Table S1 and S2). As expected, all reporters were strongly stabilized by disruption of genes encoding UPS machinery (Figs. S2B and S3A and Table S3), reflecting their intrinsic instability, and by genes required for RNA processing and turnover (Fig. S3B and Table S3), reflecting a screen design that depends on transcript persistence. Genes in pathways not directly involved in ERAD, but required for processes immediately upstream and downstream, including protein synthesis, ER targeting, protein folding, N-glycan biosynthesis, ER-to-Golgi trafficking, and lipid biosynthesis were also identified but, in contrast to the former categories, displayed strong substrate specificity (Fig. 1F and Fig. S3A and Table S3).
While all four reporters were strongly stabilized by disruption of genes in the UPS category (Figs. S2B and S3A), the effects of UPS disruption at the individual gene level were exquisitely specific, exhibiting distinct substrate-selective “fingerprints”; only a single UPS gene, UBE2G2, was robustly required for degrading all reporters (Figs. S3D–E). Targeting of genes encoding subunits and assembly factors of the 26S proteasome (Fig. S3C), and p97/VCP and its cofactors NPL4 and UFD1 (Fig. 1G), also stabilized all four substrates. The lower effect sizes and confidence scores for proteasome and p97/VCP components likely reflect partial loss-of-function phenotypes arising from heterozygous or hypomorphic mutations in these essential genes that survive multiple cell passages before sorting (Parnas et al., 2015). The remarkable substrate specificity among UPS genes is sharply highlighted by the very limited set of E2s (4 out of 38; Fig. S3D) and E3s (5 out of 630; Fig. S3E) that was strongly required for substrate degradation.
Fine-grained comparison of the gene effects for each of the four reporters (Fig. 1G) revealed both striking commonalities and differences in their dependencies on ERAD machinery, with many of the highest scoring hits for the two well-characterized substrates, A1ATNHK-GFP and INSIG1-GFP, in known genes that encode ER membrane integrated E3s (SYVN1, encoding HRD1 and AMFR, encoding GP78) and E2s (UBE2G2). The robustness of these hits and the fact that they were validated in single-gene knockout protein turnover assays (Fig. 1E and Table S4) establish confidence in the screening approach and scoring metrics, and enabled the identification of genes encoding cytoplasmic E3s, UBE3C, and UBR4/KCMF1 and E2s like UBE2D3, that have not been previously linked to ERAD (Fig. 1G).
UBE3C conjugates K29 linked chains to promote GFPu* degradation
To our surprise, GFPu* was strongly stabilized by knockout of genes that code for ER-associated Ub conjugation machinery, including the membrane-integrated E3 RNF139/TRC8, two membrane-associated E2s, UBE2J2 and UBE2G2, and the UBE2G2 membrane adaptor and activator, AUP1 (Fig. 1G and Fig. S4B). These hits, independently validated by translational shut-off analysis in cells expressing individual sgRNAs (Fig. 2A, Figs. S4A and S4C) and by an independent report (Stefanovic-Barrett et al., 2018), suggest that GFPu* ubiquitylation occurs at the surface of the ER. TRC8 is required for degradation of some C-terminal tail-anchored proteins (Boname et al., 2014; Chen et al., 2014), identifying it as an ERAD-C E3. The vast majority of GFPu* was soluble in non-ionic detergent (Fig. 2B) and partitioned with cytosol upon cell fractionation (Fig. 2C), but a substantial fraction of GFPu* became insoluble following proteasome inhibition (Fig. 2B). These findings are consistent with the fact that the 16 amino acid C-terminal CL1* degron is predicted to form an amphipathic α-helix (Gilon et al., 1998) that could partition weakly at membrane interfaces, but is not sufficiently long or hydrophobic to mediate stable integration into the aliphatic core of the bilayer. It is likely that the cytoplasmic chaperone, BAG6 (Casson et al., 2016), a specific hit in the GFPu* screen (Fig. 1G), maintains its solubility or facilitates delivery to TRC8.
Figure 2. Degradation of GFPu* is promoted by Ub chain diversification.

(A) Plots of GFPu* turnover assessed by protein synthesis shut-off and immunoblotting of lysates from cell expressing the indicated sgRNAs; data are the mean of three independent experiments ± SEM. *P<0.05; **P<0.001 determined by Student’s t-test. See also Fig. S4A–C. (B) Immunoblots of TX-100 soluble (S) and insoluble (I) cell fractions. Treatments were 3 hr; representative of two independent experiments. (C) Immunoblots of cytosolic (cyto) and membrane (memb) cell fractions; representative of three independent experiments. Dashed line indicates removal of irrelevant gel lanes. (D) Plots of GFPu* turnover assessed at the indicated times after protein synthesis shut-off by flow cytometry analysis of cells expressing the indicated single or double sgRNAs. (E) GFPu* turnover in UBE3CKO cells expressing indicated UBE3C variants. Top: Immunoblots; bottom: GFPu* quantification; representative of two independent experiments. (F-G) Ubn-GFPu* conjugates affinity captured from lysates treated with UPS inhibitors (F-G) and expressing exogenous UBE3C variants (G); representative of three (F) or two (G) independent experiments. See also Fig. S4D. (H) Schematic of (I). (I) Ubn -GFPu* conjugates affinity captured with immobilized Halo-TRABID NZF1 and treated with the indicated DUBs for 1 hr. Arrows indicate vOTU-resistant Ubn -GFPu*; representative of two independent experiments. See also Fig. S4F. See also Figure S4.
GFPu* was also robustly stabilized by knockout of cytosolic Ub conjugation machinery, including UBE2D3 and UBE3C (Figs. 1G and 2A, and Figs. S4A–C). UBE2D3 is a member of a family of promiscuous E2s that share nearly identical protein sequences, raising the possibility that the modest effect of its deletion on GFPu* degradation is due to genetic compensation by another member of the UBE2D family. Deletion of both UBE2D2 and UBE2D3 resulted in a more pronounced stabilization of GFPu* than deleting either E2 alone (Fig. 2D), confirming that these closely related E2s can partially compensate for one another.
UBE3C codes for a proteasome-associated HECT domain Ub ligase that extends preexisting Ub chains on substrates, an activity proposed to antagonize proteasome-associated DUBs and to promote degradative processivity (Crosas et al., 2006). Impaired GFPu* degradation in UBE3CKO cells was rescued by reintroducing wild-type UBE3C, but not a catalytically inactive variant (UBE3CC1051A), confirming that E3 ligase activity of UBE3C is required for efficient GFPu* turnover (Fig. 2E). Ubiquitylated GFPu* species affinity captured from wild-type cells with Halo-UBQLN1 UBA, an affinity reagent that binds polyubiquitin chains independently of linkage type (Kristariyanto et al., 2015), migrated as a low-mobility smear that further decreased in mobility following exposure to NMS-873 (Fig. 2F and Fig. S4D), consistent with the stabilizing effects of pharmacologic disruption of p97/VCP on GFPu* turnover (Figs. 1B–C, Fig. S1C). Whereas deletion of the ER membrane-associated Ub conjugation machinery, TRC8 or UBE2G2, resulted in an overall decrease in the total abundance of (Ub)n-GFPu*, UBE3C deletion reduced the proportion of high molecular weight (>150 kDa) (Ub)n-GFPu* conjugates, both in the presence or absence of NMS-873 (Fig. 2F and Fig. S4E), consistent with the reported chain extending (“E4”) activity of UBE3C (Crosas et al., 2006). Deletion of UBE2D3 also led to reduction in the proportion of high molecular weight (Ub)n-GFPu* conjugates, consistent with the possibility that this promiscuous cytosolic E2 could partner with UBE3C (Fig. S4E). The intermediate effect of this knockout is likely due to the aforementioned genetic compensation by UBE2D2. GFPu* was decorated primarily with short chains in wild-type or UBE3CKO cells treated with MG132 (Fig. 2F), indicating that deubiquitylation exceeds chain extension in proteasome-impaired cells, or perhaps that proteasome inhibition blocks substrate access to UBE3C. High molecular weight (Ub)n-GFPu* conjugates were rescued by re-expressing wild-type UBE3C, but not UBE3CC1051A in UBE3CKO cells, confirming that catalytic activity of this E3 is essential for chain extension on oligoubiquitylated GFPu* (Fig. 2G).
In addition to catalyzing K48-linked polyubiquitylation, UBE3C can form atypical chains, primarily composed of K29, and to lesser degrees, K11 and K63 linkages (Michel et al., 2015; You and Pickart, 2001). Extension of oligoubiquitin on GFPu* with branched or mixed chains containing K29 linkages could promote its efficient degradation or facilitate degradative processivity by increasing local Ub density, as proposed for K11/K48 branching (Yau and Rape, 2016). To test whether UBE3C makes atypical chains on GFPu*, we enriched Ub conjugates from cell lysates by affinity capture with the K29/K33-specific NZF1 Ub binding domain from the deubiquitylating enzyme (DUB), TRABID (Kristariyanto et al., 2015; Michel et al., 2015), and immunoblotted for GFPu* (Figs. 2H–I, Fig. S4F). Halo-TRABID NZF1 preferentially captured high MW (Ub)n-GFPu* conjugates from control and NMS-873 treated cells (Fig. 2I, left panel), suggesting that GFPu* is modified with K29 and/or K33 chains. UBE3C also forms K48 linked chains, which could contribute to the formation of high molecular weight Halo-TRABID NZF1-captured GFPu*. To confirm the presence of K29-Ub on GFPu*, we either treated captured material with the catalytic domain of vOTU, a DUB that cleaves all Ub-Ub linkage types except K29 and K27 (Kristariyanto et al., 2015; Ritorto et al., 2014), or the nonspecific DUB, Usp2-cc (Ryu et al., 2006) (Figs. 2H–I, middle and right panels). We observed that GFPu* enriched from wild-type cells contained short polyUb chains that were resistant to vOTU- but not Usp2-catalyzed hydrolysis. The abundance and length of vOTU-resistant chains on GFPu* were increased in cells treated with NMS-873. By contrast, Ub conjugates on GFPu* captured from UBE3CKO cells treated with or without NMS-873 were efficiently hydrolyzed by both vOTU and Usp2cc. Treatment of Halo-UBQLN1 UBA-captured (Ub)n-GFPu* with vOTU and Usp2-cc produced similar results (Fig. S4G). Together, our data reveal that UBE3C catalyzes the extension of oligoubiquitin chains on GFPu* with heterotypic chains containing K29 linkages and promotes efficient proteasome-mediated degradation of a soluble ERAD-C client.
ERAD-M is promoted by cytosolic conjugation machinery that synthesizes heterotypic Ub chains.
A genetic requirement for the cytoplasmic E2, UBE2D3, and E3s, UBR4 and KCMF1, in INSIG1-GFP degradation (Fig. 1G) was unexpected as Ub chain formation on ERAD-M clients is thought to rely exclusively on membrane-integrated Ub conjugation machinery. Although sgRNAs targeting the cytosolic E2 UBE2D3 resulted in modest impairment in INSIG1-GFP turnover (Fig. 3A and Figs. S5A–B), knockout of both UBE2D2 and UBE2D3 caused a near complete block in INSIG1-GFP turnover, demonstrating that these E2s are redundantly required for turnover of this ERAD-M substrate (Fig. 3B). UBR4 and KCMF1 encode a large heterodimeric E3 complex (Hong et al., 2015; White et al., 2012) recently shown to assemble mixed or branched K11/K48 or K48/K63 linkages (Ohtake et al., 2018; Yau et al., 2017). Conjugation of non-canonical mixed K11/K48 chains to UPS substrates increases the affinity or avidity for binding to p97/VCP and/or the proteasome and promotes efficient degradation of aggregation-prone substrates in the cytosol (Meyer and Rape, 2014). Single or double deletion of UBR4 and KCMF1 (Fig. 3C and Fig. S5C) resulted in modest impairment in INSIG1-GFP turnover kinetics when assessed by translation shut-off analysis, confirming that they act together. The relatively modest phenotype of this deletion could indicate genetic redundancy with a different branching E3 (Ohtake et al., 2018; Yau et al., 2017) or phenotypic heterogeneity due to growth impairment resulting from gene deletion. Together, these data suggest a role for cytosolic Ub conjugation machinery in extending and diversifying K48-linked Ub chains attached to substrates by membrane-associated GP78 and UBE2G2.
Figure 3. INSIG1-GFP and A1ATNHK-GFP are modified with heterotypic K11/K48 polyUb chains.

(A) Plots of INSIG1-GFP turnover assessed by protein synthesis shut-off and flow cytometry analysis of cells expressing the indicated sgRNAs; data are the mean ± SEM of three independent experiments. *P<0.05; **P<0.001 determined by Student’s t-test. See also Figs. S5A–B. (B-C) Plots of INSIG1-GFP turnover assessed by protein synthesis shut-off and flow cytometry analysis of cells expressing the indicated single or double sgRNAs. (B) data are representative of two independent experiments. (C) data are the mean ± of three independent experiments. *P<0.05 determined by Student’s t-test. See also Fig. S5C. (D), (G) Ub and Ub KGG peptides from GFP immunoisolates from urea-denatured lysates were analyzed by LC-MS/MS. Data are the integrated MS ion peak intensity of Ub or Ub-KGG normalized to the integrated MS ion peak intensity of GFP; representative of two independent experiments. (D) INSIG1-GFP, (G) A1ATNHK-GFP. (E), (H) GFP immunoisolates from urea-denatured lysates were immunoblotted with linkage- or architecture-specific Ub antibodies; (E) INSIG1-GFP, (H) A1ATNHK-GFP; representative of three independent experiments. (F), (I) Ub conjugates were immunoisolated using linkage- or architecture-specific Ub antibodies from denatured lysates; (F) INSIG1-GFP from NMS-873-treated lysates. Dashed line indicates removal of irrelevant gel lanes, (I) A1ATNHK-GFP from MG132-treated lysates. See also Figures S5–6 and Table S5.
As expected, INSIG1-GFP partitioned with membranes upon cell fractionation. Inhibition of p97/VCP resulted in a further accumulation of INSIG1-GFP in the membrane fraction, while the reporter accumulated in both membrane and cytosolic fractions upon proteasome inhibition (Fig. S5D). The vast majority of KCMF1 and UBR4 was detected in the cytosol upon cell fractionation, but a small portion of both proteins partitioned with ER membranes (Fig. S5E). INSIG1-GFP immunoprecipitated from the membrane fraction co-precipitated KCMF1 in the absence or presence of ERAD inhibitors (Fig. S5F), suggesting that this E3 complex may recognize INSIG1-GFP at the ER membrane.
LC-MS/MS analysis of denaturing INSIG1-GFP immunoprecipitates identified KGG isopeptide remnants on two lysines within the cytoplasmic domain of INSIG1 (Table S5). INSIG1-GFP and Ub were by far the most abundant proteins in these precipitates and were present at levels >4 times that of non-specific contaminants (Fig. S6A; Table S5). In the absence of ERAD inhibitors, INSIG1-GFP co-purified with K48-, K11-, and K63-linked Ub chains (Fig. 3D; Table S5). Inhibition of p97/VCP led to substantial increases in the abundance of K11- and K6-linked chains, while proteasome inhibition increased the abundance of K11- as well as K63- linked chains.
To independently confirm the presence of K11-linked Ub on INSIG1-GFP and to analyze the architecture of these Ub chains, we used a recently described bispecific antibody engineered to bind with high selectivity to branched or mixed Ub chains containing both K11 and K48 linkages (Yau et al., 2017). Ubiquitin conjugates associated with INSIG1-GFP immunoprecipitates from denaturing lysates of dox-induced cells were detected by immunoblotting with the K48-specific and K11/K48-bispecific antibody. Treatment with NMS-873 or MG132 resulted in increased signals with K48-, K11/K48-, and K11-specific (Fig. 3E) but not control K11/gD or K48/gD antibodies (Fig. S5G). We confirmed these results by immunopurifying K48 chains or K11/K48 heterotypic chains from denatured cell lysates treated with NMS-873 followed by immunoblotting with a GFP antibody (Fig. 3F). These data, beginning with genetic identification of UBR4 and KCMF1 and validated by the presence of both K48 and K11 linked Ub-Ub remnants in immunoisolated INSIG1-GFP and the immunoreactivity of INSIG1-GFP species with bispecific K11/K48 antibodies, support a role for branched or mixed heterotypic Ub linkages in promoting efficient degradation of this ERAD-M client.
The presence of heterotypic, branched or mixed chains on INSIG1-GFP and on GFPu* prompted us to consider the possibility that HRD1 clients may also be modified with heterotypic Ub chains. LCMS/MS analysis of GFP immunoprecipitates from urea-denatured lysates of untreated A1ATNHK-GFP K562 cells identified K48- and K63- linked Ub chains, and analysis of lysates from NMS-873 or MG132 -treated cells revealed the presence of K11- linked Ub chains (Fig. 3G, Fig. S6B and Table S5). The presence of K11-K48 branched/mixed chains on the HRD1/SEL1L client, A1ATNHK-GFP, was independently confirmed by immunoblotting with linkage-specific K11- and K48- and K11/K48- antibodies (Fig. 3H and Fig. S5H) and by the reciprocal experiment in which K48 and K11/K48 immunoprecipitates from MG132-treated cells were probed with a GFP antibody (Fig. 3I). Thus, conjugation of Ub chains with K11 and K48 branched/mixed linkages is a property of two very different ERAD modules, suggesting a broader function in protein quality control than previously anticipated (Komander and Rape, 2012; Yau and Rape, 2016).
GFP-RTAE177Q evades glycan-dependent quality control surveillance
Although both A1ATNHK-GFP and GFP-RTAE177Q were robustly stabilized by knockout of all components of the well-characterized HRD1/SEL1L complex, (Fig. 1G), these two ERAD-L clients differed strikingly in their dependence on N-glycosylation. A1ATNHK-GFP degradation was strongly dependent on nearly every gene involved in the formation or transfer of N-linked glycans. Deleting the machinery that generates the mannose-trimmed Asn-linked glycan that marks misfolded glycoproteins for destruction (EDEM2/3 and the oxidoreductases TXNDC11 and P4HB/PDI) or the lectin that recognizes this glycan signal (OS9) (Roth and Zuber, 2017) also strongly stabilized A1ATNHK-GFP (Figs. 4A–B). Surprisingly, GFPRTAE177Q was destabilized by disrupting genes required to generate and recognize the N-glycan “triage” signal, even though this reporter is quantitatively glycosylated at Asn-11 (Fig. 4C). This unexpected stimulation of GFP-RTAE177Q degradation was confirmed in translational shut-off assays in cells harboring individual gene knockouts (Figs. S7A, C–D) and by acute pharmacological disruption of N-glycan biosynthesis or mannose trimming (Fig. 4D), suggesting that the glycan signal that normally promotes degradation of misfolded glycoproteins in the ER actually stabilizes GFP-RTAE177Q. Indeed, mutation of the single N-glycosylation sequon at Asn11 on GFP-RTAE177Q (Fig. 4C) strongly accelerated its turnover (Fig. 4E), making it largely resistant to pharmacological (Fig. 4F) or genetic (Figs. S7B, C, and E) disruption of N-glycosylation. Degradation of RTAE177Q lacking a GFP tag was also accelerated by pharmacological impairment of mannose trimming (Fig. S7F) and inhibited by treatment with UPS inhibitors or deletion of SEL1L (Figs. S7G–H), demonstrating that the observed turnover of our RTA reporter is not due to the presence of the large GFP moiety. Our findings show that that the tagged RTA variant, delivered biosynthetically to the mammalian ER, is efficiently dislocated to the cytoplasm, where it is degraded by the 26S proteasome. These data are also supported by the previous finding that the toxicity of ricin holotoxin is attenuated by targeted disruption of the some of the same ERAD Ub conjugation machinery identified in this study (Morgens et al., 2017). Our data suggest that this toxin evolved a “fast track” access route to the core HRD1/SEL1L dislocon, bypassing the normal glycan-dependent quality control machinery that monitors glycoprotein folding in the ER to be efficiently delivered to the cytosol.
Figure 4. GFP-RTAE177Q is rapidly degraded by evading glycan quality control.

(A) Bubble plot of N-glycan biosynthesis genes. (B) Structure of the core high-mannose N-glycan. The α1,2-glycosidic bonds recognized by EDEMs are highlighted in red and the two C-branch α1,6-glycosidic bonds that contact the binding pocket of OS9 are highlighted in yellow. (C) Top: Schematic of GFPRTAE177Q N-glycosylation sequons. Bottom: Effect of endo H (H) or PNGase F (F) endoglycosidases on GFP-RTAE177Q mutant mobility. Filled and open arrowed are glycosylated (GP) and nonglycosylated (nGP) GFP-RTAE177Q, asterisks indicate proteolytic cleavage products; representative of three independent experiments. (D), (F) GFP-RTAE177Q (D) or GFP-RTAN11Q, E177Q (F) turnover in cells treated for 6 hr with kifunensine or for 4.5 hr with tunicamycin. Arrows indicate the glycosylated (GP) and non-glycosylated (nGP) forms of GFP-RTA. Arrowheads indicate the core glycosylated (CG), mannose trimmed (deM), and nonglycosylated (nGP) forms of CD147. Right: Quantification of GFP-RTA turnover; data are the mean ± SEM of three independent experiments. *P<0.05; **P<0.001 determined by Student’s t-test. (E) Comparison of GFP-RTAE177Q and GFP-RTAN11Q, E177Q turnover; data are the mean ± SEM of three independent experiments. **P<0.01 determined by Student’s t-test. See also Figure S7.
Discussion
We used parallel, genome-wide, CRISPR analysis to discover that selective degradation of topologically and structurally diverse proteins by ERAD is promoted by class-specific membrane embedded E3 modules that collaborate with cytosolic Ub conjugation machinery to promote efficient destruction of aggregation-prone proteins. Our data support a role for UBR4 and UBE3C in extending oligo-ubiquitin conjugates on ERAD clients with K11/K48 and K29/K48, and possibly other, heterotypic chains. Although we cannot completely rule out the possibility that cytosolic and ER-embedded Ub conjugation machinery act on distinct populations of GFPu* and INSIG1-GFP, our findings that deletion of GP78/AMFR and TRC8/RNF139 resulted in a near complete stabilization of substrates while deletion of UBR4/KCMF1 or UBE3C only partially stabilized GFPu* and INSIG1-GFP suggests a model (Fig. 5) in which membrane-embedded ligases, together with associated UBE2G2, first attach K48-linked oligoubiquitin chains to substrates followed by extension of these chains by Ub chain-diversifying enzymes. Heterotypic K11/K48 chains bind to proteasomes and p97/VCP with higher affinity than homotypic chains (Meyer and Rape, 2014), serving as “priority signals” to promote efficient aggregation-prone mutant substrates of cytoplasmic quality control (Yau et al., 2017). We propose that high local concentration of degradative Ub chains on dislocating ERAD substrates contributes to efficient recruitment of proteasomes and p97/VCP, enabling efficient coupling and degradative.
Figure 5. Model of ERAD-L, -M, and -C.

(A) Glycosylated ERAD-L substrates utilize the HRD1 complex for ER dislocation and ubiquitylation. Substrate-specific heterogeneity in ERAD-L is revealed by GFP-RTAE177Q, which can engage luminal recognition factors for slow delivery to the HRD1 complex or can be rapidly dislocated and degraded by bypassing glycan recognition machinery. Dislocated ERAD-L substrates are modified with K48 and K11 Ub linkages and targeted for destruction by cytosolic proteasomes. (B) The ERAD-M substrate INSIG1-GFP utilizes GP78 for ER dislocation and ubiquitylation. Efficient delivery to cytosolic degradation machinery may be facilitated by conjugation of K11/K48 chains that increase affinity for p97/VCP and the proteasome. (C) Efficient degradation of the ERAD-C substrate GFPu* requires conjugation of heterotypic K48/K29 chains via the ER-embedded E3 ligase TRC8 and the cytosolic E3 UBE3C.
Ricin and related toxins have been exploited as biological warfare and immunotherapy agents and as powerful tools for cell biological research, providing insights into such fundamental processes as protein synthesis, endocytosis and ERAD. Our finding that GFP-RTAE177Q is rapidly degraded by the UPS is incompatible with the widely-held view that this toxin resembles a misfolded protein that hijacks the normal protein quality control machinery but, once dislocated, escapes degradation in the cytosol (Spooner and Lord, 2012). Our data suggest that RTA has evolved a “fast-track” pathway to the cytosol that bypasses normal N-glycan-dependent quality control surveillance in the ER lumen, most likely by binding directly to the HRD1/SEL1L dislocon (Fig. 5). While we cannot rule out the possibility that a small fraction of RTA molecules could be dislocated in such a way as to avoid degradation by the proteasome, our data suggest that intoxication could be determined by kinetic competition between the catalytic activity of dislocated RTA and its degradation.
Our identification of common requirements for core membrane integrated components of the HRD1 membrane E3 complex for both GFP-RTAE177Q and A1ATNHK-GFP, but completely divergent phenotypes for luminal components, underscores the utility of our pooled CRISPR approach in deconvolving diversity in substrate-specific ERAD, even within the well-defined ERAD-L module. Likewise, this unbiased analysis allowed unambiguous assignment of GFPu* to ERAD-C, based on its strict dependence on Ub conjugation machinery located at the cytoplasmic face of the ER membrane. Iterative application of this technology with single or double (Han et al., 2017) knockout sgRNA libraries to a broader cohort of clients will be instrumental in defining ERAD modalities beyond the simple ERADL/M/C rubric, and will be an invaluable tool to identify the mechanisms for destroying topologically complex and medically important substrates including ΔF508-CFTR, HMG-CoA reductase and GABA receptors (Printsev et al., 2017).
STAR Methods
CONTACT FOR REAGENT AND RESOURCE SHARING
Further information and requests for resources and reagents should be directed to and will be fulfilled by the Lead Contact, Ron Kopito (kopito@stanford.edu).
EXPERIMENTAL MODEL AND SUBJECT DETAILS
Mammalian cell culture
K562 human myeloma cells (ATCC) were maintained in RPMI 1640 medium (Corning) supplemented with 2mM L-glutamine (Corning) and 10% FBS (Sigma-Aldrich). Doxycycline (dox)-inducible reporter K562 cell lines were grown in complete RPMI medium supplemented with 200 μg/mL G418 (Thermo Fisher Scientific) and 4 μg/mL Blasticidin (Thermo Fisher Scientific). HEK293T human embryonic kidney cells (ATCC) and HEK293T FLAG-UBR4 cells (a generous gift from M. Rape, University of California, Berkeley, Berkeley, CA) were maintained in DMEM (Corning) supplemented with 10% FBS. HEK293 human embryonic kidney cells (ATCC) and HEK293 SEL1LKO cell lines (van der Goot et al., 2018) were maintained in DMEM supplemented with 10% animal serum complex (Gemini Bio-Products). Cell lines were grown in a humidified incubator at 37°C and 5% CO2. All cell lines were routinely tested for mycoplasma infection using a PCR mycoplasma detection kit according to the manufacturer’s instructions (ABM Inc.).
METHOD DETAILS
Mammalian cell transfections
HEK293T cells were transfected using TransIT LT1 (Mirus Bio LLC) and HEK293 cells were transfected using Lipofectamine LTX with Plus Reagent (Thermo Fisher Scientific) according to the manufacturer’s instructions. To transfect K562 cells, 1×10⁶ cells were collected by centrifuging at 1,000 xg for 5 minutes. The cell pellet was resuspended in a transfection mix containing 5 μg of plasmid DNA and 100 μL of Opti-MEM medium (Thermo Fisher Scientific) supplemented with 7.25 mM ATP and 11.7 mM MgCl2-6H20, moved into a 2 mm electroporation cuvette, and electroporated using an Amaxa Nucleofector (Lonza) set to program T-016. Transfected cells were cultured for 48–72 hr before being processed for downstream analysis.
Plasmids
The HA-RTAE177Q expression construct was generated by subcloning kB-HA-RTAE177D (Redmann et al., 2011) (a generous gift from N. Tortorella, Mount Sinai School of Medicine, New York, NY) into pCDNA3.1(+) (Thermo Fisher Scientific) and subsequently mutating residue 177 to a glutamine using site-directed mutagenesis. pCDNA3.1(+)-UBE3C wobble and pCDNA3.1(+)-UBE3CC1051A wobble were generated by subcloning the cDNA inserts from pBMN2-UBE3C and pBMN2-UBE3CC1051A (Chu et al., 2013) into pCDNA3.1(+) and subsequently mutating the PAM site recognized by sgUBE3C #1 using site-directed mutagenesis. pGEX C3 HALO thrombin-TRABID1−33 and pGEX6P-vOTU1−183 (Kristariyanto et al., 2015) were obtained through the MRC PPU Reagents and Services facility (MRC PPU, College of Life Sciences, University of Dundee, Scotland, mrcppureagents.dundee.ac.uk). The pLVX-TetOn Advanced vector (Takara Bio) was modified by replacing the CMV promoter with an EF1α promoter to generate pLVX-pEF1α-TetON Advanced. The pMCB497-pTRE plasmid used to generate constructs for doxinducible ERAD reporter expression was made by replacing the EF1α promoter and cDNA insert from the lentiviral expression plasmid pMCB497 with a custom expression cassette containing pTRE Tight, a multiple cloning site, and pPGK-BlastR. The A1ATNHK-GFP and GFPu* inserts from previously described constructs (Bence et al., 2001; Christianson et al., 2011) were subcloned into pMCB497-pTRE using a standard restriction enzyme cloning procedure. INSIG1-GFP and GFP-RTAE177Q were generated by replacing the myc tag in pTK-INSIG1-myc (Lee et al., 2006) (a generous gift from J. Ye, University of Texas Southwestern Medical Center, Dallas, Texas) or the HA tag in pCDNA3.1(+)-kB-HA-RTAE177Q with GFP or sfGFP, respectively, using FastCloning (Li et al., 2011). The inserts were subsequently subcloned into pMCB497-pTRE using standard restriction enzyme cloning. GFP-RTAE177Q glycosylation mutants were generated by site-directed mutagenesis of pCDNA3.1(+)-GFP-RTAE177Q and were subsequently subcloned into pMCB497-pTRE. The lentiviral packaging plasmids psPAX2, pMD2.G, pRSV-Rev, and pMDLg/pRRE were obtained from Addgene. The SFFV-Cas9-BFP plasmid was described previously (Deans et al., 2016).
To generate sgRNA expression plasmids, pairs of oligonucleotides containing the sgRNA sequence and BstXI and BlpI overhangs were phosphorylated and annealed. Annealed oligos were then ligated into a BstXI and BlpI-digested and gel purified pMCB320 vector backbone (Deans et al., 2016). Double sgRNA vectors were generated using a two-step cloning procedure in which single sgRNAs were first cloned into pMCB320 or pKHH030. The pKHH030 plasmid was then digested with XhoI and BamHI and the hU6-sgRNA-tracrRNA cassette was isolated by gel purification and ligated into XhoI and BamHI-digested pMCB320 (Han et al., 2017).
Lentivirus packaging, lentivirus infection, and cell line creation
To produce sgRNA lentivirus, pMCB320 containing the indicated sgRNA was combined with third-generation lentiviral packaging mix (1:1:1 mix of pMD2.G, pRSV-Rev, and pMDLg/pRRE) at a 1:1 ratio and transfected into HEK293T cells using TransIT LT1 transfection reagent (Mirus Bio LLC) according to manufacturer’s protocol. Transfected cells were grown for 72 hr and then the supernatant containing the viral particles was collected and passed through a sterile 0.45 μM Millex syringe filter (Millipore). ERAD reporter K562 cells were infected by resuspending cells in viral supernatant supplemented with 8 μg/mL polybrene and centrifuging for 2h at 1,000g at 33°C. The supernatant was removed and cells were grown in fresh RPMI medium for 48–72h. Infected cells were selected by growing in RPMI medium containing 1 μg/mL puromycin (Sigma-Aldrich) for 3–5 days. Cells were recovered in complete RPMI medium lacking puromycin for 48–72 hours. sgRNA-expressing cell lines were assayed within 10 days or were used to generate clonal cell lines by limited dilution cloning.
To generate dox-inducible ERAD reporter K562 cells, pLVX-pEF1α-TetOn Advanced was packaged into lentivirus using second-generation lentiviral packaging mix (1:1 mix of psPAX2 and pMD2.G) and infected into K562 cells essentially as described above. 72 hr after infection, cells were selected in complete medium containing 400 μg/mL G418 and passaged for an additional 10 days before infection with a pMCB497-pTRE vector containing the GFP-tagged ERAD reporter cDNA insert. Infected cells were selected in complete medium containing 7.5 μg/mL Blasticidin and individual clones were isolated by limited dilution cloning. Dox-inducible ERAD reporter K562 cell lines were infected with pSFFV-Cas9-BFP lentivirus and cells stably expressing Cas9-BFP were isolated by sorting twice on an Aria II (BD Biosciences) cell sorter equipped with a 405 nm laser.
The clonal cell lines used in this study were screened by immunoblot and flow cytometry analysis and were selected for an absence of ERAD reporter expression when grown in medium lacking dox, homogeneous GFP signal and production of a GFP fusion protein of the expected molecular weight when stimulated with dox, reporter stabilization by the proteasome inhibitor MG132, and normal cell growth rate. Unless otherwise noted, ERAD reporter expression was induced by treating clonal K562 cell lines with dox (Sigma-Aldrich) for 16 hr (0.075 μg/mL for A1ATNHK-GFP, 1 μg/mL for GFP-RTA, 0.3 μg/mL for INSIG1-GFP, 0.2 μg/mL for GFPu*).
Flow cytometry
For all flow cytometry analyses, cells were collected by centrifuging at 1,000 xg for 2 min, resuspended in PBS, and placed on ice. At least 20,000 events per sample were analyzed on an LSR II flow cytometer (BD Biosciences) equipped with 405, 488, and 532 lasers or on a FACSCalibur (BD Biosciences) equipped with a 488 laser. Data were analyzed using FlowJo version 10.0.8 (FlowJo, LLC).
Emetine chase
Dox-induced reporter cells were treated with 20 μM emetine for the indicated times and harvested by centrifuging at 1,000 xg for 5 min. For flow cytometry analysis, cells were resuspended in PBS and placed on ice. For western blot analysis, cells were washed once with PBS, lysed in 1% SDS lysis buffer (1% SDS, 50 mM Tris-HCl pH 7.5, 150 mM NaCl, 2.5 mM EDTA, 100 mM PMSF, and Roche protease inhibitor cocktail), sonicated for 20 sec on setting 3 using a Sonic Dismembrator 500 (Fisher Scientific), and centrifuged at 20,000 xg for 15 min. Protein concentration was measured using a BCA Protein Assay Kit (Pierce) and an equal amount of total cell lysate per sample was resolved by SDS-PAGE. Total protein was visualized using REVERT total protein stain according to manufacturer’s instructions (LI-COR Biosciences) and membranes were immunoblotted with the indicated antibodies. Total protein and immunoblots were imaged on an Odyssey CLx imaging system (LI-COR Biosciences).
Glycosidase treatment
GFP-RTAE177Q reporter K562 cells were lysed in 1% SDS lysis buffer, sonicated for 20 sec on setting 3 using a Sonic Dismembrator 550 (Fisher Scientific), and centrifuged at 20,000 xg for 15 min. Lysates were heated at 95°C for 10 minutes and cooled to room temperature before adding Endo H and 10X G5 Reaction Buffer or PNGase F and 10X G7 Reaction Buffer (New England Biolabs, Inc.). Reactions were incubated at 37 °C for 1 hr and then analyzed by SDS-PAGE and immunoblotting.
Cell fractionation
Triton X-100 (TX-100) soluble and insoluble fractions were isolated from 2×10⁶ dox-induced GFPu* reporter K562 cells by resuspending a PBS-washed cell pellet in 200 μL of 1% TX-100 solubilization buffer (1% TX-100, 50 mM Tris-HCl pH 7.5, 150 mM NaCl, 5 mM EDTA, 20 mM N-ethylmaleimide, 1 mM PMSF, Roche protease inhibitor cocktail). Lysates were rotated at 4 °C for 20 min and then cleared by centrifuging at 20,000 xg and 4°C for 20 min. The TX-100 soluble supernatant was collected and the TX-100 insoluble pellet was washed three times with 300 μL of 1% TX-100 solubilization buffer. The pellet was solubilized by sonicating in 200 μL of 1% SDS solubilization buffer (1% SDS, 50 mM Tris-HCl pH 7.5, 150 mM NaCl, 5 mM EDTA, 20 mM N-ethylmaleimide, 1 mM PMSF, Roche protease inhibitor cocktail) and cleared by centrifuging at 20,000 xg and 18 °C for 20 min. Equal volumes of 1% TX-100 soluble and insoluble fractions were analyzed by SDS-PAGE and immunoblotting.
Membrane and cytosolic fractions were isolated from 1×10⁶ dox-induced GFPu* or INSIG1-GFP reporter K562 cells by resuspending a PBS-washed cell pellet in 100 μL of 0.04% digitonin buffer (0.04% digitonin, 50 mM HEPES pH 7.5, 150 mM NaCl, 2 mM CaCl2, Roche protease inhibitor cocktail). Resuspended cells were incubated at 4 °C for 10 min before centrifuging at 20,000 xg and 4 °C for 10 min. The supernatant containing the cytosolic fraction was collected and the pellet was washed three times with PBS before resuspending in 100 μL of 1% TX-100 buffer (1% TX-100, 50 mM HEPES, 150 mM NaCl, Roche protease inhibitor cocktail). The resuspended pellet was incubated at 4 °C for 10 min before centrifuging at 20,000 xg and 4 °C for 10 min. The supernatant containing the membrane fraction was collected and the insoluble pellet containing nuclei was discarded. Equal volumes of the cytosolic and membrane fractions were analyzed by SDS-PAGE and immunoblotting. Membrane and cytosolic fractions were isolated from HEK293T FLAG-UBR4 cells as described above, except that 0.02% digitonin was used to extract the cytosolic fraction.
Proteins were immunoprecipitated from the membrane fraction by solubilizing the digitonin-extracted pellet in DMNG lysis buffer containing 1% decyl maltose neopentyl glycol (DMNG; Anatrace), 50 mM HEPES, 150 mM NaCl, 5 mM MgCl2, and Roche protease inhibitor cocktail. Lysates were cleared by centrifuging at 20,000 xg and 4 °C for 10 min and subsequently rotated at 4 °C with 20 μL of GFP-Trap_MA beads (Chromotek) for 2.5 hr. Bound material was washed three times with lysis buffer containing 0.2% DMNG before eluting by heating at 65 °C in 2X Laemmli buffer containing 2% (v/v) 2-mercaptoethanol for 10 minutes. Eluted proteins and inputs were analyzed by SDS-PAGE and immunoblotting.
Genome-wide CRISPR/Cas9 screen
The 10-sgRNA per gene CRISPR/Cas9 library was synthesized, packaged into lentiviral particles, and infected into ERAD reporter K562 cells stably expressing SFFV-Cas9-BFP essentially as previously described (Morgens et al., 2016). Briefly, each sgRNA sublibrary (9 in total, described previously (Morgens et al., 2017)) and 3rd generation lentiviral packaging plasmids were transfected into 293T cells seeded into one 15-cm tissue culture dish. After 72 hr, lentivirus was harvested and each sublibrary was infected into 35×106 cells. After infection, cells were grown for 72 hr and then selected with 0.75 μg/mL puromycin until the population was ≥90% mCherry+. Cells were recovered in medium lacking puromycin for 72 hr, then were collected by centrifuging at 1,000 xg for 5 min, resuspended in cell freezing medium (FBS supplemented with 10% DMSO), and stored in aliquots of 5×10⁷ cells.
The ERAD reporter forward genetic screens were performed twice. For genetic screening, cells infected with CRISPR/Cas9 sublibraries were combined to generate two sublibrary pools (sublibrary pool A = Apoptosis and cancer; Drug targets, kinases, and phosphatases; Proteostasis; Unassigned 2; sublibrary pool B = Gene expression; Membrane proteins; Trafficking, mitochondrial, and motility; Unassigned 1; Unassigned 3; in the A1ATNHK-GFP screen, the Membrane proteins sublibrary was included in pool A) and each sublibrary pool was sorted independently. To initiate the screen, a cryopreserved aliquot of each sublibrary was thawed and recovered by passaging in complete RPMI medium for two days and then sublibraries were combined at 1,000-fold coverage. 24 hr later, 350×106 cells were resuspended to a final density of 350,000 cells/mL in complete RPMI medium supplemented with dox. For the GFP-RTAE177Q reporter screen, reporter expression was induced by growing cells in medium containing dox for 20 hr. For the A1ATNHK-GFP, INSIG1-GFP, and GFPu* screens reporter expression was induced by growing cells in medium containing dox for 14 hr. Cells were then collected by centrifuging at 1,000 xg for 5 min, washed once with warm RPMI medium without supplements, and grown for an additional 12 hr (for A1ATNHK-GFP) or 6 hr (for INSIG1-GFP and GFPu*) in complete RPMI medium without dox. Cells were harvested by centrifuging at 1000 xg for 5 min and then resuspended to a final density of ~1.5×10⁷ cells/mL in RPMI medium without phenol red and supplemented with 0.5% FBS and placed on ice to halt reporter turnover. The cells were separated into a BFP+/mCherry+/GFPhigh population containing the brightest ~4% of cells and a BFP+/mCherry+/GFPlow population containing the dimmest ~75% of cells by sorting on an Aria II equipped with 405, 488, and 532 lasers. For each sublibrary pool, at least 4×10⁶ GFPhigh and 1×10⁸ GFPlow cells were collected.
Genomic DNA was extracted from each cell population using a Qiagen Blood Maxi (for GFPlow cells) or Blood Midi (for GFPhigh cells) kit according to the manufacturer’s instructions. To prepare the sgRNA sequencing libraries, sgRNAs were PCR amplified from the genomic DNA using Herculase II Fusion DNA Polymerase (Agilent Technologies) using the primers oMCB 1562 and oMCB 1563. The number of PCR reactions was scaled to use all of the isolated genomic DNA. Each PCR reaction contained: 10 μg of genomic DNA, 20 μL 5X Herculase buffer, 1 μL of 100 mM dNTPs, 1 μL 100 μM oMCB 1562, 1 μL 100 μM oMCB 1563, 2 μL Herculase II Fusion DNA polymerase, and water to adjust the volume to 100 μL. The sgRNAs were amplified using the following PCR protocol: 1× 98°C for 2 min, 18× 98°C for 30 sec, 59.1°C for 30 sec, 72°C for 45 sec, 1× 72°C for 3 min. PCR amplicons from each genomic DNA sample were pooled and 5 PCR reactions were set up for each sample as follows: 5 μL of PCR reaction 1 amplicon, 20 μL 5X Herculase buffer, 2 μL of 100 mM dNTPs, 0.8 μL 100 μM oMCB 1439, 0.8 μL 100 μM of barcoded CRISPR KO primer, 2 μL Herculase II Fusion DNA polymerase, and 69.4 μL water. PCR conditions for the second PCR reaction were: 1× 98°C for 2 min, 20× 98°C for 30 sec, 59.1°C for 30 sec, 72°C for 45 sec, 1× 72°C for 3 min. PCR amplicons from each sample were pooled and 50 μL was separated by running on a 2% TBE-agarose gel. The PCR products were excised and purified using a Qiagen Gel Purification Kit according to manufacturer’s instructions. The sgRNA libraries were analyzed by deep sequencing on an Illumina NextSeq using the custom sequencing primer oMCB 1672.
SDS PAGE and immunoblotting
Proteins were denatured by heating at 65°C for 10 minutes in 1X Laemmli buffer containing 2% (v/v) 2-mercaptoethanol. Samples were separated by SDS-PAGE and transferred onto Immobilon-FL low fluorescence PVDF (Sigma-Aldrich) or nitrocellulose membrane (BioRad Laboratories) using a semidry transfer apparatus (BioRad Laboratories). Membranes were blocked with 5% nonfat milk in PBS-T or LICOR blocking buffer for 30 min - 1 hr at room temperature before incubating with primary antibody in 2.5% bovine serum albumin (Sigma-Aldrich) and PBS-T for at least 2 hr. Membranes were washed extensively in PBS-T and then incubated with fluorescence-conjugated secondary antibodies in PBS-T for 45–90 min. Immunoblots were extensively washed in PBS-T and visualized on a LI-COR imager (LI-COR Biosciences) and quantified using ImageStudio Lite v5.0.21 (LI-COR Biosciences).
Ub linkages were detected by immunoblotting with linkage and topology-specific antibodies essentially as described (Newton et al., 2012). Briefly, samples were separated by SDS-PAGE and transferred onto 0.45 μM nitrocellulose membrane by wet transfer at 30 V for 2 hr. Membranes were blocked in 5% nonfat milk in PBS-T for 1 hr before incubating with primary antibody in 5% nonfat milk in PBS-T for 1 hr. Membranes were washed extensively in PBS-T and then incubated with fluorescenceconjugated secondary antibody in 5% nonfat milk in PBS-T for 1 hr, followed by extensive washing in PBS-T and visualizing on a LI-COR imager.
XBP1 splicing assay
RNA was isolated from 5×10⁵-1×10⁶ cells using a RNeasy mini kit (Qiagen) according to manufacturer’s instructions and cDNA was generated from 500 ng of RNA using SuperScript IV reverse transcriptase (Invitrogen) according to manufacturer’s instructions. XBP1 or PGK1 was amplified from 0.1 μL of cDNA product. PCR products were separated on a 2% TBE-agarose gel and visualized on a UV transilluminator.
Protein purification
Halo-UBQLN1 4X UBA (Ordureau et al., 2014) recombinant protein was a generous gift from W. Harper (Harvard University, Cambridge, MA). Recombinant Halo-TRABID NZF1 and vOTU1−183 were expressed in BL21(DE3) E. coli cells. Cultures were grown in LB medium to an OD600 of 0.8 and the protein was induced by adding 300 μM of IPTG and incubating overnight at 16°C. For Halo-TRABID NZF1 expression, the LB medium was supplemented with 200 μM ZnCl2 (Sigma-Aldrich). Cells were harvested and resuspended in GST lysis buffer (50 mM Tris-HCl, pH 7.5, 300 mM NaCl, 10% glycerol, 0.075% 2-mercaptoethanol, Roche protease inhibitor cocktail, 25 mM lysozyme), incubated on ice for 30 minutes, and then sonicated. Lysates were clarified by centrifuging at 13,000 xg for 20 minutes and incubated with Glutathione Sepharose 4B resin (GE Healthcare) for 2 hr at 4°C. The resin was washed with high salt buffer (250 mM Tris pH 7.5, 500 mM NaCl, 5 mM DTT) and low salt buffer (25 mM Tris pH 7.5, 150 mM NaCl, 10% glycerol, 1 mM DTT). Recombinant proteins were eluted by incubating overnight at 4°C with PreScission Protease (GE Healthcare). Usp2cc recombinant protein was previously described (Tyler et al., 2012).
To conjugate Halo-tagged recombinant proteins to HaloLINK resin, 3.2 ml of HaloLINK slurry (Promega Corporation) was washed three times with binding buffer (50 mM Tris-HCl, pH 7.5, 150 mM NaCl, 0.05% NP-40) before adding 2 mg of recombinant protein. The volume was adjusted to 2 ml by adding binding buffer (for Halo-UBLN1 4X UBA) or binding buffer supplemented with 1 mM DTT (for Halo-TRABID NZF1). Samples were rotated at room temperature for 1 hr or overnight at 4°C, unconjugated protein was removed by washing the resin five times with binding buffer, and immobilized recombinant protein was stored at 4°C.
PolyUb affinity capture
Dox-stimulated GFPu* reporter K562 cells were harvested by centrifuging at 1,000 xg for 5 min, washed twice with PBS, and lysed in 1% NP-40 lysis buffer (50 mM Tris-HCl pH 7.5, 150 mM NaCl, 1% NP-40, Roche protease inhibitor cocktail) supplemented with 10 mM N-ethylmaleimide. Lysates were incubated at 4°C for 15 min before clearing by centrifuging at 20,000 xg at 4°C for 15 min. Protein concentration was measured using a BCA protein assay kit (Pierce), adjusted to 4 mg/mL with 1% NP-40 lysis buffer without N-ethylmaleimide, and then further diluted to 1 mg/mL with Dilution Buffer (50 mM Tris-HCl, pH 7.5, 150 mM NaCl, 5 mM EDTA, Roche protease inhibitor cocktail). For Halo-UBQLN1 UBA affinity captures, 0.5 mg of cell lysate was added to 75 μg of immobilized recombinant protein and rotated at 4°C for 16 hr. Beads were washed three times with High Salt Wash Buffer (50 mM Tris-HCl pH 7.5, 500 mM NaCl, 0.5% NP-40) and once with 10 mM Tris-HCl, pH 7.5. For Halo-TRABID NZF1 affinity captures, 0.5 mg of cell lysate was added to 85 μg of immobilized recombinant protein and rotated at 4°C for 1.5 hr. Beads were washed three times with Low Salt Wash Buffer (50 mM Tris-HCl, pH 7.5, 150 mM NaCl, 0.25% NP-40).
For DUB digestions, affinity captured material was washed 1X with DUB Digestion Buffer (50 mM Tris-HCl, pH 7.5, 150 mM NaCl, 20 mM DTT), liquid was removed, and beads were resuspended in 20 μL of DUB Digestion Buffer and incubated at room temperature for 5 minutes. Beads were subsequently incubated with 2.5 μM vOTU1−183 or 3 μg of Usp2cc for 1 hr with gentle shaking at 30°C. Affinity captured material was eluted from the beads by adding Laemmli buffer containing 2% (v/v) 2-mercaptoethanol and incubating at 65°C for 15 min. Eluted proteins and 2% of input were analyzed by SDS-PAGE and immunoblotting.
Immunoprecipitations
Denaturing immunoprecipitations using linkage-specific antibodies were performed essentially as described (Newton et al., 2012). Briefly, INSIG1-GFP or A1ATNHK-GFP reporter K562 cells treated with dox for 16 hr and 5 μM NMS-873 or 10 μM MG132 for 4 hr were resuspended in two cell volumes of Denaturing Lysis Buffer I (8 M urea, 20 mM Tris-HCl, pH 7.5, 135 mM NaCl, 1% TX-100, 10% glycerol, 1.5 mM MgCl2, 5 mM EDTA, Roche protease inhibitor cocktail, 2 mM N-ethylmaleimide). Samples were sonicated and rotated at room temperature for 30 min before diluting with an equal volume of Denaturing Lysis Buffer lacking urea. Lysates were cleared by centrifuging at 20,000 xg for 15 min and then incubated with Protein A/G Plus Agarose (Pierce) for 1.5 hr at room temperature. 4.5 mg of pre-cleared lysate was incubated with 40 μg of antibody for 12 hr at room temperature and Protein A/G Plus Agarose beads for 1 hr. Beads were washed five times in Urea Wash Buffer (4 M urea, 20 mM Tris-HCl, pH 7.5, 135 mM NaCl, 1% TX-100, 10% glycerol, 1.5 mM MgCl2, 1 mM EDTA) and bound proteins were eluted by adding Laemmli buffer containing 2% (v/v) 2-mercaptoethanol and incubating at 65°C for 10 min.
Immunoprecipitations using α-GFP JL-8 antibody were performed by lysing in two cell pellet volumes of Denaturing Lysis Buffer II (8 M urea, 20 mM Tris-HCl, pH 7.5, 135 mM NaCl, 1% TX-100, 1.5 mM MgCl2, 5 mM EDTA, 50 mM 2-chloroacetamide, 50 μM PR-619, 1 mM PMSF, Roche protease inhibitor cocktail). Lysates were sonicated and rotated at room temperature for 30 min before diluting 1:10 in Denaturing Lysis Buffer II without urea. Lysates were centrifuging at 20,000 xg at 4°C for 15 min and then pre-cleared by incubating with Protein A/G Plus Agarose for 1–2 hr at 4°C. The α-GFP JL-8 antibody was crosslinked to A/G Plus Agarose beads using the Pierce Crosslink IP Kit according to manufacturer’s instructions and then incubated with lysates for 12 hr at 4°C. For western blot analysis, beads were washed four times in Denaturing Lysis Buffer II without urea, then denatured by incubating at 65°C for 10 min in Laemmli buffer without 2-mercaptoethanol. Beads were removed, and the eluted material was heated for 65°C for 5 min in the presence of 2% (v/v) 2-mercaptoethanol. For LC-MS/MS analysis, beads were washed three times in High Salt IP Wash Buffer (50 mM Tris-HCl, pH 7.5, 500 mM NaCl, 5 mM EDTA, 1% TX-100), three times in Low Salt IP Wash Buffer (50 mM Tris-HCl, pH 7.5, 150 mM NaCl, 5 mM EDTA, 1% TX-100), and four times in 50 mM NH4HCO3. Immunoprecipitated material was eluted and prepared for LC-MS/MS analysis as described below.
LC-MS/MS analysis
Immunoprecipitated material bound to Protein A/G beads was eluted by heating at 65 °C for 10 min in 25μl of 0.1% RapiGest SF Surfactant (Waters) in 50 mM NH4HCO3. Eluted proteins were moved to a fresh tube, the elution procedure was repeated 1X, and elutions were pooled. TCEP was added to a final concentration of 4.8 mM and samples were heated at 65°C for 15 min, then 2-chloroacetamide was added to a final concentration of 14 mM and samples were incubated at room temperature in the dark for 1 hr. Samples were digested with 150ng of mass spectrometry-grade trypsin (Promega) at 37°C for 12 hr. RapiGest was precipitated by adjusting the pH to 2 with 0.5M HCl and incubating at 37°C for 1 hr, then centrifuging at room temperature at 20,000 xg for 10 min. Peptides were desalted with the stage-tip method (Rappsilber et al., 2007), dried in a Speedvac, and reconstituted in 10 μl of 0.1 % formic acid.
Desalted peptides were analyzed on an LTQ Orbitrap Elite mass spectrometer (Thermo Fisher Scientific) or a Fusion Lumos mass spectrometer (Thermo Fisher Scientific) for identification of INSIG1 KGG peptides or Ub KGG peptides, respectively. Peptides were separated on a 20 cm reversed phase capillary column (100 μm inner diameter, packed in-house with ReproSil-Pur C18-AQ 3.0 m resin (Dr. Maisch GmbH)). The Orbitrap Elite was equipped with an Eksigent ekspert nanoLC-425 system (Sciex) using a two-step linear gradient with 3–25% buffer B (0.2% (v/v) formic acid and 5% DMSO in acetonitrile) for 70 min followed by 25–40% buffer B for 20 min. The Fusion Lumos was equipped with a Dionex Ultimate 3000 LC-system and used a similar two-step linear gradient with 4–25% buffer B (0.1% (v/v) formic acid in acetonitrile) for 80 min followed by 25–45% buffer B for 10 min.
For sample analysis with the Orbitrap Elite system, data acquisition was executed in data dependent mode with full MS scans acquired in the Orbitrap mass analyzer with a resolution of 60,000 and m/z scan range of 340–2,000. The top 20 most abundant ions from MS1 with intensity threshold above 500 counts and charge states 2 and above were selected for fragmentation using collision-induced dissociation (CID) with isolation window of 2 m/z, collision energy of 35%, activation Q of 0.25 and activation time of 5 ms. The CID fragments were analyzed in the ion trap with rapid scan rate. Fragmented ions were dynamically excluded from further selection for a period of 30 seconds. The AGC target was set to 1,000,000 and 5,000 for full FTMS scans and ITMSn scans, respectively. The maximum injection time was set to 250 ms and 100 ms for full FTMS scans and ITMSn scans, respectively. For sample analysis with the Fusion Lumos system, the data were acquired in top speed data dependent mode with a duty cycle time of 3 s. Full MS scans were acquired in the Orbitrap mass analyzer with a resolution of 120,000 and m/z scan range of 340–1,540. Precursor ions with intensity above 50,000 were selected for fragmentation using higher-energy collisional dissociation (HCD) with quadrupole isolation, isolation window of 1.6 m/z, normalized collision energy of 30%, and precursor ions of charge state +1 excluded. MS2 fragments were analyzed in the Orbitrap mass analyzer with a resolution of 15,000. Fragmented ions were dynamically excluded from further selection for a period of 30 s. The AGC target was set to 400,000 and 500,00 for full FTMS scans and FTMS2 scans. The maximum injection time was set to 50 ms and 200 ms for full FTMS scans and FTMS2 scans.
The resulting spectra were searched against a “target-decoy” sequence database(Elias and Gygi, 2007) consisting of the Uniprot human database (downloaded June 13, 2016) and the sequence of INSIG1-GFP and A1ATNHK-GFP, and the corresponding reversed sequences using the SEQUEST algorithm (version 28, revision 12)(Eng et al., 1994) in an in-house software pipeline (Huttlin et al., 2010). The parent mass tolerance was set to +/−10 ppm and the fragment mass tolerance was set to 0.6 Da for Elite data and 0.02 Da for Fusion data. Enzyme specificity was set to trypsin. Oxidation of methionines and GG modification of lysine (114.0429) was set as variable modification and carbamidomethylation of cysteines was set as static modification. Data was filtered to a 1% peptide false discovery rate using a linear discriminator analysis. Precursor peak areas were calculated for protein quantification.
QUANTIFICATION AND STATISTICAL ANALYSIS
Data are represented as an average ± SEM unless otherwise stated. The number of independent replicates performed for each experiment is indicted in the figure legends. Western blot band intensities were quantified using ImageStudio Lite version 5.0.21 (LI-COR Biosciences) and normalized to total protein or GAPDH. Flow cytometry data were quantified by calculating the median fluorescence intensity of the population using FlowJo version 10.0.8 (FlowJo, LLC). Protein remaining was calculated as a percentage of time 0 and one-phase exponential decay curves were fit using Prism 7 (GraphPad Software). Data from each replicate were log transformed and fit with a linear regression, and P-values were obtained by comparing replicate slopes with the Student’s t-test.
sgRNA sequences from the genetic screens were aligned to the 10-guide sgRNA library using Bowtie version 1.1.2 and a likely maximum effect size, score, and P-value were calculated for each gene using the casTLE statistical framework (Morgens et al., 2016).
DATA AND SOFTWARE AVAILABILITY
Sequencing data are available in Supplemental Table S2.
Supplementary Material
Table S4. Degradation rates and gene effects measured for genes shown in Fig. 1E, Related to Figure 1.
Table S1. CRISPR/Cas9 screen results, Related to Figure 1.
Table S2. Guide counts from each screen, Related to Figure 1.
Table S3. Genes included in Figs. S3A-B, by category, Related to Figures 1F and S3.
Table S5. Summary of LC-MS/MS analysis, Related to Figure 3.
HIGHLIGHTS.
A novel genetic screening method reports quantitative protein degradation rates.
Systems-level analysis deconvolves substrate specificity in mammalian ERAD.
Ricin A chain exploits a ‘fast track’ route through the Hrd1 dislocon.
Cytosolic ubiquitin ligases conjugate branched/mixed chains to promote ERAD.
Acknowledgments
We thank Amy Li and Gaelen Hess (Stanford University) for providing reagents and protocols, Alban Ordureau and Wade Harper (Harvard Medical School) for providing the Halo-TUBE recombinant protein, and Marissa Matsumoto (Genentech) and Diane Haakonsen (University of California - Berkeley) for technical guidance for use of the Ub linkage and topology-specific antibodies. Sorting protocols were developed with help from Cathy Crumpton at the Stanford Shared FACS Facility (SSFF). Cell sorting and flow cytometry analysis was performed using instruments in the SSFF obtained using NIH S10 Shared Instrument Grants S10RR025518–01 and S10RR027431–01. This work was supported by a grant from the National Institute of General Medical Sciences (R01GM074874) and a generous gift from the Becker Family Foundation to RRK. DEL was supported by postdoctoral fellowships from the NIH (F32GM113370) and the Alpha-1 foundation. CW was supported by postdoctoral fellowships from the NIH (F32GM113378) and Cystic Fibrosis Research, Inc (CFRI).
Footnotes
Publisher's Disclaimer: This is a PDF file of an unedited manuscript that has been accepted for publication. As a service to our customers we are providing this early version of the manuscript. The manuscript will undergo copyediting, typesetting, and review of the resulting proof before it is published in its final citable form. Please note that during the production process errors may be discovered which could affect the content, and all legal disclaimers that apply to the journal pertain.
Declaration of interests
The authors declare no conflicts of interest.
References
- Bence N, Sampat R, and Kopito RR (2001). Impairment of the Ubiquitin-Proteasome System by Protein Aggregation. Science 292, 1552–1555. [DOI] [PubMed] [Google Scholar]
- Boname JM, Bloor S, Wandel MP, Nathan JA, Antrobus R, Dingwell KS, Thurston TL, Smith DL, Smith JC, Randow F, et al. (2014). Cleavage by signal peptide peptidase is required for the degradation of selected tail-anchored proteins. J Cell Biol 205, 847–862. [DOI] [PMC free article] [PubMed] [Google Scholar]
- Carvalho P, Goder V, and Rapoport TA (2006). Distinct ubiquitin-ligase complexes define convergent pathways for the degradation of ER proteins. Cell 126, 361–373. [DOI] [PubMed] [Google Scholar]
- Casson J, McKenna M, and High S (2016). On the road to nowhere: cross-talk between post-translational protein targeting and cytosolic quality control. Biochem Soc Trans 44, 796–801. [DOI] [PubMed] [Google Scholar]
- Chen JJ, Tsu CA, Gavin JM, Milhollen MA, Bruzzese FJ, Mallender WD, Sintchak MD, Bump NJ, Yang X, Ma J, et al. (2011). Mechanistic studies of substrate-assisted inhibition of ubiquitin-activating enzyme by adenosine sulfamate analogues. J Biol Chem 286, 40867–40877. [DOI] [PMC free article] [PubMed] [Google Scholar]
- Chen CY, Malchus NS, Hehn B, Stelzer W, Avci D, Langosch D, and Lemberg MK (2014). Signal peptide peptidase functions in ERAD to cleave the unfolded protein response regulator XBP1u. Embo J 33, 2492–2506. [DOI] [PMC free article] [PubMed] [Google Scholar]
- Christianson JC, Olzmann JA, Shaler TA, Sowa ME, Bennett EJ, Richter CM, Tyler RE, Greenblatt EJ, Harper JW, and Kopito RR (2011). Defining human ERAD networks through an integrative mapping strategy. Nat Cell Biol 14, 93–105. [DOI] [PMC free article] [PubMed] [Google Scholar]
- Christianson JC, Shaler TA, Tyler RE, and Kopito RR (2008). OS-9 and GRP94 deliver mutant alpha1-antitrypsin to the Hrd1-SEL1L ubiquitin ligase complex for ERAD. Nat Cell Biol 10, 272–282. [DOI] [PMC free article] [PubMed] [Google Scholar]
- Christianson JC, and Ye Y (2014). Cleaning up in the endoplasmic reticulum: ubiquitin in charge. Nat Struct Mol Biol 21, 325–335. [DOI] [PMC free article] [PubMed] [Google Scholar]
- Chu BW, Kovary KM, Guillaume J, Chen LC, Teruel MN, and Wandless TJ (2013). The E3 ubiquitin ligase UBE3C enhances proteasome processivity by ubiquitinating partially proteolyzed substrates. J Biol Chem 288, 34575–34587. [DOI] [PMC free article] [PubMed] [Google Scholar]
- Crosas B, Hanna J, Kirkpatrick DS, Zhang DP, Tone Y, Hathaway NA, Buecker C, Leggett DS, Schmidt M, King RW, et al. (2006). Ubiquitin chains are remodeled at the proteasome by opposing ubiquitin ligase and deubiquitinating activities. Cell 127, 1401–1413. [DOI] [PubMed] [Google Scholar]
- Deans RM, Morgens DW, Okesli A, Pillay S, Horlbeck MA, Kampmann M, Gilbert LA, Li A, Mateo R, Smith M, et al. (2016). Parallel shRNA and CRISPR-Cas9 screens enable antiviral drug target identification. Nat Chem Biol 12, 361–366. [DOI] [PMC free article] [PubMed] [Google Scholar]
- Dull T, Zufferey R, Kelly M, Mandel RJ, Nguyen M, Trono D, and Naldini L (1998). A third-generation lentivirus vector with a conditional packaging system. J Virol 72, 8463–8471. [DOI] [PMC free article] [PubMed] [Google Scholar]
- Elias JE, and Gygi SP (2007). Target-decoy search strategy for increased confidence in large-scale protein identifications by mass spectrometry. Nat Methods 4, 207–214. [DOI] [PubMed] [Google Scholar]
- Eng JK, McCormack AL, and Yates JR (1994). An approach to correlate tandem mass spectral data of peptides with amino acid sequences in a protein database. J Am Soc Mass Spectrom 5, 976–989. [DOI] [PubMed] [Google Scholar]
- Ghaemmaghami S, Huh WK, Bower K, Howson RW, Belle A, Dephoure N, O’Shea EK, and Weissman JS (2003). Global analysis of protein expression in yeast. Nature 425, 737–741. [DOI] [PubMed] [Google Scholar]
- Gilon T, Chomsky O, and Kulka RG (1998). Degradation signals for ubiquitin system proteolysis in Saccharomyces cerevisiae. Embo J 17, 2759–2766. [DOI] [PMC free article] [PubMed] [Google Scholar]
- Guerriero CJ, and Brodsky JL (2012). The delicate balance between secreted protein folding and endoplasmic reticulum-associated degradation in human physiology. Physiol Rev 92, 537–576. [DOI] [PMC free article] [PubMed] [Google Scholar]
- Hager S, Frame FM, Collins AT, Burns JE, and Maitland NJ (2008). An internal polyadenylation signal substantially increases expression levels of lentivirus-delivered transgenes but has the potential to reduce viral titer in a promoter-dependent manner. Hum Gene Ther 19, 840–850. [DOI] [PubMed] [Google Scholar]
- Han K, Jeng EE, Hess GT, Morgens DW, Li A, and Bassik MC (2017). Synergistic drug combinations for cancer identified in a CRISPR screen for pairwise genetic interactions. Nat Biotechnol 35, 463–474. [DOI] [PMC free article] [PubMed] [Google Scholar]
- Hong JH, Kaustov L, Coyaud E, Srikumar T, Wan J, Arrowsmith C, and Raught B (2015). KCMF1 (potassium channel modulatory factor 1) Links RAD6 to UBR4 (ubiquitin N-recognin domain-containing E3 ligase 4) and lysosome-mediated degradation. Mol. Cell Proteomics 14, 674–685. [DOI] [PMC free article] [PubMed] [Google Scholar]
- Huang CH, Chu YR, Ye Y, and Chen X (2014). Role of HERP and a HERP-related protein in HRD1-dependent protein degradation at the endoplasmic reticulum. J Biol Chem 289, 4444–4454. [DOI] [PMC free article] [PubMed] [Google Scholar]
- Huttlin EL, Jedrychowski MP, Elias JE, Goswami T, Rad R, Beausoleil SA, Villen J, Haas W, Sowa ME, and Gygi SP (2010). A tissue-specific atlas of mouse protein phosphorylation and expression. Cell 143, 1174–1189. [DOI] [PMC free article] [PubMed] [Google Scholar]
- Johnson PR, Swanson R, Rakhilina L, and Hochstrasser M (1998). Degradation signal masking by heterodimerization of MATalpha2 and MATa1 blocks their mutual destruction by the ubiquitin proteasome pathway. Cell 94, 217–227. [DOI] [PubMed] [Google Scholar]
- Komander D, and Rape M (2012). The ubiquitin code. Annu Rev Biochem 81, 203–229. [DOI] [PubMed] [Google Scholar]
- Kristariyanto YA, Abdul Rehman SA, Campbell DG, Morrice NA, Johnson C, Toth R, and Kulathu Y (2015). K29-selective ubiquitin binding domain reveals structural basis of specificity and heterotypic nature of k29 polyubiquitin. Mol Cell 58, 83–94. [DOI] [PMC free article] [PubMed] [Google Scholar]
- Langmead B, Trapnell C, Pop M, and Salzberg SL (2009). Ultrafast and memory-efficient alignment of short DNA sequences to the human genome. Genome Biol 10, R25. [DOI] [PMC free article] [PubMed] [Google Scholar]
- Lee JN, Song B, DeBose-Boyd RA, and Ye J (2006). Sterol-regulated degradation of Insig-1 mediated by the membrane-bound ubiquitin ligase gp78. J Biol Chem 281, 39308–39315. [DOI] [PubMed] [Google Scholar]
- Li C, Wen A, Shen B, Lu J, Huang Y, and Chang Y (2011). FastCloning: a highly simplified, purification-free, sequence- and ligation-independent PCR cloning method. BMC Biotechnol 11, 92. [DOI] [PMC free article] [PubMed] [Google Scholar]
- Li S, Spooner RA, Allen SC, Guise CP, Ladds G, Schnoder T, Schmitt MJ, Lord JM, and Roberts LM (2010). Folding-competent and folding-defective forms of ricin A chain have different fates after retrotranslocation from the endoplasmic reticulum. Mol Biol Cell 21, 2543–2554. [DOI] [PMC free article] [PubMed] [Google Scholar]
- Magnaghi P, D’Alessio R, Valsasina B, Avanzi N, Rizzi S, Asa D, Gasparri F, Cozzi L, Cucchi U, Orrenius C, et al. (2013). Covalent and allosteric inhibitors of the ATPase VCP/p97 induce cancer cell death. Nat Chem Biol 9, 548–556. [DOI] [PubMed] [Google Scholar]
- McCracken AA, and Brodsky JL (1996). Assembly of ER-associated protein degradation in vitro: dependence on cytosol, calnexin, and ATP. J Cell Biol 132, 291–298. [DOI] [PMC free article] [PubMed] [Google Scholar]
- Meyer HJ, and Rape M (2014). Enhanced protein degradation by branched ubiquitin chains. Cell 157, 910–921. [DOI] [PMC free article] [PubMed] [Google Scholar]
- Michel MA, Elliott PR, Swatek KN, Simicek M, Pruneda JN, Wagstaff JL, Freund SM, and Komander D (2015). Assembly and specific recognition of k29- and k33-linked polyubiquitin. Mol Cell 58, 95–109. [DOI] [PMC free article] [PubMed] [Google Scholar]
- Morgens DW, Deans RM, Li A, and Bassik MC (2016). Systematic comparison of CRISPR/Cas9 and RNAi screens for essential genes. Nat Biotechnol 34, 634–636. [DOI] [PMC free article] [PubMed] [Google Scholar]
- Morgens DW, Wainberg M, Boyle EA, Ursu O, Araya CL, Tsui CK, Haney MS, Hess GT, Han K, Jeng EE, et al. (2017). Genome-scale measurement of off-target activity using Cas9 toxicity in high-throughput screens. Nat Commun 8, 15178. [DOI] [PMC free article] [PubMed] [Google Scholar]
- Neal S, Jaeger PA, Duttke SH, Benner C, Glass CK, Ideker T, and Hampton RY (2018). The Dfm1 Derlin Is Required for ERAD Retrotranslocation of Integral Membrane Proteins. Mol Cell 69, 915. [DOI] [PubMed] [Google Scholar]
- Newton K, Matsumoto ML, Ferrando RE, Wickliffe KE, Rape M, Kelley RF, and Dixit VM (2012). Using linkage-specific monoclonal antibodies to analyze cellular ubiquitylation. Methods Mol Biol 832, 185–196. [DOI] [PubMed] [Google Scholar]
- Ohtake F, Tsuchiya H, Saeki Y, and Tanaka K (2018). K63 ubiquitylation triggers proteasomal degradation by seeding branched ubiquitin chains. Proc Natl Acad Sci U S A 115, E1401–E1408. [DOI] [PMC free article] [PubMed] [Google Scholar]
- Olzmann JA, Kopito RR, and Christianson JC (2013). The mammalian endoplasmic reticulum-associated degradation system. Cold Spring Harb Perspect Biol 5. [DOI] [PMC free article] [PubMed] [Google Scholar]
- Ordureau A, Sarraf SA, Duda DM, Heo J-M, Jedrychowski MP, Sviderskiy VO, Olszewski JL, Koerber JT, Xie T, Beausoleil SA, et al. (2014). Quantitative proteomics reveal a feedforward mechanism for mitochondrial PARKIN translocation and ubiquitin chain synthesis. Mol Cell 56, 360–375. [DOI] [PMC free article] [PubMed] [Google Scholar]
- Parnas O, Jovanovic M, Eisenhaure TM, Herbst RH, Dixit A, Ye CJ, Przybylski D, Platt RJ, Tirosh I, Sanjana NE, et al. (2015). A Genome-wide CRISPR Screen in Primary Immune Cells to Dissect Regulatory Networks. Cell 162, 675–686. [DOI] [PMC free article] [PubMed] [Google Scholar]
- Printsev I, Curiel D, and Carraway KL 3rd (2017). Membrane Protein Quantity Control at the Endoplasmic Reticulum. J Membr Biol 250, 379–392. [DOI] [PMC free article] [PubMed] [Google Scholar]
- Rappsilber J, Mann M, and Ishihama Y (2007). Protocol for micro-purification, enrichment, prefractionation and storage of peptides for proteomics using StageTips. Nat Protoc 2, 1896–1906. [DOI] [PubMed] [Google Scholar]
- Ready MP, Kim Y, and Robertus JD (1991). Site-directed mutagenesis of ricin A-chain and implications for the mechanism of action. Proteins 10, 270–278. [DOI] [PubMed] [Google Scholar]
- Redmann V, Oresic K, Tortorella LL, Cook JP, Lord M, and Tortorella D (2011). Dislocation of ricin toxin A chains in human cells utilizes selective cellular factors. J Biol Chem 286, 21231–21238. [DOI] [PMC free article] [PubMed] [Google Scholar]
- Ritorto MS, Ewan R, Perez-Oliva AB, Knebel A, Buhrlage SJ, Wightman M, Kelly SM, Wood NT, Virdee S, Gray NS, et al. (2014). Screening of DUB activity and specificity by MALDI-TOF mass spectrometry. Nat Commun 5, 4763. [DOI] [PMC free article] [PubMed] [Google Scholar]
- Roth J, and Zuber C (2017). Quality control of glycoprotein folding and ERAD: the role of N-glycan handling, EDEM1 and OS-9. Histochem Cell Biol 147, 269–284. [DOI] [PubMed] [Google Scholar]
- Ryu KY, Baker RT, and Kopito RR (2006). Ubiquitin-specific protease 2 as a tool for quantification of total ubiquitin levels in biological specimens. Anal Biochem 353, 153–155. [DOI] [PubMed] [Google Scholar]
- Shin J, Lee S, and Strominger JL (1993). Translocation of TCR alpha chains into the lumen of the endoplasmic reticulum and their degradation. Science 259, 1901–1904. [DOI] [PubMed] [Google Scholar]
- Spooner RA, and Lord JM (2012). How ricin and Shiga toxin reach the cytosol of target cells: retrotranslocation from the endoplasmic reticulum. Curr Top Microbiol Immunol 357, 19–40. [DOI] [PubMed] [Google Scholar]
- Spooner RA, and Lord JM (2015). Ricin trafficking in cells. Toxins (Basel) 7, 49–65. [DOI] [PMC free article] [PubMed] [Google Scholar]
- Stefanovic-Barrett S, Dickson AS, Burr SP, Williamson JC, Lobb IT, van den Boomen DJ, Lehner PJ, and Nathan JA (2018). MARCH6 and TRC8 facilitate the quality control of cytosolic and tail-anchored proteins. EMBO Rep 19. [DOI] [PMC free article] [PubMed] [Google Scholar]
- Sugimoto T, Ninagawa S, Yamano S, Ishikawa T, Okada T, Takeda S, and Mori K (2017). SEL1L-dependent Substrates Require Derlin2/3 and Herp1/2 for Endoplasmic Reticulum-associated Degradation. Cell Struct Funct 42, 81–94. [DOI] [PubMed] [Google Scholar]
- Tyler RE, Pearce MM, Shaler TA, Olzmann JA, Greenblatt EJ, and Kopito RR (2012). Unassembled CD147 is an endogenous endoplasmic reticulum-associated degradation substrate. Mol Biol Cell 23, 4668–4678. [DOI] [PMC free article] [PubMed] [Google Scholar]
- van der Goot AT, Pearce MMP, Leto DE, Shaler TA, and Kopito RR (2018). Redundant and Antagonistic Roles of XTP3B and OS9 in Decoding Glycan and Non-glycan Degrons in ER-Associated Degradation. Mol Cell 70, 516–530 e516. [DOI] [PMC free article] [PubMed] [Google Scholar]
- Vashist S, and Ng DT (2004). Misfolded proteins are sorted by a sequential checkpoint mechanism of ER quality control. J Cell Biol 165, 41–52. [DOI] [PMC free article] [PubMed] [Google Scholar]
- White EA, Sowa ME, Tan MJ, Jeudy S, Hayes SD, Santha S, Munger K, Harper JW, and Howley PM (2012). Systematic identification of interactions between host cell proteins and E7 oncoproteins from diverse human papillomaviruses. Proc Natl Acad Sci U S A 109, E260–267. [DOI] [PMC free article] [PubMed] [Google Scholar]
- Yau R, and Rape M (2016). The increasing complexity of the ubiquitin code. Nat Cell Biol 18, 579–586. [DOI] [PubMed] [Google Scholar]
- Yau RG, Doerner K, Castellanos ER, Haakonsen DL, Werner A, Wang N, Yang XW, Martinez-Martin N, Matsumoto ML, Dixit VM, et al. (2017). Assembly and Function of Heterotypic Ubiquitin Chains in Cell-Cycle and Protein Quality Control. Cell 171, 918–933 e920. [DOI] [PMC free article] [PubMed] [Google Scholar]
- You J, and Pickart CM (2001). A HECT domain E3 enzyme assembles novel polyubiquitin chains. J. Biol. Chem 276, 19871–19878. [DOI] [PubMed] [Google Scholar]
Associated Data
This section collects any data citations, data availability statements, or supplementary materials included in this article.
Supplementary Materials
Table S4. Degradation rates and gene effects measured for genes shown in Fig. 1E, Related to Figure 1.
Table S1. CRISPR/Cas9 screen results, Related to Figure 1.
Table S2. Guide counts from each screen, Related to Figure 1.
Table S3. Genes included in Figs. S3A-B, by category, Related to Figures 1F and S3.
Table S5. Summary of LC-MS/MS analysis, Related to Figure 3.
Data Availability Statement
Sequencing data are available in Supplemental Table S2.