
Figure 8.
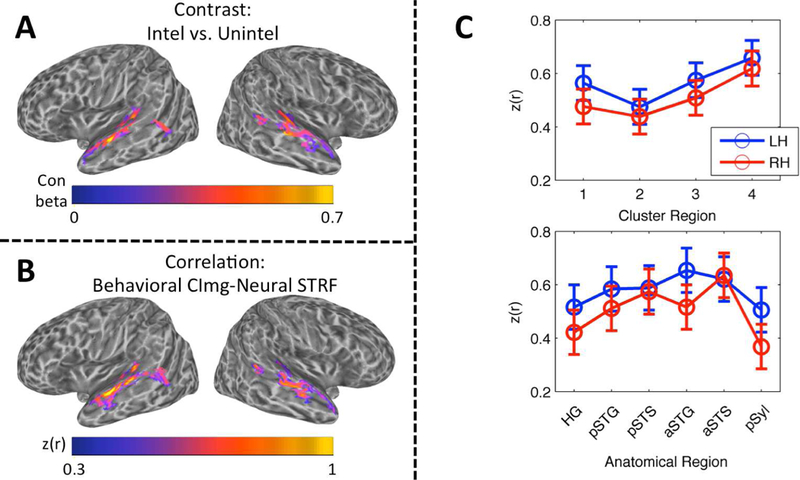
(A) Contrast Map of Speech Intelligibility. The group mean contrast beta (intelligible trials vs. unintelligible trials) is plotted on cortical surface renderings of the left and right hemispheres. Whole-brain analysis, wild-bootstrap-corrected p < 0.05. (B) Correlation Map of Speech Intelligibility. The group mean Fisher z-transformed correlation, z(r), between behavioral classification images for intelligibility and neural STRFs is plotted on cortical surface renderings of the left and right hemispheres. Whole-brain analysis, wild-bootstrap-corrected p < 0.05. (C) Linear Mixed Effects Analysis of Intelligibility Correlation Values. The mean of the LME-fitted values of the Fisher z-transformed correlation, z(r), between behavioral classification images for intelligibility and neural STRFs is plotted across cluster regions (top) and anatomical regions (bottom) in the left (blue) and right (red) hemispheres. Error bars reflect ± 1 SEM.