

Abstract
Objective:
Network meta-analysis (NMA) is increasingly being used to synthesize direct and indirect evidence and help decision makers simultaneously compare multiple treatments. We empirically evaluate the incremental gain in precision achieved by incorporating indirect evidence in NMAs.
Study Design and Setting:
We performed both network and pairwise meta-analyses on 40 published datasets of multiple-treatment comparisons. Their results were compared using the recently proposed borrowing of strength (BoS) statistic, which quantifies the percentage reduction in the uncertainty of the effect estimate when adding indirect evidence to an NMA.
Results:
We analyzed 915 possible treatment comparisons, from which 484 (53%) had no direct evidence (BoS = 100%). In 181 comparisons with only one study contributing direct evidence, NMAs resulted in reduced precision (BoS < 0) and no appreciable improvements in precision (0 < BoS < 30%) for 104 (57.5%) and 23 (12.7%) comparisons, respectively. In 250 comparisons with at least two studies contributing direct evidence, NMAs provided increased precision with BoS ≥ 30% for 166 (66.4%) comparisons.
Conclusion:
Although NMAs have the potential to provide more precise results than those only based on direct evidence, the incremental gain may reliably occur only when at least two head-to-head studies are available and treatments are well connected. Researchers should routinely report and compare the results from both network and pairwise meta-analyses.
Keywords: Bayesian analysis, Borrowing of strength, Indirect evidence, Network meta-analysis, Research synthesis, Systematic review
1. INTRODUCTION
In the recent fifteen years, network meta-analysis (NMA) has been frequently applied in evidence-based medicine to inform the relative benefits and harms of various treatments [1–3]. The fundamental idea is to simultaneously synthesize both direct and indirect evidence from all available studies of all related treatment comparisons, and thus to provide better decision making than conventional pairwise meta-analysis that separately and directly compares each pair of treatments [4–8]. Specifically, to compare two treatments A and B, the clinical studies that include both treatment groups provide the direct evidence for this comparison. However, such evidence may be sparse, especially when the two treatments are newly developed or when no financial incentive supports conducting head-to-head trials [9, 10]. Alternatively, more studies may be available to compare A or B with another common comparator, say C, which may be placebo or some well-established drugs. Consequently, these studies of A vs. C and B vs. C provide the indirect evidence for the comparison between A and B [11, 12]. The three treatments A, B, and C form an evidence loop (cycle) in the network. Because conventional pairwise meta-analysis can only use the direct evidence, NMA is expected to produce more precise evidence for decision making by using information from all studies [13]. For example, in a systematic review of 12 new-generation antidepressants [14], the pairwise meta-analysis estimated the odds ratio of escitalopram vs. fluoxetine as 1.23 with 95% confidence interval (0.87, 1.74), suggesting insufficient evidence for differential effects, while the NMA estimated it as 1.32 with 95% credible interval (1.12, 1.55), providing improved precision and indicating a significant difference between the two antidepressants in efficacy.
Comparing the results from an NMA with those from separate pairwise meta-analyses is critical for assessing the quality of evidence [15]. However, many NMAs were found to be inappropriately performed and inadequately reported [16–21]. Only a few NMAs explicitly compared the results produced by NMAs with those produced by conventional pairwise meta-analyses and showed how much indirect evidence was gained from NMAs [18]. Without such information and knowledge of the improved precision, NMAs may not be justified considering their complex statistical procedures [22, 23] and additional assumptions (e.g., transitivity and consistency for treatment comparisons) [6, 19, 24]. In addition, NMAs may complicate assessment of publication and reporting bias given that unpublished results may differentially occur in certain treatment groups in certain studies under diverse missingness scenarios [25–27]. In contrast, plenty of methods are available to test and adjust for such bias in pairwise meta-analyses [28–33]. Moreover, the publication and reporting bias in one treatment in an NMA may affect the ranking of all treatments, leading to completely wrong conclusions for decision making [34].
Recently, the borrowing of strength (BoS) statistic was proposed to quantify how much evidence (incremental precision) is gained in a multivariate meta-analysis (including NMA) [35–37]. It can be interpreted as the percentage reduction in the uncertainty of the effect estimate of a treatment comparison that benefits from the indirect evidence in an NMA. This empirical study uses the BoS statistic to explore the benefits of incorporating indirect evidence in NMAs.
2. METHODS
2.1. Borrowing of strength in NMA
The BoS statistic is defined as BoS = (1 − E) × 100%, where E is the ratio of the variance of the treatment effect estimate using an NMA to that using the direct evidence, representing the efficiency gained from the NMA [35, 36]. An NMA is often performed through Bayesian hierarchical models and researchers usually report the posterior median with a 95% credible interval (CrI) for each treatment comparison. Therefore, under the Bayesian framework, the efficiency E can be equivalently calculated as the squared ratio of the CrI length using the NMA (denoted as LNMA) to that using the direct evidence (denoted as Ldirect), because the CrI length roughly indicates uncertainty. Specifically, the BoS statistic can be calculated as for treatment comparisons in the NMA.
2.2. Data source
We extracted 45 NMAs with binary outcomes from a total of 58 NMAs investigated by Trinquart et al. [38], which were originated from the datasets collected by Veroniki et al. [39] and Bafeta et al. [17, 18]. Datasets that originally used extensions of the classical NMA model (e.g, models for competing-risk outcomes and evidence inconsistency) were excluded [38]. Also, we excluded 5 NMAs that addressed similar questions and had overlapping studies [40–44]. Finally, we obtained 40 NMAs which evaluated a variety of conditions with important morbidity, including rheumatoid arthritis, stroke, cancer, chronic hepatitis B infection, depressive disorder, vertebral fractures, major cardiovascular events, etc. Table S1 in the Supplementary Material describes the NMAs in terms of the number of studies, treatments, direct comparisons, and patients. Figure S1 depicts their geometry.
2.3. Statistical analysis
The included studies in a systematic review are likely heterogeneous because they were conducted at different places using different clinical methods on different populations [45–49]. Therefore, regardless of the original methods used in the 40 NMA datasets, we used a Bayesian random-effects NMA model to account for the heterogeneity between studies [5]. We assumed that the between-study variances τ2 were equal for all treatment comparisons in each NMA, and the correlation coefficient between each pair of comparisons within each study was 0.5 [5, 50]. Informative log-normal priors suggested by Turner et al. [51] were used for the between-study variances τ2; Table S1 in the Supplementary Material shows the specific prior for each dataset. Also, direct and indirect evidence was assumed to be consistent. These assumptions greatly reduced model complexity and have been frequently adopted in similar studies [52]. We applied the NMA model for each dataset and obtained the 95% CrI of the odds ratio of each treatment comparison. All odds ratios were used on a logarithmic scale when calculating the BoS statistics.
When a treatment comparison was directly given by at least two studies, we applied a Bayesian pairwise meta-analysis model to calculate the 95% CrI based on the direct evidence of each comparison [53], instead of using the traditional frequentist inverse-of-variance or DerSimonian–Laird method [54]. This Bayesian pairwise meta-analysis can be viewed as a special case of the Bayesian NMA model when a network contains only two treatments. Also, it used the same informative log-normal prior for the between-study variance as in the corresponding NMA. By conducting the analyses under the same Bayesian framework, we can fairly compare the results produced by the pairwise meta-analysis and the NMA.
The BoS statistic was computed for each treatment comparison and classified into three mutually exclusive scenarios (Table 1). In the first scenario (no direct evidence exists), the NMA estimate was entirely derived from indirect evidence. The CrI of the direct estimate can be considered as (−∞, +∞) leading to efficiency E = 0 and thus BoS statistic = 100%. In the latter two scenarios, the BoS statistics were strictly less than 100% because direct evidence must have a portion of contributions, no matter how small, to overall evidence. Of note, in these scenarios, the BoS statistics may be negative because the random-effects NMA incorporated the between-study variance, which was assumed common across the network, in the effect estimate; thus the total variation of a specific effect estimate in the NMA was not necessarily smaller than the variation of the direct estimate (from a single study or pairwise meta-analysis) [35]. Negative BoS statistics indicated reduced precision in NMAs compared to using only direct evidence, and suggested iatrogenic rather than beneficial effects of NMAs.
Table 1.
Interpretation of the borrowing of strength (BoS) statistic.
| Case | Interpretation |
|---|---|
| General case | The percentage reduction in the uncertainty (imprecision or variance) of the effect estimate of a treatment comparison that benefits from indirect evidence in an NMA; i.e., it can be conceptualized as (indirect evidence) / (direct evidence + indirect evidence) × 100%. |
| For a treatment comparison not directly given by any studies | The effect estimate is entirely informed by indirect evidence, so the BoS statistic is conceptually 100%. |
| For a treatment comparison directly given by only one study | Only a single study contributes direct evidence, so the BoS statistic reflects the comparison between the NMA and the single study. |
| For a treatment comparison directly given by at least two studies | A pairwise meta-analysis of multiple studies contributes to direct evidence, so the BoS statistic reflects and comparison between the NMA and the pairwise meta-analysis. |
Moreover, we explored the relationship between the networks’ geometry and their BoS statistics. We roughly classified the 40 networks into well-connected ones and sparsely-connected ones. A network was considered sparsely-connected if at least 1/3 of its treatments were not contained in any evidence loop; otherwise, it was considered well-connected. We compared the BoS statistics in the two groups of networks using Wilcoxon rank sum test (assuming the independence of the BoS statistics), instead of the t-test, because some treatment comparisons had outlying BoS statistics. In addition, we investigated how the results from NMAs and those based on only direct evidence led to different go/no-go decisions regarding treatment comparisons. A treatment comparison was considered significantly different if the CrI of its odds ratio did not contain 1.0.
The Bayesian analyses were implemented using the Markov chain Monte Carlo (MCMC) algorithm via the R package “rjags” [55]. The results were based on three Markov chains, each having 200,000 iterations after a 50,000-run burn-in period with thinning rate 2 for reducing sample autocorrelations. The convergence of all Markov chains was checked according to their trace plots.
3. RESULTS
3.1. Distribution of BoS statistic
In the 40 datasets, there were 915 possible treatment comparisons; 484 comparisons had no direct evidence, so their BoS statistics were 100%. Among the remaining 431 comparisons with direct evidence, 181 were directly given by only one study, and 250 were directly given by at least two studies.
Figure 1 presents the histogram of the BoS statistics of all treatment comparisons. Among the 250 comparisons directly given by at least two studies, the BoS statistics of 9 comparisons (3.6%) were larger than 90%, those of 25 comparisons (10.0%) fell within the range of 80%–90%, 30 (12.0%) within 70%–80%, 29 (11.6%) within 60%–70%, 24 (9.6%) within 50%–60%, 21 (8.4%) within 40%–50%, and 28 (11.2%) within 30%–40%. In other words, the uncertainty of effect estimates was reduced by at least 30% when using NMAs for the majority of these comparisons (66.4%). Also, the BoS statistics of 48 (19.2%) treatment comparisons were between 0 and 30%, and those of 36 (14.4%) comparisons were below zero.
Figure 1.

Histogram of borrowing of strength statistics in the 40 datasets
However, among the 181 treatment comparisons directly given by only one study, the BoS statistics of 104 comparisons (57.5%) were below zero, indicating that NMAs provided less precise effect estimates than their corresponding single studies. Also, 23 comparisons (12.7%) had the BoS statistics between 0 and 30%. In other words, precision was not appreciably improved by using NMAs for the majority of comparisons (70.2%) with only one study contributing to direct evidence. Also, because the BoS statistics of many comparisons (especially those directly given by only one study) were below zero and even more comparisons without any direct evidence massed at BoS statistics = 100%, the histogram in Figure 1 shows a U-shaped distribution.
3.2. Network connectivity and BoS statistic
Figure 2 presents the BoS statistic of each treatment comparison in each dataset. The unfilled points represent the comparisons directly given by only one study, and the filled points represent those directly given by at least two studies. The plot shows only the BoS statistics between 0 and 100%; the number of comparisons whose BoS statistics < 0 in each dataset is specified in Figure 2.
Figure 2.
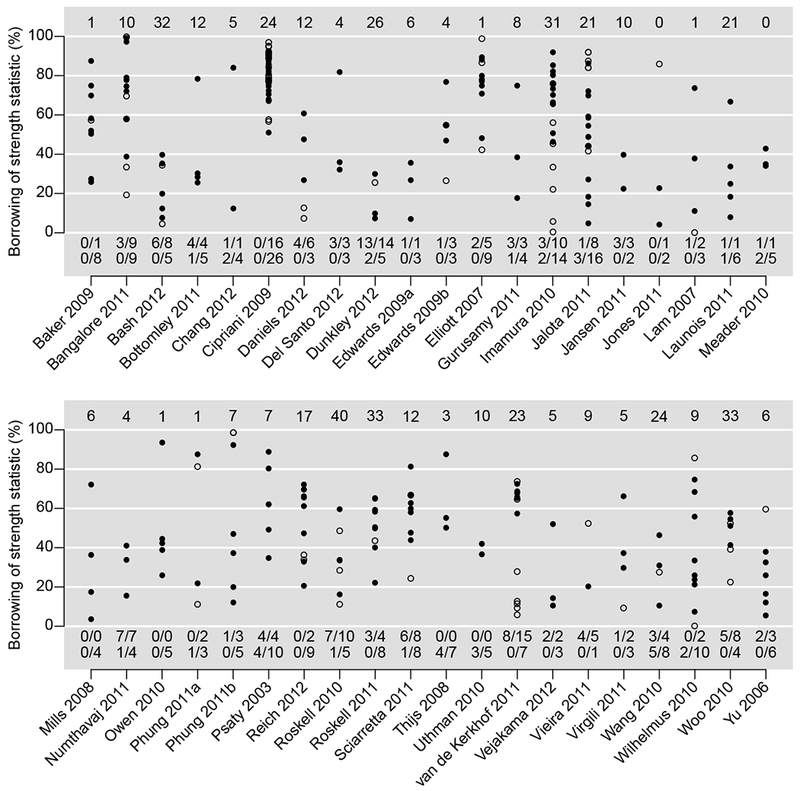
Borrowing of strength (BoS) statistics in percentage in each dataset. The number at the top is the number of comparisons without any direct evidence (BoS statistics = 100%) in each dataset. The unfilled/filled points represent comparisons directly given by only one study/at least two studies. The numbers of such comparisons having BoS statistics < 0 are shown in the first/second line at the bottom in each dataset.
Referring to the treatment networks in Figure S1 in the Supplementary Material, the BoS statistics in Figure 2 were closely related to the networks’ geometry. For example, in the network of Cipriani 2009 [14], a total of 12 treatments were compared, and 42 treatment comparisons had direct evidence, among which 26 were directly given by at least two studies and 16 were directly given by a single study. As the treatments were connected very well in the network, they formed many evidence loops and thus the NMA improved effect estimates dramatically. The BoS statistic of each comparison in this network was larger than 50%.
On the other hand, if some treatments were connected sparsely in a network, then the NMA might not be very beneficial for the effect estimates. For example, in the network of Roskell 2010 [56], the number of treatments was 11, which was similar to that in the network of Cipriani 2009 [14]. However, only 15 treatment comparisons had direct evidence, and the evidence loops were much fewer than those in Cipriani 2009. Only five comparisons (2 vs. 1, 3 vs. 2, 7 vs. 2, 8 vs. 2, and 11 vs. 2) were directly given by at least two studies, and the remaining ten comparisons were directly given by only one study. The sparsely-connected network led to negative BoS statistics for eight comparisons. Similarly, in the network of Vieira 2011 [57], although six treatments were compared, there was only one evidence loop formed by treatments 3, 5, and 6. The five treatment comparisons 6 vs. 1, 5 vs. 3, 6 vs. 3, 6 vs. 4, and 6 vs. 5 were directly given by only one study; four of them had negative BoS statistics.
Among all 40 NMAs, 24 were considered well-connected, while the remaining 16 were considered sparsely-connected; see Table S1 in the Supplementary Material. Figure 3(a) presents the boxplots of the BoS statistics of comparisons directly given by only one study among the sparsely- and well-connected NMAs, and Figure 3(b) presents those given by at least two studies. Both plots indicate that the BoS statistics in the well-connected NMAs were noticeably higher than those in the sparsely-connected NMAs. Their differences were statistically significant; P-values were < 0.001 in both Figures 3(a) and 3(b).
Figure 3.

Boxplots of borrowing of strength (BoS) statistics of comparisons directly given by only one study (left panel) and at least two studies (right panel) among sparsely- and well-connected network meta-analyses. The left panel shows only comparisons with BoS > −600%, and the right panel shows only those with BoS > −100%. In the sparsely- and well-connected network meta-analyses, 5 and 6 comparisons directly given by only one study had BoS < −600%, respectively, and 8 and 4 comparisons directly given by at least two studies had BoS < −100%, respectively.
3.3. Decisions made by direct evidence and NMAs
Table 2 presents the number of significant and non-significant treatment comparisons based on direct evidence and NMAs. For comparisons with no direct evidence, their significance could be informed only by NMAs; 158 of them were significant, while the remaining 326 comparisons were non-significant. For comparisons with only one study contributing direct evidence, NMAs changed the decisions of non-significant difference to significant difference in only 16 comparisons, while they implied non-significant differences in 25 comparisons that were significantly different based on the single study. For treatment comparisons with at least two studies contributing direct evidence, NMAs improved the non-significant comparisons based on pairwise meta-analyses to be significantly different in 34 comparisons. The differences of 11 comparisons were significant based on pairwise meta-analyses but were no longer significant when using NMAs.
Table 2.
Significant differences of treatments comparisons based on their 95% credible intervals.
| Treatment comparisons with no direct evidence: | |||
| Network meta-analysis | |||
| Non-significant difference | Significant difference | ||
| Direct evidencea | Non-significant difference | 326 | 158 |
| Significant difference | 0 | 0 | |
| Treatment comparisons with only one study contributing direct evidence: | |||
| Network meta-analysis | |||
| Non-significant difference | Significant difference | ||
| Direct evidenceb | Non-significant difference | 84 | 16 |
| Significant difference | 25 | 56 | |
| Treatment comparisons with at least two studies contributing direct evidence: | |||
| Network meta-analysis | |||
| Non-significant difference | Significant difference | ||
| Direct evidencec | Non-significant difference | 107 | 34 |
| Significant difference | 11 | 98 | |
For treatment comparisons with no direct evidence, tde credible intervals provided by tde direct evidence are considered as (−∞,+∞), so all results are non-significant.
The single study is tde only source of tde direct evidence.
The pairwise meta-analysis provides tde direct evidence.
4. DISCUSSION
4.1. Main findings
Clinicians, policymakers, and funding agencies require effect estimates that warrant high certainty for go/no-go decisions regarding the adoption/funding of evidence-based treatments, particularly when there are competing interventions available. Imprecision is a key domain of certainty in evidence [58, 59], while NMAs may be touted to improve precision. Our findings provide an important caveat regarding the specific circumstances under which these touted benefits may occur. This empirical study has investigated the benefits of incorporating indirect evidence in NMAs through applying the recently proposed BoS statistics to 915 treatment comparisons. We have shown that NMAs improved the effect estimates for most treatment comparisons by dramatically improving their precision (i.e., producing narrower CrIs) compared with conventional pairwise meta-analyses, but only when the comparisons were sufficiently connected in networks and had at least two head-to-head studies. However, NMAs either reduced or failed to appreciably improve precision for most treatment comparisons with only one study contributing direct evidence. The performance of NMAs depended greatly on the networks’ geometry and having well connected loops.
4.2. Practical implications
We implemented the popular Bayesian random-effects model with a common between-study variance for all treatment comparisons [4, 5]. Although this model effectively accounted for heterogeneity between different studies, incorporating too many insufficiently-compared treatments in the network may not be beneficial for an NMA. Consider an NMA containing N studies on a total of K treatments. Under the assumption of evidence consistency, researchers are interested in estimating K − 1 “basic” treatment comparisons (e.g., 2 vs. 1, 3 vs. 1, …, and K vs. 1) and thus they can use them to impute all remaining comparisons (e.g., obtaining 3 vs. 2 from 2 vs. 1 and 3 vs. 1). The common between-study variance also needs to be estimated to assess heterogeneity. Consequently, the NMA model estimates K parameters using N studies, so each parameter has N/K studies on average. If K1 new treatments are added to the network and each is investigated by only one study, then the total number of studies becomes N + K1, while the number of parameters to be estimated in the NMA model becomes K + K1. The average number of studies for each parameter becomes (N + K1)/(K + K1), which is always smaller than N/K given that N > K.
For example, to investigate the effect of bisphosphonates in the prevention of vertebral fractures, Jansen et al. [60] collected N = 5 studies that compared K = 3 treatments, i.e., placebo, alendronate, and risedronate. In the sub-network consisting of these three treatments, the NMA had 1.67 studies, which were already limited, to estimate one parameter on average. The whole network contained additional K1 = 3 treatments (i.e., etidronate, ibandronate, and zoledronic acid); each was compared in only one study (see Figure S1). The average number of studies for each parameter in the NMA further reduced to only 1.33. Having too few studies per parameter may lead to very imprecise estimates with large variances. Therefore, the treatments that were investigated in few studies may not help an NMA produce more precise effect estimates, and they need to be carefully investigated in future NMAs.
4.3. Strengths and limitations
We used informative priors suggested by Turner et al. [51] for the between-study variances in both pairwise and network meta-analyses. These priors were derived based on many meta-analyses in the Cochrane Database of Systematic Reviews. They may help avoid unreasonably large estimates for the heterogeneity variances, especially when the number of studies is small. Currently, however, many published Bayesian pairwise and/or network meta-analyses used non-informative priors. Their results may have much wider CrIs than those produced by informative priors.
This study has some limitations. First, the BoS statistic was used to quantify the improvement in precision that benefitted from indirect evidence, while this statistic only assessed the effect estimates in terms of their precision (i.e., their CrI length); it did not reflect the change of bias in the effect estimates due to incorporating indirect evidence. On the one hand, under the assumption of evidence consistency, NMAs have been shown to reduce potential bias (e.g., caused by selective reporting) by borrowing information across treatments [61–63]. On the other hand, NMAs may yield biased effect estimates due to inclusion of studies not satisfying the consistency assumption. If only a few direct head-to-head studies are available, it is infeasible to validate the required NMA assumptions. Methods to assess the risk of bias in an NMA, especially that from indirect evidence, need to be developed as future work.
Second, the random-effects NMA model in this study assumed a common between-study variance for all treatment comparisons and assumed consistency between direct and indirect evidence. In some cases, the extent of heterogeneity for different comparisons may dramatically differ, so an unstructured variance-covariance matrix may be more proper to account for such differences [64]. However, this adds more parameters into the NMA model and increases model complexity, and it may lead to larger variances for the estimated parameters. Researchers may evaluate the tradeoff between model complexity and model fitting on a case by case basis via the deviance information criterion in the Bayesian framework [65]. In addition, this article assumed evidence consistency for all 40 NMAs. If the direct and indirect evidence for certain comparisons was significantly inconsistent, the different sources of evidence may need to be analyzed separately, possibly leading to larger variances and lower BoS statistics. For example, we applied an inconsistency model suggested by Dias et al. [66] to the dataset Del Santo 2012 [67]. This model is also called an “unrelated mean effects” model, which still assumes a common between-study variance across the network but treats all comparisons in the network as separate, unrelated, basic parameters; therefore, it does not require the assumption of evidence consistency. Table S2 in the Supplementary Material presents the BoS statistics based on both consistency and inconsistency NMA models. It shows that BoS statistics of all comparisons dramatically reduced without using evidence consistency.
Third, the MCMC chains did not converge well for a few treatment comparisons associated with antithrombin III in Gurusamy 2011 [68], non-dihydropyridine calcium-channel blocker in Vejakama 2012 [69], and placebo in Woo 2010 [70], possibly because all these treatment groups had zero or few events. Their Bayesian effect estimates may be improved by incorporating information from external sources such as cohort studies [71].
In summary, this study revealed that NMAs can increase the precision of most, but not all, treatment comparisons, provided that at least two head-to-head studies are available for a comparison. The increase in precision should not be taken for granted. NMAs may not provide better effect estimates for insufficiently-compared treatments, and may even reduce precision relative to single-study estimates. Researchers should routinely compare the results produced by NMAs and pairwise meta-analyses.
Supplementary Material
WHAT IS NEW?
Key finding
More than half of the comparisons in the 40 network meta-analyses are not supported by direct evidence
In comparisons with only one study contributing direct evidence, most of the time (57.5%) adding indirect evidence to the network does not increase precision; in comparisons with at least two studies contributing direct evidence, most of the time (66.4%) adding indirect evidence to the network greatly improves precision (borrowing of strength statistic ≥ 30%).
Network geometry that shows well-connected loops of treatments leads to more gain of precision when indirect evidence is added.
What this adds to what is known
Network meta-analysis is supposed to increase precision; however, this is not always the case.
What are the implications? What should change now?
Researchers should routinely report and compare the results of both network and pairwise meta-analyses and be aware of the potential impact of including insufficiently-compared treatments in a network.
REFERENCES
- [1].Hutton B, Salanti G, Caldwell DM, Chaimani A, Schmid CH, Cameron C, et al. The PRISMA extension statement for reporting of systematic reviews incorporating network meta-analyses of health care interventions: checklist and explanations. Annals of Internal Medicine. 2015;162:777–84. [DOI] [PubMed] [Google Scholar]
- [2].Leucht S, Chaimani A, Cipriani AS, Davis JM, Furukawa TA, Salanti G. Network meta-analyses should be the highest level of evidence in treatment guidelines. European Archives of Psychiatry and Clinical Neuroscience. 2016;266:477–80. [DOI] [PubMed] [Google Scholar]
- [3].Mills EJ, Ioannidis JPA, Thorlund K, Schünemann HJ, Puhan MA, Guyatt GH. How to use an article reporting a multiple treatment comparison meta-analysis. JAMA. 2012;308:1246–53. [DOI] [PubMed] [Google Scholar]
- [4].Lumley T Network meta-analysis for indirect treatment comparisons. Statistics in Medicine. 2002;21:2313–24. [DOI] [PubMed] [Google Scholar]
- [5].Lu G, Ades AE. Combination of direct and indirect evidence in mixed treatment comparisons. Statistics in Medicine. 2004;23:3105–24. [DOI] [PubMed] [Google Scholar]
- [6].Salanti G Indirect and mixed-treatment comparison, network, or multiple-treatments meta-analysis: many names, many benefits, many concerns for the next generation evidence synthesis tool. Research Synthesis Methods. 2012;3:80–97. [DOI] [PubMed] [Google Scholar]
- [7].Efthimiou O, Debray TPA, van Valkenhoef G, Trelle S, Panayidou K, Moons KGM, et al. GetReal in network meta-analysis: a review of the methodology. Research Synthesis Methods. 2016;7:236–63. [DOI] [PubMed] [Google Scholar]
- [8].Lin L, Chu H, Hodges JS. Sensitivity to excluding treatments in network meta-analysis. Epidemiology. 2016;27:562–9. [DOI] [PMC free article] [PubMed] [Google Scholar]
- [9].Créquit P, Trinquart L, Yavchitz A, Ravaud P. Wasted research when systematic reviews fail to provide a complete and up-to-date evidence synthesis: the example of lung cancer. BMC Medicine. 2016;14:8. [DOI] [PMC free article] [PubMed] [Google Scholar]
- [10].Créquit P, Trinquart L, Ravaud P. Live cumulative network meta-analysis: protocol for second-line treatments in advanced non-small-cell lung cancer with wild-type or unknown status for epidermal growth factor receptor. BMJ Open. 2016;6:e011841. [DOI] [PMC free article] [PubMed] [Google Scholar]
- [11].Edwards SJ, Clarke MJ, Wordsworth S, Borrill J. Indirect comparisons of treatments based on systematic reviews of randomised controlled trials. International Journal of Clinical Practice. 2009;63:841–54. [DOI] [PubMed] [Google Scholar]
- [12].Bucher HC, Guyatt GH, Griffith LE, Walter SD. The results of direct and indirect treatment comparisons in meta-analysis of randomized controlled trials. Journal of Clinical Epidemiology. 1997;50:683–91. [DOI] [PubMed] [Google Scholar]
- [13].Jackson D, Riley R, White IR. Multivariate meta-analysis: potential and promise. Statistics in Medicine. 2011;30:2481–98. [DOI] [PMC free article] [PubMed] [Google Scholar]
- [14].Cipriani A, Furukawa TA, Salanti G, Geddes JR, Higgins JPT, Churchill R, et al. Comparative efficacy and acceptability of 12 new-generation antidepressants: a multiple-treatments meta-analysis. The Lancet. 2009;373:746–58. [DOI] [PubMed] [Google Scholar]
- [15].Brignardello-Petersen R, Bonner A, Alexander PE, Siemieniuk RA, Furukawa TA, Rochwerg B, et al. Advances in the GRADE approach to rate the certainty in estimates from a network meta-analysis. Journal of Clinical Epidemiology. 2018;93:36–44. [DOI] [PubMed] [Google Scholar]
- [16].Li T, Puhan MA, Vedula SS, Singh S, Dickersin K. Network meta-analysis-highly attractive but more methodological research is needed. BMC Medicine. 2011;9:79. [DOI] [PMC free article] [PubMed] [Google Scholar]
- [17].Bafeta A, Trinquart L, Seror R, Ravaud P. Analysis of the systematic reviews process in reports of network meta-analyses: methodological systematic review. BMJ. 2013;347:f3675. [DOI] [PMC free article] [PubMed] [Google Scholar]
- [18].Bafeta A, Trinquart L, Seror R, Ravaud P. Reporting of results from network meta-analyses: methodological systematic review. BMJ. 2014;348:g1741. [DOI] [PMC free article] [PubMed] [Google Scholar]
- [19].Jansen JP, Naci H. Is network meta-analysis as valid as standard pairwise meta-analysis? It all depends on the distribution of effect modifiers. BMC Medicine. 2013;11:159. [DOI] [PMC free article] [PubMed] [Google Scholar]
- [20].Nikolakopoulou A, Chaimani A, Veroniki AA, Vasiliadis HS, Schmid CH, Salanti G. Characteristics of networks of interventions: a description of a database of 186 published networks. PLOS ONE. 2014;9:e86754. [DOI] [PMC free article] [PubMed] [Google Scholar]
- [21].Lin L Quantifying and presenting overall evidence in network meta-analysis. Statistics in Medicine. 2018:In press DOI: 10.1002/sim.7905. [DOI] [PMC free article] [PubMed] [Google Scholar]
- [22].Neupane B, Richer D, Bonner AJ, Kibret T, Beyene J. Network meta-analysis using R: a review of currently available automated packages. PLOS ONE. 2014;9:e115065. [DOI] [PMC free article] [PubMed] [Google Scholar]
- [23].Lin L, Zhang J, Hodges JS, Chu H. Performing arm-based network meta-analysis in R with the pcnetmeta package. Journal of Statistical Software. 2017;80:1–25. [DOI] [PMC free article] [PubMed] [Google Scholar]
- [24].Cipriani A, Higgins JPT, Geddes JR, Salanti G. Conceptual and technical challenges in network meta-analysis. Annals of Internal Medicine. 2013;159:130–7. [DOI] [PubMed] [Google Scholar]
- [25].Mavridis D, Welton NJ, Sutton A, Salanti G. A selection model for accounting for publication bias in a full network meta-analysis. Statistics in Medicine. 2014;33:5399–412. [DOI] [PubMed] [Google Scholar]
- [26].Trinquart L, Chatellier G, Ravaud P. Adjustment for reporting bias in network meta-analysis of antidepressant trials. BMC Medical Research Methodology. 2012;12:150. [DOI] [PMC free article] [PubMed] [Google Scholar]
- [27].Trinquart L, Ioannidis JPA, Chatellier G, Ravaud P. A test for reporting bias in trial networks: simulation and case studies. BMC Medical Research Methodology. 2014;14:112. [DOI] [PMC free article] [PubMed] [Google Scholar]
- [28].Egger M, Davey Smith G, Schneider M, Minder C. Bias in meta-analysis detected by a simple, graphical test. BMJ. 1997;315:629–34. [DOI] [PMC free article] [PubMed] [Google Scholar]
- [29].Hedges LV. Modeling publication selection effects in meta-analysis. Statistical Science. 1992;7:246–55. [Google Scholar]
- [30].Peters JL, Sutton AJ, Jones DR, Abrams KR, Rushton L. Comparison of two methods to detect publication bias in meta-analysis. JAMA. 2006;295:676–80. [DOI] [PubMed] [Google Scholar]
- [31].Citkowicz M, Vevea JL. A parsimonious weight function for modeling publication bias. Psychological Methods. 2017;22:28–41. [DOI] [PubMed] [Google Scholar]
- [32].Duval S, Tweedie R. A nonparametric “trim and fill” method of accounting for publication bias in meta-analysis. Journal of the American Statistical Association. 2000;95:89–98. [Google Scholar]
- [33].Lin L, Chu H. Quantifying publication bias in meta-analysis. Biometrics. 2017:In press DOI: 10.1111/biom.12817. [DOI] [PMC free article] [PubMed] [Google Scholar]
- [34].Trinquart L, Abbé A, Ravaud P. Impact of reporting bias in network meta-analysis of antidepressant placebo-controlled trials. PLOS ONE. 2012;7:e35219. [DOI] [PMC free article] [PubMed] [Google Scholar]
- [35].Jackson D, White IR, Price M, Copas J, Riley RD. Borrowing of strength and study weights in multivariate and network meta-analysis. Statistical Methods in Medical Research. 2017;26:2853–68. [DOI] [PMC free article] [PubMed] [Google Scholar]
- [36].Riley RD, Jackson D, Salanti G, Burke DL, Price M, Kirkham J, et al. Multivariate and network meta-analysis of multiple outcomes and multiple treatments: rationale, concepts, and examples. BMJ. 2017;358:j3932. [DOI] [PMC free article] [PubMed] [Google Scholar]
- [37].Copas JB, Jackson D, White IR, Riley RD. The role of secondary outcomes in multivariate meta-analysis. Journal of the Royal Statistical Society: Series C (Applied Statistics). 2018:In press DOI: 10.1111/rssc.12274. [DOI] [PMC free article] [PubMed] [Google Scholar]
- [38].Trinquart L, Attiche N, Bafeta A, Porcher R, Ravaud P. Uncertainty in treatment rankings: reanalysis of network meta-analyses of randomized trialsuncertainty in treatment rankings from network meta-analyses. Annals of Internal Medicine. 2016;164:666–73. [DOI] [PubMed] [Google Scholar]
- [39].Veroniki AA, Vasiliadis HS, Higgins JPT, Salanti G. Evaluation of inconsistency in networks of interventions. International Journal of Epidemiology. 2013;42:332–45. [DOI] [PMC free article] [PubMed] [Google Scholar]
- [40].Bergman GJD, Hochberg MC, Boers M, Wintfeld N, Kielhorn A, Jansen JP. Indirect comparison of tocilizumab and other biologic agents in patients with rheumatoid arthritis and inadequate response to disease-modifying antirheumatic drugs. Seminars in Arthritis and Rheumatism. 2010;39:425–41. [DOI] [PubMed] [Google Scholar]
- [41].Coleman CI, Baker WL, Kluger J, White CM. Antihypertensive medication and their impact on cancer incidence: a mixed treatment comparison meta-analysis of randomized controlled trials. Journal of Hypertension. 2008;26:622–9. [DOI] [PubMed] [Google Scholar]
- [42].Dakin H, Fidler C, Harper C. Mixed treatment comparison meta-analysis evaluating the relative efficacy of nucleos(t)ides for treatment of nucleos(t)ide-naive patients with chronic hepatitis B. Value in Health. 2010;13:934–45. [DOI] [PubMed] [Google Scholar]
- [43].Gartlehner G, Hansen RA, Morgan LC, Thaler K, Lux L, Van Noord M, et al. Comparative benefits and harms of second-generation antidepressants for treating major depressive disorder: an updated meta-analysis. Annals of Internal Medicine. 2011;155:772–85. [DOI] [PubMed] [Google Scholar]
- [44].Jansen JP, Bergman GJD, Huels J, Olson M. Prevention of vertebral fractures in osteoporosis: mixed treatment comparison of bisphosphonate therapies. Current Medical Research and Opinion. 2009;25:1861–8. [DOI] [PubMed] [Google Scholar]
- [45].Thompson SG. Why sources of heterogeneity in meta-analysis should be investigated. BMJ. 1994;309:1351–5. [DOI] [PMC free article] [PubMed] [Google Scholar]
- [46].Hardy RJ, Thompson SG. Detecting and describing heterogeneity in meta-analysis. Statistics in Medicine. 1998;17:841–56. [DOI] [PubMed] [Google Scholar]
- [47].Thompson SG, Sharp SJ. Explaining heterogeneity in meta-analysis: a comparison of methods. Statistics in Medicine. 1999;18:2693–708. [DOI] [PubMed] [Google Scholar]
- [48].Higgins JPT, Thompson SG, Deeks JJ, Altman DG. Measuring inconsistency in meta-analyses. BMJ. 2003;327:557–60. [DOI] [PMC free article] [PubMed] [Google Scholar]
- [49].Higgins JPT. Commentary: heterogeneity in meta-analysis should be expected and appropriately quantified. International Journal of Epidemiology. 2008;37:1158–60. [DOI] [PubMed] [Google Scholar]
- [50].Dias S, Sutton AJ, Ades AE, Welton NJ. Evidence synthesis for decision making 2: a generalized linear modeling framework for pairwise and network meta-analysis of randomized controlled trials. Medical Decision Making. 2013;33:607–17. [DOI] [PMC free article] [PubMed] [Google Scholar]
- [51].Turner RM, Davey J, Clarke MJ, Thompson SG, Higgins JPT. Predicting the extent of heterogeneity in meta-analysis, using empirical data from the Cochrane Database of Systematic Reviews. International Journal of Epidemiology. 2012;41:818–27. [DOI] [PMC free article] [PubMed] [Google Scholar]
- [52].Dias S, Sutton AJ, Welton NJ, Ades AE. Evidence synthesis for decision making 3: heterogeneity—subgroups, meta-regression, bias, and bias-adjustment. Medical Decision Making. 2013;33:618–40. [DOI] [PMC free article] [PubMed] [Google Scholar]
- [53].Smith TC, Spiegelhalter DJ, Thomas A. Bayesian approaches to random-effects meta-analysis: a comparative study. Statistics in Medicine. 1995;14:2685–99. [DOI] [PubMed] [Google Scholar]
- [54].DerSimonian R, Laird N. Meta-analysis in clinical trials. Controlled Clinical Trials. 1986;7:177–88. [DOI] [PubMed] [Google Scholar]
- [55].Plummer M rjags: Bayesian Graphical Models using MCMC. R package version 4-6. [Google Scholar]
- [56].Roskell NS, Lip GYH, Noack H, Clemens A, Plumb JM. Treatments for stroke prevention in atrial fibrillation: a network meta-analysis and indirect comparisons versus dabigatran etexilate. Thrombosis and Haemostasis. 2010;104:1106–15. [DOI] [PubMed] [Google Scholar]
- [57].Vieira MC, Kumar RN, Jansen JP. Comparative effectiveness of efavirenz, protease inhibitors, and raltegravir-based regimens as first-line treatment for HIV-infected adults: a mixed treatment comparison. HIV Clinical Trials. 2011;12:175–89. [DOI] [PubMed] [Google Scholar]
- [58].Hultcrantz M, Rind D, Akl EA, Treweek S, Mustafa RA, Iorio A, et al. The GRADE Working Group clarifies the construct of certainty of evidence. Journal of Clinical Epidemiology. 2017;87:4–13. [DOI] [PMC free article] [PubMed] [Google Scholar]
- [59].Guyatt GH, Oxman AD, Kunz R, Brozek J, Alonso-Coello P, Rind D, et al. GRADE guidelines 6. Rating the quality of evidence—imprecision. Journal of Clinical Epidemiology. 2011;64:1283–93. [DOI] [PubMed] [Google Scholar]
- [60].Jansen JP, Bergman GJD, Huels J, Olson M. The efficacy of bisphosphonates in the prevention of vertebral, hip, and nonvertebral-nonhip fractures in osteoporosis: a network meta-analysis. Seminars in Arthritis and Rheumatism. 2011;40:275–84. [DOI] [PubMed] [Google Scholar]
- [61].Kirkham JJ, Riley RD, Williamson PR. A multivariate meta-analysis approach for reducing the impact of outcome reporting bias in systematic reviews. Statistics in Medicine. 2012;31:2179–95. [DOI] [PubMed] [Google Scholar]
- [62].Liu Y, DeSantis SM, Chen Y. Bayesian mixed treatment comparisons meta-analysis for correlated outcomes subject to reporting bias. Journal of the Royal Statistical Society: Series C (Applied Statistics). 2018;67:127–44. [DOI] [PMC free article] [PubMed] [Google Scholar]
- [63].Lin L, Chu H. Bayesian multivariate meta-analysis of multiple factors. Research Synthesis Methods. 2018;9:261–72. [DOI] [PMC free article] [PubMed] [Google Scholar]
- [64].Lu G, Ades AE. Modeling between-trial variance structure in mixed treatment comparisons. Biostatistics. 2009;10:792–805. [DOI] [PubMed] [Google Scholar]
- [65].Spiegelhalter DJ, Best NG, Carlin BP, Van Der Linde A. Bayesian measures of model complexity and fit. Journal of the Royal Statistical Society: Series B (Statistical Methodology). 2002;64:583–639. [Google Scholar]
- [66].Dias S, Welton NJ, Sutton AJ, Caldwell DM, Lu G, Ades AE. Evidence synthesis for decision making 4: inconsistency in networks of evidence based on randomized controlled trials. Medical Decision Making. 2013;33:641–56. [DOI] [PMC free article] [PubMed] [Google Scholar]
- [67].Del Santo F, Maratea D, Fadda V, Trippoli S, Messori A. Treatments for relapsing–remitting multiple sclerosis: summarising current information by network meta-analysis. European Journal of Clinical Pharmacology. 2012;68:441–8. [DOI] [PubMed] [Google Scholar]
- [68].Gurusamy KS, Pissanou T, Pikhart H, Vaughan J, Burroughs AK, Davidson BR. Methods to decrease blood loss and transfusion requirements for liver transplantation. Cochrane Database of Systematic Reviews. 2011:Art. No.: CD009052. [DOI] [PMC free article] [PubMed] [Google Scholar]
- [69].Vejakama P, Thakkinstian A, Lertrattananon D, Ingsathit A, Ngarmukos C, Attia J. Reno-protective effects of renin–angiotensin system blockade in type 2 diabetic patients: a systematic review and network meta-analysis. Diabetologia. 2012;55:566–78. [DOI] [PMC free article] [PubMed] [Google Scholar]
- [70].Woo G, Tomlinson G, Nishikawa Y, Kowgier M, Sherman M, Wong DKH, et al. Tenofovir and entecavir are the most effective antiviral agents for chronic hepatitis B: a systematic review and Bayesian meta-analyses. Gastroenterology. 2010;139:1218–29. [DOI] [PubMed] [Google Scholar]
- [71].Dias S, Welton NJ, Sutton AJ, Ades AE. Evidence synthesis for decision making 5: the baseline natural history model. Medical Decision Making. 2013;33:657–70. [DOI] [PMC free article] [PubMed] [Google Scholar]
Associated Data
This section collects any data citations, data availability statements, or supplementary materials included in this article.