

Summary
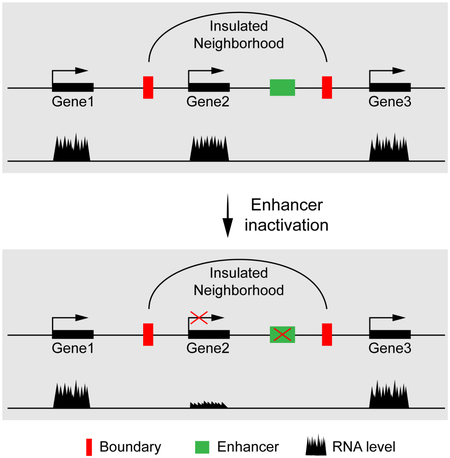
Metazoan chromosomes are sequentially partitioned into Topologically Associating Domains (TADs) and then into smaller sub-domains. One class of sub-domains, insulated neighborhoods are proposed to spatially sequester and insulate the enclosed genes through self-association and chromatin looping. However, it has not been determined functionally whether promoter-enhancer interactions and gene regulation are broadly restricted to within these loops. Here we employed published datasets from murine embryonic stem cells (mESC) to identify insulated neighborhoods that confine promoter-enhancer interactions and demarcate gene regulatory regions. To directly address the functionality of these regions, we depleted Estrogen-related receptor β (Esrrb), which binds the Mediator co-activator complex, to impair enhancers of genes within 222 insulated neighborhoods without causing mESC differentiation. Esrrb depletion reduces Mediator binding, promoter-enhancer looping, and expression of both nascent RNA and mRNA within the insulated neighborhoods without significantly affecting the flanking genes. Our data indicate that insulated neighborhoods represent functional regulons in mammalian genomes.
Keywords: Enhancer, Promoter, Chromatin Looping, Insulated Neighborhood, Transcription, Esrrb
Graphical Abstract
Introduction
Classic studies on the Drosophila segmentation genes and the mammalian β-globin locus have shown that distal enhancers stimulate metazoan transcription by interacting with promoters via looping of the intervening chromatin (de Laat and Duboule, 2013; Levine et al., 2014). How enhancer-promoter interactions fit within higher-order organization of the genome is important for understanding how enhancer dysfunction contributes to disease phenotypes. For example, although a large percentage of intergenic disease-associated SNPs localize to enhancers, the effect of these on gene expression is not readily predictable (Elkon and Agami, 2017; Lupianez et al., 2015; Mumbach et al., 2017).
Hi-C analysis has revealed that the mammalian genome folds into ~2,200 discrete, self-interacting topologically-associating domains (TADs). These megabase-sized domains, depicted as large triangles in Hi-C graphs, contain on average 10 genes (Dixon et al., 2016; Dixon et al., 2012). TADs are believed to be spatially sequestered or insulated from each other by forming into separate loops, which are anchored at the boundaries. TAD boundaries are demarcated by binding of CTCF and other features like transcriptionally active genes (Dixon et al., 2012). TADs subdivide further into multiple, nested sub-domains. Different terms have been used to refer to the sub-megabase size and self-interacting properties of the sub-domains including “sub-TADs” (Hansen et al., 2017; Kim et al., 2018; Phillips-Cremins et al., 2013) and “contact domains” (Rao et al., 2014; Rao et al., 2017). Contact domains are further categorized into “loop domains” bounded by CTCF/Cohesin and “compartment domains” where similar histone modifications co-segregate. ChIA-PET studies have shown that some of these sub-domains, termed “insulated neighborhoods”, are chromatin loops anchored by Cohesin and CTCF (Dowen et al., 2014). Smc1 ChIA-PET datasets largely recapitulate previously identified TAD and sub-domain boundaries when analyzed using Hi-C informatics pipelines (Dowen et al., 2014; Hnisz et al., 2016; Ji et al., 2016).
Insulated neighborhoods are proposed to constrain gene regulation within the boundaries (Ji et al., 2016). Deletion of CTCF sites at the boundary of select insulated neighborhoods results in ectopic transcription stimulation of one or more flanking genes via formation of an enhancer-promoter loop across the region encompassing the deleted boundary (Dowen et al., 2014). Thus, by the classic models, insulated neighborhoods insulate and ensure the specificity or fidelity of an enhancer for its physiological target gene (Levine et al., 2014). However, it is unclear whether enhancers broadly function on genes located within insulated neighborhoods because of the lack of systematic loss-of-function studies.
To address this issue, we focused on Estrogen-related receptor β (Esrrb), a pluripotent transcription factor that activates murine embryonic stem cell (mESC) genes (Chen et al., 2008; Whyte et al., 2013; Xie et al., 2017). Esrrb binding density at enhancers correlates with the binding of Mediator co-activator complex and nearby gene activation (Whyte et al., 2013). Mediator is necessary for efficient Pol II pre-initiation (PIC) complex assembly in vitro (Chen et al., 2012; Johnson et al., 2002) and is one of several factors thought to be required for enhancer-promoter looping in vivo (Kagey et al., 2010). Esrrb interacts with Mediator in affinity purification and proteomic analyses (van den Berg et al., 2010). Despite the apparent functional role of Esrrb in mESC transcription, Esrrb is not necessary for stem cell maintenance in cells supplemented with Leukemia Inhibitory Factor (LIF) due to compensatory pathways (Martello et al., 2012). We hypothesized from these published observations that Esrrb depletion could represent a strategy to remove the Mediator and partially or completely inhibit the function of Esrrb-responsive enhancers without causing differentiation. If successful, this strategy would allow us to determine whether gene regulation by Esrrb-responsive enhancers and promoters routinely occurs within the constraints of insulated neighborhoods.
We first used existing Smc1 ChIA-PET datasets to identify insulated neighborhoods that encompassed mESC promoters (Dowen et al., 2014). Among the 3,929 active promoters identified, 76% of promoter-capture Hi-C loops (Schoenfelder et al., 2015), including those to enhancers and other features, are constrained within or very near to the insulated neighborhood boundaries. Interestingly, most promoters formed loops to both enhancers within the loop as well as to the boundaries; these loops were confirmed by 4C analysis (van de Werken et al., 2012b). An enhancer-inactivation strategy based on Esrrb depletion showed that among the enhancers of genes located within 222 insulated neighborhoods, which displayed >2-fold decreased nascent RNA expression, 82% clearly act on promoters within the same insulated neighborhood. Moreover, depletion of Esrrb led to significantly decreased binding of Mediator at the enhancer accompanied by diminished promoter-enhancer looping within the insulated neighborhood as measured by 4C (van de Werken et al., 2012a). Finally, we determined that proximal promoters play a key role in enhancer-responsiveness. Active and inactive genes within the same insulated neighborhood are easily distinguished by the differential DNase I sensitivity of their proximal promoters. Additionally, upon enhancer inactivation, PICs at responsive promoters remain intact, despite downregulation of gene transcription. Thus, the proximal promoter provides an important layer of regulation for enhancer-based transcription.
Results
Promoters Loop to Enhancers and Boundary Elements within Insulated Neighborhoods
Insulated neighborhoods are typically formed by Cohesin-mediated interactions between two CTCF-bound sites (Dowen et al., 2014). We used published Smc1 ChIA-PET (Dowen et al., 2014) and CTCF ChIP-seq (Hansen et al., 2017) data to identify insulated neighborhoods encompassing genes and promoters within mESCs. Briefly, Cohesin-associated loops were first filtered by removing very small or unusually large ones, and those lacking CTCF-bound anchors. Next, the smallest Smc1 ChIA-PET loop encompassing a promoter was assigned to its gene (for details, see STAR Methods).
By following this strategy, we were able to identify insulated neighborhoods encompassing 9,407 protein-coding genes of which 3,929 were transcriptionally active (nascent RNA-seq RPKM ≥0.5) (Table S1). These active genes lie within 3,018 insulated neighborhoods. The median size of these insulated neighborhoods is ~110 kb. Each neighborhood is composed of 1-8 active genes and on average 2 putative enhancers identified previously (Whyte et al., 2013). We infer that some promoters are missing from our calculation because the Smc1 ChIA-PET data are reportedly not saturating (Dowen et al., 2014). Nevertheless, to characterize promoters and boundaries of these insulated neighborhoods, we computationally normalized the distance between a promoter and both boundaries. The 60-kb regions flanking both sides of these insulated neighborhood were included in the analysis (STAR Methods). Figure 1A shows a meta-plot of insulated neighborhoods encompassing 3,929 active promoters. The terms “promoter” and “boundary” above the graphs indicate the relative positions of each promoter and the Smc1 ChIA-PET loop anchors, respectively, after computational normalization. The genes were then ranked by nascent RNA-seq levels and significant ChIP-seq peaks of Smc1, CTCF, Pol II, the Mediator subunit Med26 (Huang et al., 2017), and the TFIID subunit TAF2 were superimposed onto the graphs. Finally, promoter capture Hi-C data (Schoenfelder et al., 2015) were also superimposed to generate a map of all identified promoter-interacting loci within the insulated neighborhood (Figure 1A). Another 5,478 poised or silent genes also fit into our graphs (Figure S1).
Figure 1. Meta-insulated-neighborhood analysis.

(A) Heatmaps showing Smc1, CTCF, TAF2 (TFIID), H3K27ac, Pol II, Med26 (Mediator), H3K27me3 binding and distribution of promoter capture Hi-C interactions (Capture Hi-C) in 3,929 insulated neighborhoods aligned by nascent RNA-seq RPKM of genes, which are classified into 4 expression quartiles. For ChIP-seq, values of -log10P at significantly enriched windows were used. For Capture Hi-C, values indicating the interaction frequencies (log2 ratio of observed over expected number of contacts) were used; these values were obtained directly from the original study cited in the text.
(B) Average meta-insulated-neighborhood profiles of Smc1, CTCF, TAF2, H3K27ac, Pol II, Med26, H3K27me3 and promoter capture Hi-C interaction (Capture Hi-C) distributions in insulated neighborhoods in different nascent RNA expression quartiles.
See also Figure S1.
Three important observations emerged from this analysis. First, Cohesin (Smc1) and CTCF enrich precisely at the anchors of boundaries. By contrast, TAF2, Med26, H3K27ac and Pol II enrich at active promoters (Figures 1A and S1). Few of these promoters are poised because they lack H3K27me3 as compared to poised genes in Figure S1. Second, unexpectedly, promoter capture Hi-C data reveal that many promoters loop to or near insulated neighborhood boundaries (Figure 1A). Note these boundaries are not enhancers because they are not highly enriched in H3K27ac (Figure 1A). Moreover, a previous study demonstrated insulated neighborhood boundaries are distinct from enhancers (Dowen et al., 2014). Thus, these promoter-boundary loops are not promoter-enhancer loops. In sum, 76% of the promoter-interacting loci are contained within the insulated neighborhoods or near their boundaries (maximally 20 kb flanking). Third, when nascent RNA expression levels are divided into quartiles, promoter enrichments of TAF2, Med26, H3K27ac and Pol II correlate with the expression quartile (Figure 1B). However, promoter-boundary looping and Smc1 and CTCF binding at boundaries remain relatively constant (Figures 1A and 1B). This finding indicates that although insulated neighborhood boundaries may contact promoters, such interactions do not correlate with transcription levels, a conclusion reinforced by the data in Figure S1.
4C Analysis Confirms Promoter Interactions with Enhancers and Insulated Neighborhood Loop Anchors
High-resolution 4C was employed using promoter viewpoints to determine whether individual genes fit into the framework described in Figure 1 (van de Werken et al., 2012a). Figures 2A and 2B compare the Mitf and Sik1 genes expressed at low (RPKM=2.2) and modest (RPKM=21) levels, respectively, as measured by mRNA-seq and nascent RNA-seq (RPKM 0.53 and 4.2 for Mitf and Sik1). The data show that the promoters are located within Smc1 ChIA-PET loops, the anchors of which align with strong Cohesin and CTCF ChIP-seq peaks (vertical red bars) lacking H3K27ac (Hansen et al., 2017; Kagey et al., 2010). These insulated neighborhoods encompass the TSS (arrow), promoters (vertical gray bars) and potential enhancers of Mitf and Sik1 (vertical green bar).
Figure 2. Promoters loop to both enhancers and insulated neighborhood boundaries.

(A) View of a genomic region around Mitf integrating Smc1 ChIA-PET, and Smc1, Smc3, Rad21, CTCF, Med1, and H3K27ac ChIP-seq with 4C data and promoter capture Hi-C data. The Y axis of each browser plot represents normalized read counts for ChIP-seq. 4C results were analyzed by 2 different pipelines, 4Cseqpipe and 4C-Ker, are shown. 4Cseqpipe shows result of a representative biological replicate and 4C-Ker shows average of 2 replicates. Gray bar and VP/Pro, viewpoint/promoter; green bar and Enh, enhancer; red bar and Bdr, boundary. In 4Cseqpipe, higher resolution interactions (smaller bin sizes) are shown at the top of the domainogram and lower resolution ones (larger bin sizes) slide to the bottom (color scale bar). A plot of the interaction trend is shown above the domainogram (median trend = black line). Y axis of the plot show the relative level compared to the maximal value of the main trend; ylim is set to best visualize the promoter-enhancer and promoter-boundary interactions. The 4C-Ker graph plots normalized counts in partitioned windows. Promoter-capture Hi-C data are illustrated below the 4C-Ker plots.
(B) View of genomic region around Sik1 as in (A).
The 4Cseqpipe domainograms reveal high-coverage interactions surrounding the promoters (Schoenfelder et al., 2015; van de Werken et al., 2012b). Moving away from the promoters, several distinct looping events are evident up and downstream. We cannot explain all of the interactions although some may indicate interactions between the promoter and the PAF complex bound to elongating Pol II (Chen et al., 2017). The regions encompassing peaks of H3K27ac and Mediator (Med1), characteristic of enhancers, clearly form loops with the Mitf and Sik1 promoters. Importantly, interactions of various intensities were observed between the promoter and insulated neighborhood loop anchors (vertical red bars). These interactions, along with those at the enhancers, were confirmed using an independent and methodologically distinct 4C analysis pipeline termed 4C-Ker (Raviram et al., 2016), which reveals loops to the regions containing the enhancer and boundaries. Most of our 4C loops are consistent with published promoter-capture Hi-C data (arc lines below 4C-Ker plot). However, note that 4C but not the promoter-capture Hi-C identified the loop between the Sik1 promoter and the right boundary, indicating 4C is more sensitive than the promoter-capture Hi-C data in some cases due to higher sequence coverage. Although weaker 4C loops form outside the ChIA-PET-defined boundaries, most terminate at or before the loop anchors of adjacent insulated neighborhoods, in some instances near other CTCF/Cohesin sites. Collectively, the data show that the Mitf and Sik1 promoters and enhancers are enclosed within distinct Smc1 ChIA-PET loops corresponding to insulated neighborhoods, wherein the promoter interacts within the regions bearing the enhancer and boundary loop anchors.
Esrrb Knockdown Depletes Mediator and Inactivates Select Enhancers
To determine whether enhancer function and gene regulation are constrained within insulated neighborhoods, we developed a simple strategy to remove the Mediator and cripple enhancers at select locations, while maintaining mESC identity. Our strategy leverages known properties of Esrrb (Divekar et al., 2016), which interacts with Mediator either indirectly or directly as measured by proteomics (van den Berg et al., 2010). Figure 3 confirms this interaction is direct using immobilized template assays demonstrating that recombinant Esrrb recruits Mediator from either mESC nuclear extracts or immunopurified preparations in vitro (Figures 3A-3C) (Chen et al., 2012).
Figure 3. Esrrb KD is a proxy for enhancer inactivation.

(A) Schematic representation of immobilized template assays. Magnetic beads attached to templates bearing the Esrrb-responsive promoter (5xEsrrb sites, 23 bp upstream of the adenovirus E4 core promoter) were incubated in the presence or absence of Esrrb with mESC nuclear extracts or purified Mediator, washed twice, and bound proteins were eluted in SDS and analyzed by PAGE and Western blotting.
(B) Immobilized template assays showing Esrrb recruits Mediator from mESC nuclear extract. Western blots of the immobilized template eluate are shown with representative Mediator subunits.
(C) Immobilized template assays showing Esrrb recruits immunopurified Mediator. Approach as in (B).
(D) Heatmaps indicating change in Mediator (Med1 and Med12) binding upon Esrrb KD. Left, heatmaps of Med1 and Esrrb binding separated into 2 clusters, in which Med1 alone (39,222 sites) and Med1-Esrrb (8,233 sites) are shown. The Med1-alone cluster contains 5,320 loci within 2kb of TSSs (promoters), while the Med1-Esrrb cluster includes only 418 promoters. Values of -log10P were used as in Figure 1. Right, heatmaps of change in Med1 and Med12 binding in Esrrb siRNA KD versus siRNA control. Red is upregulated and green is downregulated. Values of log2 ratio (siEsrrb over siCtrl) were used.
(E) Browser plots showing Mediator (Med1 and Med12) binding and nascent RNA effects upon Esrrb KD. Y axes show normalized read counts of each ChIP-seq factor and nascent RNA. Gray bars, Pro1, Pro2 and Pro3, promoters; green bar and Enh, enhancer. Numbers on the nascent RNA tracks indicate RPKM values of nascent RNA from the genes below.
(F) Summary of numbers of affected genes using gene expression cutoffs as specified.
(G-L) Boxplots showing enrichment of Esrrb (G), Med1 (H), Klf4 (I), Nanog (J), Oct4 (K) and Sox2 (L) at enhancers related to differentially regulated genes. Values of ChIP-seq density (reads per million mapped reads per base pair, rpm/bp) were used; these values were obtained directly from the original paper cited in the text. P values were calculated using Wilcoxon rank-sum tests.
See also Figure S2.
Consistent with the biochemical data, knockdown of Esrrb by siRNA (Esrrb KD) in cells (Figures S2A-S2C) causes diminished recruitment of Mediator (Med1 and Med12) to Esrrb binding sites genome-wide (Figure 3D). For example, upon Esrrb KD, Med1 and Med12 binding decreases at Esrrb sites within the enhancer (Enh) of the divergently transcribed Slc13a5 and Xaf1 genes. The decrease in Mediator binding correlates with reduced expression by nascent RNA-seq. However, there is little to no effect of Esrrb KD on Mediator peaks at surrounding locations, where Esrrb is not bound (Figure 3E). These data argue that Esrrb KD is an effective strategy for removing Mediator from select locations.
To home in on specific enhancers and promoters that are highly dependent upon Esrrb, we classified 14,618 active genes in mESCs into 5 groups, which are color-coded based on fold-change (FC) of the nascent RNA upon Esrrb KD (Figure 3F). Note that the expression levels of Pou5f1 (Oct4), Sox2 and Nanog were barely or only modestly affected by Esrrb KD (Fold-change is 1.05, 1.27 and 1.59, respectively), demonstrating why depletion of Esrrb does not affect mESC pluripotency. If the down-regulated transcription results from direct effects of Esrrb, we would expect greater Esrrb and Mediator binding at nearby enhancers (Whyte et al., 2013). Indeed, putative enhancers of the gene groups that are more down-regulated by Esrrb KD display significantly higher levels of Esrrb and Med1 binding in untreated cells (Figures 3G and 3H).
Among several other major mESC regulatory proteins, only Klf4 binds to putative enhancers of different groups with a trend similar to Esrrb and Med1 (Figures 3I-3L) (Whyte et al., 2013). However, genes affected by Klf4 knockdown 2-fold or greater poorly overlap with those downregulated by Esrrb KD (Figure S2D). Importantly, the amount of Esrrb-Med1 co-binding loci correlates with the effect of knockdown on gene expression (Figure S2E). There is little difference in the effect of Esrrb KD on Mediator binding at previously categorized typical enhancers versus super-enhancers (TE vs. SE in Figure S2F). Similarly, there is no significant bias of gene downregulation between TE- and SE-related genes upon Esrrb KD (Figure S2G). In sum, on select genes, Esrrb KD can be used to deplete the Mediator and inactivate enhancers, either partially or near fully, to downregulate transcription of their target genes.
Enhancer Action is Constrained Within Insulated Neighborhoods
The ability to inactivate Esrrb-bound enhancers genome-wide allowed us to test whether their function is constrained within insulated neighborhoods. 222 insulated neighborhoods were identified, where expression of the genes contained within was downregulated by 2-fold or greater upon Esrrb KD. Among these, we identified three different types of insulated neighborhoods as illustrated schematically in Figure S3A. These include insulated neighborhoods bearing individual genes (Type i; n=153) and multi-gene regulons (Type ii; n=30), which responded to Esrrb KD, and examples where the known boundaries cannot readily explain enhancer specificity. In this last class, (Type iii; n=39), one or more genes within the insulated neighborhood respond to Esrrb KD, while others remain active. The decreases in gene expression and Mediator binding within the insulated neighborhoods were then compared with the genes immediately flanking the boundaries to the left and right. Figure 4A shows that upon Esrrb knockdown, decreased gene expression within the insulated neighborhoods correlates with the number of Mediator peaks that decrease 2-fold or more in intensity. By contrast, gene expression and Mediator binding is significantly less affected among the flanking genes. We conclude from these data that gene regulation is largely constrained within insulated neighborhoods.
Figure 4. Insulated neighborhoods demarcate enhancer function.

(A) Statistical analysis showing insulated neighborhoods demarcate enhancer function. Upper panel, schematic representation of a typical gene (down-regulated by at least 2-fold upon Esrrb KD) within its insulated neighborhood (indicated as ‘mid’) and the flanking active genes on both sides (indicated as ‘left’ and ‘right’) of the insulated neighborhood boundaries. Middle panel, a box plot comparing transcription level changes of left, mid and right genes upon Esrrb KD. Y axis, log2 ratio of RPKM (siEsrrb/siCtrl) of nascent RNA. Lower panel, bar graph comparing number of Med1 decreased peaks (by at least 50%) in insulated neighborhoods (mid) upon Esrrb KD versus regions of the same size upstream of the left boundary and downstream of the right boundary.
(B) View of a genomic region around an insulated neighborhood bearing a single gene affected by Esrrb KD. Smc1 ChIA-PET data, CTCF, Rad21, H3K27ac, Esrrb ChIP-seq data in siCtrl as well as Med1 binding and nascent RNA effects upon Esrrb KD are shown. Y axes show normalized read counts. Green bar is Enh, enhancer; red bar is Bdr, boundary. Below is a bar graph showing relative mRNA levels.
(C) Browser plots and bar graph showing an insulated neighborhood bearing a regulon comprised of 4 active (red) and 3 inactive (gray) genes.
(D) Browser plots and bar graphs showing an insulated neighborhood bearing two differentially affected genes.
See also Figure S3.
Individual examples are illustrated in Figures 4B-4D. Gene names in red are active and responsive to Esrrb KD, black indicates active but unresponsive, and gray is considered inactive (nascent RNA-seq RPKM <0.5). The nascent RNA and mRNA responses to Esrrb KD are shown on the browser tracks and in the bar graphs below them, respectively. Figure 4B illustrates a Type i insulated neighborhood, where the Stard8 gene responds to Esrrb KD by displaying decreases in Mediator binding at the enhancer, nascent RNA transcription and mRNA expression. Figure S3B shows a similar example with the Icam1 gene. Figure 4C illustrates a Type ii example comprising four co-regulated genes (Kirrel2, Nphs1, Aplp1 and Nfkbid), whose expression levels are apparently controlled by two Esrrb-bound enhancers. Figure 4D illustrates another Type ii example, where two co-regulated genes, Slc13a5 and Xaf1, are located in the same insulated neighborhood. In all of these examples, and consistent with the statistical analysis of all 222 insulated neighborhoods, enhancer inactivation does not significantly decrease expression of flanking genes.
Figure S3C shows a Type iii example, Ly75, where nascent RNA transcription is highly downregulated upon enhancer-inactivation but the enhancer and promoter responsive to Esrrb KD are located within an Smc1 ChIA-PET loop defined by only a single CTCF- and Cohesin-bound anchor. This example may represent a situation where Smc1 ChIA-PET detected the type of promoter-boundary interaction described in Figures 1 and 2 but in this instance, the interaction insulates the March7 promoter from the Ly75 enhancer. A small number of examples exist, where we cannot explain enhancer specificity. For instance, the Type iii case of Manba (Figure S3D), which localizes within a broad insulated neighborhood bearing another highly-transcribed gene Ube2d3. Esrrb KD leads to a significant 5-fold downregulation of Manba whereas Ube2d3 is unaffected. No obvious ChIA-PET loops, promoter capture Hi-C loops or CTCF-Cohesin binding sites isolate the Ube2d3 gene or promoter and enhancer from those of Manba. Nonetheless, it is plausible that loops between the promoter and upstream boundary, not detected by ChIA-PET, could insulate Ube2d3 from the Manba enhancer.
Reduced Promoter-Enhancer Looping Accompanies Decreased Gene Expression Upon Enhancer-Inactivation
To determine whether the degree of promoter-enhancer looping and gene expression within an insulated neighborhood are directly related, we performed 4C on four genes, where the distance between the enhancer and promoter was sufficient to resolve distinct loops (Figures 5A-5D, S4A-S4C and Figure 2B). In all four examples, 4C analysis detected looping interactions between the promoter and a distal enhancer (Green bars, arrows indicate interactions). Esrrb KD led to Mediator (Med1) depletion from all four enhancers accompanied by reduced promoter-enhancer looping (red arrows). Looping between control regions (red boxes) and promoters remained relatively constant when comparing siCtrl versus siEsrrb, indicating specificity of Esrrb KD’s disruption of promoter looping to enhancers bound by Esrrb. The reduced looping correlated with decreased nascent RNA transcription (Figure 5) and mRNA levels (Figure S4D) from the responsive genes (Figures 5A-5D). In at least one of the four cases, Sik1, the enhancer-promoter loops diminished but the loops to the boundaries did not (Figure S4E), consistent with the lack of correlation between promoter-boundary loops and gene expression illustrated in Figures 1 and S1.
Figure 5. Depletion of Mediator causes loss of enhancer-promoter interactions.

(A-D) View of genomic regions around Cdyl2, Klf4, Tbx3 and Sik1 integrating H3K27ac, Esrrb, and Med1 ChIP-seq data, along with nascent RNA-seq and 4C data. Gray bar and VP/Pro, viewpoint/promoter; green bar and Enh, enhancer; red box, control region. P values were calculated using Student’s t test based on the normalized counts in all the windows covered by the bar. The green and red arrows in the domainograms point to the areas in the enhancer affected by Esrrb KD.
See also Figure S4.
Interestingly, on Tbx3, Enh1 located within the insulated neighborhood loops over G630008E18, a transcriptionally inactive gene typically expressed in the spinal cord, and interacts with the promoter (Figures 5C and S4C). The proximal promoter of a gene typically functions synergistically with its enhancer(s) (Maston et al., 2006). To understand why the Tbx3 enhancer fails to target G630008E18, we examined the DNase I sensitivity of its proximal promoter as a measure of transcription factor binding. The G630008E18 proximal promoter displays greatly diminished DNase I sensitivity compared with that of Tbx3 (Figure S4C). Indeed, the DNase I sensitivity of 31 inactive genes present within insulated neighborhoods responsive to Esrrb KD is significantly lower than the sensitivity of the 26 active genes (Figure S4F). In agreement with locus specific studies (Deng et al., 2012; Deng et al., 2014), these data suggest that transcription factor binding to the proximal promoter is a determinant of enhancer action, further explaining the specificity of gene regulation within insulated neighborhoods.
Esrrb and Mediator are Required for PIC Assembly at Responsive Promoters and Enhancers
Sequence-specific transcription factors bind to both the enhancer and the proximal promoter regions within insulated neighborhoods. PICs assemble to different extents at both locations to enable eRNA and mRNA synthesis (Core et al., 2014; Pugh and Venters, 2016). An important issue raised in Figure 5 is whether PIC assembly at the enhancer is coupled to or independent from PIC assembly at the promoter. Whereas Mediator binding to the enhancers in most Esrrb-responsive insulated neighborhoods decreases upon knockdown, promoter binding is only occasionally disrupted. We reasoned that Esrrb might regulate PIC assembly at the promoter within insulated neighborhoods in situations where it is bound there.
To address this question, we first established that Esrrb directly assembles PICs using the biochemical approach described in Figure 3A (Chen et al., 2012). PIC assembly was performed on an immobilized template bearing five Esrrb sites adjacent to a core promoter. We found that Esrrb stimulates assembly of a PIC comprising the GTFs and Pol II from a mock-treated mESC nuclear extract (Figure 6A, Lane 1 vs. 2). Conversely, Esrrb is unable to assemble a PIC (Figure 6A, Lanes 3 and 4) when Mediator was immunodepleted from the extract (Figure S5A). However, PIC assembly was rescued by addition of FLAG affinity-purified Mediator complex back into the depleted extract (Figure 6A, Lanes 5-7). This result, combined with those of Figure 3, demonstrates that Esrrb-regulated recruitment of Mediator plays a key role in assembling a PIC in vitro. Note that binding of TFIIB and Pol II is largely dependent upon both Esrrb and the Mediator in vitro (Figure 6A, Lanes 5-7) (Chen et al., 2012). In agreement with these results, Esrrb KD typically led to decreases in the amounts of co-bound Pol II and TFIIB in vivo (Figure 6B).
Figure 6. Depletion of Mediator causes loss of PIC assembly.

(A) Immobilized template assays showing Mediator has a direct function in recruiting PIC components. Mock- (Lanes 1-2) or Mediator-immunodepleted (Lanes 3-7) extracts were added in the presence (+) and absence (−) of recombinant Esrrb to Esrrb-responsive DNA templates linked to magnetic beads. After bead capture on a magnetic particle concentrator, and washing, the proteins were eluted and immunoblotted using antibodies to representative factors in the PIC. Flag-immunopurified Mediator was added back to reactions to rescue PIC assembly in Lanes 5-7.
(B) Heatmaps indicating change in Pol II and TFIIB binding upon Esrrb KD in mESCs. Left, heatmaps of Med1 and Esrrb binding separated into 2 clusters, in which Med1 and Esrrb overlap or Med1 is binned alone, respectively. Values of -log10P were used as in Figure 1. Right, heatmaps illustrating the change in Pol II and TFIIB binding in Esrrb KD versus siRNA control. Red is upregulated and green is downregulated. Values of the log2 ratio (siEsrrb versus siCtrl) were used.
(C) Mediator recruits Pol II and TFIIB to both enhancers and promoters. Left, Group A genes; right, Group B genes. Binding of Med1, Pol II and TFIIB at promoters and enhancers and their change in siEsrrb versus siCtrl are shown (see scale bar).
(D) Browser plots of examples showing Esrrb, Med1, Pol II and TFIIB binding and nascent RNA effects upon Esrrb KD as well as Esrrb and H3K27ac binding in siCtrl, at genomic regions encompassing Group A Aard (left) and Group B Nr0b1 (right). Y axes show normalized read counts of each ChIP-seq and nascent RNA. Gray bar, promoter; green bar, enhancer.
See also Figure S5.
We next classified 20 genes whose expression decreased 2-fold or more upon Esrrb KD into 2 groups (Figures 6C and S5B). Esrrb was bound at the enhancer alone in Group A or also at the proximal promoter in Group B. Note that the overall number of Group B genes that responded to Esrrb KD and contained significant peaks of Mediator, TFIIB and Pol II was small so we chose a random set of Group A genes to compare. We then quantitated changes in Mediator, Pol II and TFIIB enrichment at promoters and enhancers of both groups upon Esrrb KD (Figure 6C). For Group A genes, we found that Mediator, Pol II and TFIIB were depleted more at enhancers than promoters upon Esrrb KD. For Group B, Esrrb KD resulted in reduction of Mediator, Pol II and TFIIB at both enhancers and promoters. The browser plots of Aard (Group A) and Nrb01 (Group B) illustrate the effects (Figure 6D). We conclude that Esrrb can regulate PIC assembly at the proximal promoter. At proximal promoters lacking Esrrb, we assume there are other transcription factors that enable the proximal promoter to support certain features of the PIC, and confer DNase I sensitivity, but these features are insufficient for normal levels of transcription when the enhancer is inactivated.
Discussion
It has been poorly understood how metazoan promoters, enhancers and insulators of a gene (i.e., the gene unit) are organized within the 3D genome. The development of chromosome conformation capture (3C) technologies has provided powerful tools to address this problem. Hi-C data have revealed that each chromosome is organized into insulated TADs and further into sub-domains like insulated neighborhoods anchored by CTCF and Cohesin. Gene regulation was assumed to occur within insulated neighborhoods because deletion of their boundaries misregulated transcription of genes both within and flanking the original boundaries (Dowen et al., 2014). We were able to identify insulated neighborhoods for over 9,000 genes of which 3,929 are active (nascent RNA-seq RPKM >0.5). We addressed a simple question: "To what extent does an enhancer function on its nearby genes within an insulated neighborhood?" Enhancer inactivation is the most direct approach to this problem but it is difficult to delete enhancers systematically. We reasoned that knocking down Esrrb would represent a straightforward but broad method to inactivate enhancers without disrupting critical mESC genes or inducing differentiation.
Our study combined this simple enhancer-inactivation strategy with 4C and published databases of 3D chromatin interactions along with ChIP-seq of key proteins like Mediator. We found that distinct CTCF- and Cohesin-mediated chromatin loops apparently restrict the transcription stimulatory effect of enhancers to promoters within the same insulated neighborhoods. With few exceptions, only genes within such looped sub-domains were significantly affected by inactivation of Esrrb-dependent enhancers. This observation is consistent with a recent study showing that CTCF/Cohesin-mediated chromatin architecture delimits α-globin enhancer interactions and function (Hanssen et al., 2017).
Insulated neighborhoods typically contain a single gene like Sik1 but can contain multiple transcriptionally active genes as in the Kirrel2/Nphs1 and Slc13a5/Xaf1 regulons. These regulons represent examples of coordinate regulation by Esrrb-dependent enhancers within an insulated neighborhood. Co-regulation of genes in an insulated neighborhood and contacts between promoters, enhancers and boundaries are reminiscent of a previous study in which RNAPII transcription factories are spatially associated with CTCF-Cohesin foci (Tang et al., 2015) consistent with a basic gene unit organization (Figures 1 and 2).
Some insulated neighborhoods contain overlapping or internal Cohesin/CTCF-anchored loops that isolate promoters from enhancers. For example, the Klf4 locus contains five CTCF/Cohesin loops, two of which separate the gene from its enhancer (Figure S4B). If CTCF/Cohesin were acting as a classic insulator in these cases (Levine et al., 2014), the loops would block the enhancer. Therefore, the loops must be dynamic to allow the Klf4 promoter-enhancer interactions as illustrated in Figure 5. Such an observation could only be possible using enhancer-inactivation strategies. Occasionally, the boundaries reside within the gene such as the downstream Stard8 boundary (Figure 4B). In these instances, either the boundary is dynamic and/or Pol II can transcribe through it. CTCF is a member of the C2H2 family of Zinc finger proteins (Marshall et al., 2014). The prototype of this family, TFIIA, is known to remain bound to 5S RNA genes as Pol III transcribes through them (Shastry, 1996).
The loss of the Mediator from the enhancer correlated with transcriptional inactivation of a target gene upon Esrrb depletion. This observation is consistent with the fact that Mediator binds Esrrb and is essential for its ability to stimulate PIC assembly in vitro. While other enhancer-bound factors like p300 or MLL1/3 (Long et al., 2016) might be affected by depletion of Esrrb, the Mediator-responsiveness provided a clear approach to identify enhancers of affected genes. Importantly, we showed that depletion of Mediator at typical Esrrb-responsive enhancers correlated well with the decreases in promoter-enhancer looping by 4C and decreases in PIC assembly at the Esrrb-bound loci (Figures 5 and 6).
There is an incongruity between PICs at the enhancer and proximal promoter. Mediator binding is reduced at the enhancers of all >2-fold downregulated genes, whereas its binding at promoters is typically unaffected unless Esrrb is bound there. Consistent with our results, a recent study also found that mutations of MLL3/4 downregulate enhancer activity, but Pol II binding is barely altered at promoters (Dorighi et al., 2017). Promoter-enhancer deletion studies established long ago that a transcription factor-bound proximal promoter is necessary for the enhancer to function on a gene (Maston et al., 2006). Indeed, even in well-controlled in vitro enhancer studies, an activator bound at the proximal promoter only marginally stimulates transcription on its own but is necessary for the much stronger stimulation of a distal enhancer (Carey et al., 1990). Recent studies have emphasized that the enhancer interacts with the promoter to generate bursts of transcription (Levine et al., 2014). By such models, the enhancer is probably delivering a factor that enables the core promoter to function transiently. Perhaps the stimulus is Pol II itself or maybe an elongation factor like the super-elongation complex (SEC). The Med26 subunit of Mediator binds SEC (Takahashi et al., 2011). However, unlike other Mediator subunits (i.e., Med1, Med12, CDK8), we have found Med26 localizes primarily to promoters (Huang et al., 2017), where it is in a position to recruit SEC and act on paused Pol II (Zhou et al., 2012).
We infer from our data that proximal and core promoters must remain partially intact and activation-competent to receive the enhancer stimulus. The examples where the Mediator, TFIIB and Pol II at a promoter consistently decrease upon Esrrb KD are those where Esrrb is bound to the proximal promoter and serve as an exception that proves the rule. Insulated neighborhoods bearing Esrrb-responsive genes frequently contain transcriptionally inactive genes that are activated at later stages in development. The analysis in Figure S4F shows that many such genes lack promoter DNase I sensitivity. These inactive genes probably do not bind transcription factors that enable their proximal promoters because such factors are not present in mESCs. In sum, enhancer-inactivation by Esrrb depletion allowed a unique opportunity to examine many functional aspects of gene unit architecture on a large enough scale to argue that the resulting conclusions may be applicable to many mammalian genes. This knowledge will have important implications in identifying enhancer dysregulation in diseases such as cancer.
STAR METHODS
CONTACT FOR REAGENT AND RESOURCE SHARING
Further information and requests for reagents should be directed to the Lead Contact, Michael Carey (mcarey@mednet.ucla.edu).
EXPERIMENTAL MODEL AND SUBJECT DETAILS
Cell line
E14 murine embryonic stem cells were used.
METHOD DETAILS
Cell Culture
E14 mESCs were cultured on gelatin-coated plates without a MEF feeder layer under standard ESC conditions. Briefly, cells were cultured on 0.2% gelatinized (Sigma-Aldrich) tissue culture plates in ESC media containing DMEM-KO (Invitrogen, 10829-018) supplemented with 15% fetal bovine serum, 1000 U/ml LIF, 100 μM nonessential amino acids (Invitrogen, 11140-050), 2 mM L-glutamine (Invitrogen, 25030-081) and 8 nL/ml of 2-mercaptoethanol (Sigma, M7522) at 37°C in a humidified 5% CO2/95% air incubator.
ChIP-seq
E14 cells were harvested at 70-80% confluency by trypsinization. After washing with DPBS, cells were formaldehyde-crosslinked to a final concentration of 1% for 10 min at room temperature, followed by 5 min quenching with 125 mM glycine. Cells were washed twice with cold DPBS. If not used immediately, the cell pellet was flash frozen in liquid nitrogen and stored at −80°C. Crosslinked cells were resuspended in swelling buffer (25 mM HEPES pH 7.9, 1.5 mM MgCl2, 10 mM KCl, 0.1% NP-40, and 1X complete protease inhibitor cocktail [Roche]) and incubated for 10 min on ice. Cells were centrifuged and the cell pellet was resuspended in Buffer A (50 mM HEPES-KOH pH 7.9, 140 mM NaCl, 1 mM EDTA, 1% Triton X-100, 0.1% Na-deoxycholate, 0.1% SDS) plus 1X cOmplete protease inhibitor cocktail. Cell sonication was performed on a Qsonica Q800R2 sonicator with 20% amplitude for 20 cycles at 10s each with 30s between cycles at 4°C. Sonicated lysate was pre-cleared by incubating with Dynabeads Protein A/G. Part of the pre-cleared lysate was used as input and the remainder was incubated overnight at 4°C with 2-10 micrograms of antibody. DNA/Protein-antibody conjugates were precipitated using Dynabeads Protein A/G blocked with 5 mg/ml BSA in PBS. Beads were washed twice each with Buffer A, Buffer B (50 mM HEPES-KOH pH 7.9, 500 mM NaCl, 1 mM EDTA, 1% Triton X-100, 0.1% Na-deoxycholate, 0.1% SDS), LiCl buffer (20 mM Tris-HCl pH 8.0, 250 mM LiCl, 1 mM EDTA, 0.5% Na-deoxycholate, 0.5% NP-40) and TE buffer (10 mM Tris-HCl pH 8.0, 1 mM EDTA). DNA was eluted in elution buffer (10 mM Tris-HCl pH 8.0, 1 mM EDTA, 1% SDS). Cross-links were reversed overnight at 65°C. RNA and protein were digested us ing RNase A and Proteinase K, respectively, and DNA was purified by phenol-chloroform extraction and ethanol precipitation. Libraries were prepared using a KAPA LTP kit and sequenced using the Illumina HiSeq 2000 or 4000 platform for 50 bp single end reads. All experiments were performed with biological replicates.
mRNA-seq
Total RNA was extracted from mESCs using TRIzol reagent (Invitrogen) according to manufacturer’s instruction. To remove genomic DNA contamination, RNA samples were treated with DNase I and purified again by phenol/chloroform extraction and ethanol precipitation. Libraries were prepared with a KAPA stranded mRNA-Seq kit and sequenced on the Illumina HiSeq 2000 or 4000 for 50 base pairs in single end read mode. All experiments were performed with biological replicates.
Nascent RNA-seq
mESCs were harvested, washed with DPBS and lysed in 200 μl of ice-cold lysis buffer (10 mM Tris-HCl pH 7.5, 0.1% NP40, 150 mM NaCl). The cell lysate was gently layered over 500 μl of chilled sucrose cushion (24% RNAse-free sucrose in lysis buffer) in a new Eppendorf tube and centrifuged for 10 min at 4°C, 10,000xg. The supern atant (cytoplasmic fraction) was removed and the pellet (nuclei) was washed once with 200 μl of ice-cold 1×PBS/1 mM EDTA. The nuclear pellet was resuspended in 100 μl of pre-chilled glycerol buffer (20 mM Tris-HCl pH 7.9, 75 mM NaCl, 0.5 mM EDTA, 0.85 mM DTT, 0.125 mM PMSF, 50% glycerol) by gentle flicking of the tube. An equal volume (100 μl) of cold nuclear lysis buffer (10 mM HEPES pH 7.6, 1 mM DTT, 7.5 mM MgCl2, 0.2 mM EDTA, 0.3 M NaCl, 1 M urea, 1% NP-40) was added. The mix was vortexed vigorously for 2 s. The sample was incubated for 2 min on ice, and then centrifuged for 2 min at 4°C, 10,000xg. The supernatant (nuclear fraction/nucleoplasm) was removed and the pellet (chromatin) was gently rinsed with ice-cold 1×PBS/1 mM EDTA. 1 ml of Trizol reagent was added to the chromatin and incubated for 30 min at 50°C to dissolve it. Nascent RNA was extracted following the manufacturer’s instructions. Fractionation and sample purity were monitored by immunoblotting using α-tubulin for cytoplasmic extract, U170K for nuclear extract and histone H3 for chromatin. Libraries were constructed using KAPA Stranded RNA-Seq Kit with RiboErase (HMR). Single-end 50-bp sequencing by Illumina HiSeq 4000 was used. All experiments were performed with biological replicates.
4C Analysis
mESCs were harvested and formaldehyde-crosslinked as for ChIP-seq. Crosslinked cells were lysed for 15 min on ice in 10 mM Tris-HCl pH 8.0, 10 mM NaCl, and 0.2% NP-40 supplemented with cOmplete protease inhibitor. Nuclei were isolated by centrifugation and by removing the supernatant. Nuclei corresponding to 10 million cells were resuspended in 500 μl of the primary restriction enzyme buffer. SDS was added to a final concentration of 0.3% and samples were incubated for 1 h at 37°C at 1,200 rpm on a thermo-mixer. SDS was quenched by addition of Triton X-100 to a final concentration of 3%. Primary restriction enzyme (400 units) was added and samples were digested for 6 h on a thermo-mixer followed by addition of 400 additional units of the primary restriction enzyme and overnight digestion. The primary restriction enzyme was inactivated by heating to 65°C for 20 min. Samples were diluted to a total volume of 8 ml in ligation buffer (66 mM Tris-HCl pH 7.5, 5 mM MgCl2, 5 mM DTT, 1 mM ATP). Proximity ligation was carried out by adding 4000 units of T4 DNA ligase and incubating at room temperature overnight. After reversal of crosslinking and RNA removal, DNA was extracted by phenol/chloroform and purified by ethanol precipitation. A secondary digestion was performed overnight in a volume of 500 μl with 200 units of the secondary restriction enzyme. For proximity ligation, following inactivation of the restriction enzyme, each sample was diluted to 14 ml with ligation buffer. T4 DNA ligase (4000 units) was added and samples were incubated overnight at room temperature. DNA was extracted by phenol/chloroform and purified by ethanol precipitation. To remove salts, DNA was further purified using a QIAquick PCR Cleanup kit.
To construct 4C-seq libraries, reading and non-reading primers were designed for each viewpoint (Table S2). PCR was performed in sixteen 25-μl PCR reactions using Platinum Taq DNA Polymerase High Fidelity. Reaction conditions were as in the manufacturer’s instructions except 1.4 μM of each primer and 200-400 ng of template were used in each reaction. The PCR program was as follows: (1) 95°C, 5 min; (2) 95°C, 30 s; (3) 55°C, 1 min; (4) 68°C, 3 min; (5) go to (2), 30 cycles; (6) 68°C, 7 min. PCR products were first purified using illustra GFX PCR DNA and Gel Band Purification Kit (GE Healthcare) to remove primer dimers and then further purified using QIAquick PCR Purification Kit to remove salt. Libraries were sequenced on an Illumina HiSeq 2000 platform using the 50-bp single end read mode. All experiments were performed with biological replicates.
RNAi Analysis
For transient knockdown of Esrrb, E14 cells were grown to ~20% confluency in 6-well plates and transfected with siRNA using Lipofectamine RNAiMAX following the manufacturer’s protocol. 500 ng of siRNA were used for each well. Cells transfected with non-targeting siRNA were used as a negative control. Cells were harvested for downstream analysis 72h post transfection. For Klf4 knockdown, a targeting sequence of 5’-GGTCATCAGTGTTAGCAAA was placed into pSuper.puro (Oligoengine) to generate plasmid pSuper.puro-shKlf4. A control plasmid (pSuper.puro-shNT) was also constructed harboring a non-targeting sequence (5’-GAACGGCATCAAGGTGAAC). Plasmids were transfected into E14 cells using Lipofectamine 2000 following the manufacturer’s instructions. 3.6 μg of plasmid was used for each well in 6-well plates. 24h post transfection, cells were selected for another 72h in medium containing 1 μg/ml puromycin before harvesting for experiments. Knockdown efficiency was probed by both immunoblotting and RPKM analysis of mRNA-seq data.
Extract and Protein Preparation
mESC nuclear extract was generated as previously reported with modifications (Lin and Carey, 2012). In brief, cells were harvested and washed by cold DPBS. The cell pellet volume was determined. Cells were dounced in 5 volumes of Buffer A (10 mM HEPES-KOH pH 7.9, 10 mM KCl, 1.5 mM MgCl2, 0.5 mM DTT, 0.5 mM PMSF). Nuclei were harvested, resuspended and dounced in Buffer C (0.2 mM EDTA, 25% glycerol, 20 mM HEPES-KOH pH 7.9, 420 mM NaCl, 1.5 mM MgCl2, 0.5 mM DTT, 0.5 mM PMSF) followed by 1 h gentle stirring. After centrifugation, the supernatant was collected and dialyzed for 4 h against Buffer D (0.2 mM EDTA, 20% glycerol, 20 mM HEPES-KOH pH 7.9, 100 mM KCl, 1 mM DTT, 1 mM PMSF). Nuclear extract was used after removing the precipitate from the dialysate by centrifugation.
To deplete endogenous Esrrb from extracts, a 5’-biotinylated DNA template containing 3 tandem Esrrb binding sites was conjugated to paramagnetic beads. After equilibration in Buffer D, the DNA-conjugated beads were incubated with mESC nuclear extract for 30 min at room temperature. The supernatant was isolated and used directly for immobilized template assays as described below. To immunodeplete Mediator complex, antibodies against Med1, Med6, Med7, Med25 and CDK8 were cross-linked to protein A and G paramagnetic beads. Nuclear extract was incubated with the cross-linked beads for 4h at 4°C. The supernatant was isolated and used for immobilized template analysis as described below. Depletion efficiency was measured by immunoblotting.
Recombinant FLAG-tagged mouse Esrrb protein was purified from SF9 cells using a baculovirus overexpression system (Invitrogen). In brief, cells were resuspended in 0.3 M Buffer F (300 mM NaCl, 20% glycerol, 20 mM HEPES pH 7.9, 4 mM MgCl2, 0.2% Triton X-100, 0.1% NP-40) and sonicated. Lysates were treated with DNase I and heparin, and cleared by centrifugation. The resulting lysate was bound to M2 anti-Flag resin (Sigma-Aldrich), washed with 0.4 M Buffer F and eluted using 3X FLAG peptide (0.25 mg/ml; Sigma-Aldrich). Mediator complex was purified from a cell line stably expressing FLAG-tagged Med29 using immunoaffinity chromatography (Sato et al., 2004).
Immobilized Template Assays
Immobilized template assays were performed as described (Lin and Carey, 2012) with modifications. Briefly, a 5’-biotinylated DNA template encompassing E5E4T was immobilized onto paramagnetic beads. E5E4T refers to a template containing 5 tandem Esrrb binding sites positioned upstream of the adenovirus E4 TATA box. Immobilized template was incubated with or without recombinant Esrrb in binding buffer (100 mM KOAc, 20 mM Hepes, pH 7.6, 1 mM EDTA and 10% glycerol) for 1h at 30°C. mESC nuclear extr act (Esrrb depleted) or purified Mediator complex was added and the incubation continued at room temperature for 45 min. The beads were captured on a magnetic particle concentrator and washed three times with binding buffer. Bound proteins were eluted in SDS loading buffer, fractionated by SDS-PAGE and immunoblotted. For antibodies used in immunoblotting see Key Resources Table.
KEY RESOURCES TABLE.
| REAGENT or RESOURCE | SOURCE | IDENTIFIER |
|---|---|---|
| Antibodies | ||
| Mouse monoclonal anti-Esrrb | Perseus Proteomics | Cat#PP-H6705-00; RRID: AB_1964232 |
| Goat polyclonal anti-Med1 | Santa Cruz | Cat#sc-5334; RRID: AB_2235306 |
| Rabbit polyclonal anti-Med12 | Abcam | Cat#Ab70842; RRID: AB_1269392 |
| Rabbit polyclonal anti-Med26 | Santa Cruz | Cat#sc-48776; RRID: AB_782277 |
| Goat polyclonal anti-CDK8 | Santa Cruz | Cat# sc-1521; RRID: AB_2260300 |
| Rabbit polyclonal anti-Smc1 | Bethyl | Cat#A300-055A; RRID: AB_2192467 |
| Mouse monoclonal anti-Pol II (8WG16) | QED Bioscience | Cat#70101; RRID: N/A |
| Rabbit polyclonal anti-TFIIB | Carey Lab | N/A |
| Rabbit polyclonal anti-TAF2 | Novus | Cat#NBP1-21371; RRID: AB_1660526 |
| Mouse monoclonal anti-β-actin | Santa Cruz | Cat#sc-47778; RRID: AB_626632 |
| Mouse monoclonal anti-Med23 | BD Bioscience | Cat#550429; RRID: AB_393678 |
| Goat polyclonal anti-Med6 | Santa Cruz | Cat#sc-9434; RRID: AB_2250535 |
| Mouse monoclonal anti-TAF1 | Santa Cruz | Cat#sc-735; RRID: AB_671202 |
| Rabbit polyclonal anti-TFIIE-α | Santa Cruz | Cat#sc-237; RRID: AB_632482 |
| Rabbit polyclonal anti-TFIIH p89 | Santa Cruz | Cat#sc-293; RRID: AB_2262177 |
| Bacterial and Virus Strains | ||
| Biological Samples | ||
| Chemicals, Peptides, and Recombinant Proteins | ||
| Lipofectamine RNAiMAX Transfection Reagent | Thermo Fisher Scientific | Cat#13778075 |
| Lipofectamine 2000 Transfection Reagent | Thermo Fisher Scientific | Cat#11668027 |
| Dynabeads Protein G for Immunoprecipitation | Thermo Fisher Scientific | Cat#10004D |
| Dynabeads Protein A for Immunoprecipitation | Thermo Fisher Scientific | Cat#10002D |
| Dynabeads M-280 Streptavidin | Thermo Fisher Scientific | Cat#11205D |
| DpnII | New England Biolabs | Cat#R0543M |
| NlaIII | New England Biolabs | Cat#R0125L |
| CviQI | New England Biolabs | Cat#R0639L |
| T4 DNA Ligase | New England Biolabs | Cat#M0202M |
| 3X FLAG Peptide | Sigma-Aldrich | Cat#F4799 |
| Anti-FLAG M2 Magnetic Beads | Sigma-Aldrich | Cat#M8823 |
| Platinum Taq DNA Polymerase High Fidelity | Thermo Fisher Scientific | Cat#11304011 |
| TRIzol Reagent | Thermo Fisher Scientific | Cat#15596026 |
| Critical Commercial Assays | ||
| KAPA LTP Kit | Kapa Biosystems | Cat#KK8232 |
| KAPA Stranded RNA-Seq Kit with RiboErase (HMR) | Kapa Biosystems | Cat#KK8483 |
| KAPA Stranded mRNA-Seq Kit | Kapa Biosystems | Cat#KK8420 |
| Deposited Data | ||
| Raw and analyzed sequencing data, see Table S3 | This paper | GEO: GSE115340 |
| Western blot data | This paper | doi:10.17632/3twnpm7bdd.1 |
| Experimental Models: Cell Lines | ||
| E14 mouse embryonic stem cell | ATCC | CRL-1821 |
| Experimental Models: Organisms/Strains | ||
| Oligonucleotides | ||
| Mouse non-targeting siRNA | GE Dharmacon | Cat#D-001810-01 |
| Mouse Esrrb siRNA | GE Dharmacon | Cat#J-059177-09 |
| Primers for 4C, see Table S2 | This paper | N/A |
| Recombinant DNA | ||
| Plasmid: pSuper.puro-shKlf4 | This paper | N/A |
| Plasmid: pSuper.puro-shNT | This paper | N/A |
| Software and Algorithms | ||
| Bowtie 2 | Langmead and Salzberg, 2012 | http://bowtie-bio.sourceforge.net/bowtie2/index.shtml |
| TopHat 2 | Kim et al., 2013 | https://ccb.jhu.edu/software/tophat/index.shtml |
| SAMMate 2.7.4 | Xu et al., 2011 | http://sammate.sourceforge.net/ |
| HiCPlotter | Akdemir and Chin, 2015 | https://github.com/kcakdemir/HiCPlotter |
| 4C-Ker | Raviram et al., 2016 | https://github.com/rr1859/R.4Cker |
| 4Cseqpipe | van de Werken et al., 2012b | http://compgenomics.weizmann.ac.il/tanay/?page_id=367 |
| MACS2 | Zhang et al., 2008 | https://github.com/taoliu/MACS |
| bedtools | Quinlan and Hall, 2010 | http://bedtools.readthedocs.io/en/latest/ |
| IGB | Freese et al., 2016 | http://bioviz.org/ |
| CEAS | Shin et al., 2009 | http://liulab.dfci.harvard.edu/CEAS/ |
| Java TreeView | Saldanha, 2004 | http://jtreeview.sourceforge.net/ |
| Other | ||
ChIP-seq Data Analysis
Sequenced reads were mapped to mouse genome version mm9 using Bowtie software (Langmead and Salzberg, 2012). Only those reads aligning to a unique position with no more than 2 mismatches were retained for downstream processing. After mapping, clonal reads in each sample were removed. To call peaks, the mouse genome was segmented into 50-bp windows. A Poisson p-value was calculated for each window based on the IP and normalized input counts in this window. A significant peak was retained only when p-values of its own window and the 2 neighboring windows were all below 0.001 (Ferrari et al., 2012). If different IPs (e.g. control vs. knockdown) of the same protein were compared in downstream analyses, their total counts were first shuffled to the same number before peak calling. Their inputs were also shuffled similarly.
To address co-localization of different proteins (Figure 3D), summits of each ChIP were called by MACS2 (Zhang et al., 2008) using a cutoff p-value < 0.001. Two proteins were considered to co-occupy the same locus only when the distance of the two summits was within 100 bp.
To determine the binding density of different transcription factors at enhancers of different genes (Figures 3G-3L), data from a previously study (Whyte et al., 2013) were used in which all enhancers were assigned to each gene and enrichments of various transcription factors at each enhancer were quantified.
To compare between siCtrl and siEsrrb samples (Figures 3D and 6B), log2 ratio of normalized counts in siEsrrb versus siCtrl at each 50-bp window was calculated.
To compare DNase I hypersensitivity at inactive and active promoters within the same insulated neighborhoods (Figure S4F), DNase I raw tag counts were calculated and summed around +/−500bp of each promoter with CEAS (Shin et al., 2009).
All ChIP-seq browser plots were generated with IGB (Freese et al., 2016). ChIA-PET and promoter capture Hi-C loops were visualized using HiCPlotter (Akdemir and Chin, 2015).
4C Data Analysis
For analysis using 4Cseqpipe (van de Werken et al., 2012a), the fastq file containing all the reads was first converted to the format compatible for downstream processing using the “-fastq2raw” function of the pipeline, followed by de-multiplexing based on the barcode and reading primer sequence for each library. Using the “–map” function, reads were mapped to a fragmented mm9 genome digested by the restriction enzyme in silico. Normalizing and graphing were performed using the “-nearcis” function. Default settings were used in all steps except that ylim of the trend line was adjusted to optimize visualization of promoter-enhancer or promoter-boundary interactions.
For analysis by 4C-Ker (Raviram et al., 2016), a reduced genome was built using Bowtie2. The reduced genome contains only sequences flanking the primary restriction enzyme sites (51 bp on both sides). Reads were de-multiplexed and barcode and primer sequences were trimmed using a custom script. Trimmed reads were mapped to the reduced genome by Bowtie2 with option –p 12 –N 0. To remove self-ligated and undigested fragments, the fragments before and after the bait fragment were removed. Near-cis interactions were analyzed using the “nearBaitAnalysis” function in 4C-Ker with default settings.
Meta-Insulated-Neighborhood Analysis
Smc1 ChIA-PET data were first filtered by removing loops whose anchors did not overlap a significant CTCF ChIP-seq peak. More specifically, an Smc1 ChIA-PET loop was discarded if there was no CTCF binding in a region 1 kb around one or both anchors of this loop. After that step, Smc1 ChIA-PET data were further filtered by retaining loops of a size between 30 and 500 kb. For each transcription start site (TSS), the smallest Smc1 ChIA-PET loop encompassing it was identified and assigned to its gene in its insulated neighborhood. The 2 anchors of the ChIA-PET loop were considered the insulated neighborhood boundaries. To normalize each insulated neighborhood, the genomic regions between TSS and the two boundaries were both partitioned into 60 equal windows. 60 kb regions outwards of both boundaries were also partitioned into 2-kb windows. Protein enrichments or promoter capture Hi-C interactions in each window were calculated using a custom script. Heatmaps were generated using Java Treeview (Saldanha, 2004).
RNA-seq data analysis
Sequenced reads were mapped to mm9 using TopHat2 (Kim et al., 2013) with option –g 1 –p 4 –N 2. For mRNA-seq, gene transcription levels were normalized to RPKM using SAMMate (Xu et al., 2011) with Read Assignment Expectation Maximization (RAEM). For nascent RNA-seq, RNA levels in the entire gene body were normalized by calculating RPKM using a custom script. To visualize gene transcription levels on browser tracks, bedgraph files were generated using bedtools (Quinlan and Hall, 2010). To compare between siCtrl and siEsrrb, data were normalized using a custom script.
QUANTIFICATION AND STATISTICAL ANALYSIS
The statistical significance in Figures 3G-3L, S2F, S2G and 4A was assessed using the Wilcoxon rank-sum tests. In Figures 5 and S4E, Student’s t test was used to calculate the p values.
DATA AND SOFTWARE AVAILABILITY
Information of previously published datasets used in this paper can be found in Table S3. The accession number for the sequencing data generated in this study is GEO: GSE115340. Raw images of all the Western blots have been uploaded to Mendeley Data and are available at http://doi:10.17632/3twnpm7bdd.1.
Supplementary Material
Table S1. Insulated neighborhoods for Each Gene. Related to Figures 1 and S1. (separate Excel table)
Acknowledgements
This work was supported by National Institutes of Health grants R01 GM074701 to M.F.C., and P01 GM099134 to K.P F.D.L. and T.S. acknowledge support from a UCLA Quantitative and Computational Biosciences (QCB) Collaboratory Post-doctoral Fellowship and the QCB Collaboratory Community directed by Matteo Pellegrini. M.K. was supported by Ruth L. Kirschstein National Research Service Award GM007185. We thank Steve Smale, Jason Ernst, Iris Dror, Suman Pradhan, Yong Xue and Chengyang Huang for insightful comments on the manuscript.
Footnotes
Accession numbers
The GEO accession ID for aligned and raw data is GSE115340.
Declaration of Interests
The authors declare no competing interests.
Publisher's Disclaimer: This is a PDF file of an unedited manuscript that has been accepted for publication. As a service to our customers we are providing this early version of the manuscript. The manuscript will undergo copyediting, typesetting, and review of the resulting proof before it is published in its final citable form. Please note that during the production process errors may be discovered which could affect the content, and all legal disclaimers that apply to the journal pertain.
References
- Akdemir KC, and Chin L (2015). HiCPlotter integrates genomic data with interaction matrices. Genome Biol 16, 198. [DOI] [PMC free article] [PubMed] [Google Scholar]
- Carey M, Leatherwood J, and Ptashne M (1990). A potent GAL4 derivative activates transcription at a distance in vitro. Science 247, 710–712. [DOI] [PubMed] [Google Scholar]
- Chen FX, Xie P, Collings CK, Cao K, Aoi Y, Marshall SA, Rendleman EJ, Ugarenko M, Ozark PA, Zhang A, et al. (2017). PAF1 regulation of promoter-proximal pause release via enhancer activation. Science 357, 1294–1298. [DOI] [PMC free article] [PubMed] [Google Scholar]
- Chen X, Xu H, Yuan P, Fang F, Huss M, Vega VB, Wong E, Orlov YL, Zhang W, Jiang J, et al. (2008). Integration of external signaling pathways with the core transcriptional network in embryonic stem cells. Cell 133, 1106–1117. [DOI] [PubMed] [Google Scholar]
- Chen XF, Lehmann L, Lin JJ, Vashisht A, Schmidt R, Ferrari R, Huang C, McKee R, Mosley A, Plath K, et al. (2012). Mediator and SAGA have distinct roles in Pol II preinitiation complex assembly and function. Cell Rep 2, 1061–1067. [DOI] [PMC free article] [PubMed] [Google Scholar]
- Core LJ, Martins AL, Danko CG, Waters CT, Siepel A, and Lis JT (2014). Analysis of nascent RNA identifies a unified architecture of initiation regions at mammalian promoters and enhancers. Nat Genet 46, 1311–1320. [DOI] [PMC free article] [PubMed] [Google Scholar]
- de Laat W, and Duboule D (2013). Topology of mammalian developmental enhancers and their regulatory landscapes. Nature 502, 499–506. [DOI] [PubMed] [Google Scholar]
- Deng W, Lee J, Wang H, Miller J, Reik A, Gregory PD, Dean A, and Blobel GA (2012). Controlling long-range genomic interactions at a native locus by targeted tethering of a looping factor. Cell 149, 1233–1244. [DOI] [PMC free article] [PubMed] [Google Scholar]
- Deng W, Rupon JW, Krivega I, Breda L, Motta I, Jahn KS, Reik A, Gregory PD, Rivella S, Dean A, et al. (2014). Reactivation of developmentally silenced globin genes by forced chromatin looping. Cell 158, 849–860. [DOI] [PMC free article] [PubMed] [Google Scholar]
- Divekar SD, Tiek DM, Fernandez A, and Riggins RB (2016). Estrogen-related receptor beta (ERRbeta) - renaissance receptor or receptor renaissance? Nucl Recept Signal 14, e002. [DOI] [PMC free article] [PubMed] [Google Scholar]
- Dixon JR, Gorkin DU, and Ren B (2016). Chromatin Domains: The Unit of Chromosome Organization. Mol Cell 62, 668–680. [DOI] [PMC free article] [PubMed] [Google Scholar]
- Dixon JR, Selvaraj S, Yue F, Kim A, Li Y, Shen Y, Hu M, Liu JS, and Ren B (2012). Topological domains in mammalian genomes identified by analysis of chromatin interactions. Nature 485, 376–380. [DOI] [PMC free article] [PubMed] [Google Scholar]
- Dorighi KM, Swigut T, Henriques T, Bhanu NV, Scruggs BS, Nady N, Still CD 2nd, Garcia BA, Adelman K, and Wysocka J (2017). MII3 and MII4 Facilitate Enhancer RNA Synthesis and Transcription from Promoters Independently of H3K4 Monomethylation. Mol Cell 66, 568–576 e564. [DOI] [PMC free article] [PubMed] [Google Scholar]
- Dowen JM, Fan ZP, Hnisz D, Ren G, Abraham BJ, Zhang LN, Weintraub AS, Schujiers J, Lee TI, Zhao K, et al. (2014). Control of cell identity genes occurs in insulated neighborhoods in mammalian chromosomes. Cell 159, 374–387. [DOI] [PMC free article] [PubMed] [Google Scholar]
- Elkon R, and Agami R (2017). Characterization of noncoding regulatory DNA in the human genome. Nat Biotechnol 35, 732–746. [DOI] [PubMed] [Google Scholar]
- Ferrari R, Su T, Li B, Bonora G, Oberai A, Chan Y, Sasidharan R, Berk AJ, Pellegrini M, and Kurdistani SK (2012). Reorganization of the host epigenome by a viral oncogene. Genome research 22, 1212–1221. [DOI] [PMC free article] [PubMed] [Google Scholar]
- Freese NH, Norris DC, and Loraine AE (2016). Integrated genome browser: visual analytics platform for genomics. Bioinformatics 32, 2089–2095. [DOI] [PMC free article] [PubMed] [Google Scholar]
- Hansen AS, Pustova I, Cattoglio C, Tjian R, and Darzacq X (2017). CTCF and cohesin regulate chromatin loop stability with distinct dynamics. Elife 6. [DOI] [PMC free article] [PubMed] [Google Scholar]
- Hanssen LLP, Kassouf MT, Oudelaar AM, Biggs D, Preece C, Downes DJ, Gosden M, Sharpe JA, Sloane-Stanley JA, Hughes JR, et al. (2017). Tissue-specific CTCF-cohesin-mediated chromatin architecture delimits enhancer interactions and function in vivo. Nat Cell Biol 19, 952–961. [DOI] [PMC free article] [PubMed] [Google Scholar]
- Hnisz D, Day DS, and Young RA (2016). Insulated Neighborhoods: Structural and Functional Units of Mammalian Gene Control. Cell 167, 1188–1200. [DOI] [PMC free article] [PubMed] [Google Scholar]
- Huang C, Su T, Xue Y, Cheng C, Lay FD, McKee RA, Li M, Vashisht A, Wohlschlegel J, Novitch BG, et al. (2017). Cbx3 maintains lineage specificity during neural differentiation. Genes Dev 31, 241–246. [DOI] [PMC free article] [PubMed] [Google Scholar]
- Ji X, Dadon DB, Powell BE, Fan ZP, Borges-Rivera D, Shachar S, Weintraub AS, Hnisz D, Pegoraro G, Lee TI, et al. (2016). 3D Chromosome Regulatory Landscape of Human Pluripotent Cells. Cell Stem Cell 18, 262–275. [DOI] [PMC free article] [PubMed] [Google Scholar]
- Johnson KM, Wang J, Smallwood A, Arayata C, and Carey M (2002). TFIID and human mediator coactivator complexes assemble cooperatively on promoter DNA. Genes Dev 16, 1852–1863. [DOI] [PMC free article] [PubMed] [Google Scholar]
- Kagey MH, Newman JJ, Bilodeau S, Zhan Y, Orlando DA, van Berkum NL, Ebmeier CC, Goossens J, Rahl PB, Levine SS, et al. (2010). Mediator and cohesin connect gene expression and chromatin architecture. Nature 467, 430–435. [DOI] [PMC free article] [PubMed] [Google Scholar]
- Kim D, Pertea G, Trapnell C, Pimentel H, Kelley R, and Salzberg SL (2013). TopHat2: accurate alignment of transcriptomes in the presence of insertions, deletions and gene fusions. Genome Biol 14, R36. [DOI] [PMC free article] [PubMed] [Google Scholar]
- Kim YH, Marhon SA, Zhang Y, Steger DJ, Won KJ, and Lazar MA (2018). Rev-erbalpha dynamically modulates chromatin looping to control circadian gene transcription. Science 359, 1274–1277. [DOI] [PMC free article] [PubMed] [Google Scholar]
- Langmead B, and Salzberg SL (2012). Fast gapped-read alignment with Bowtie 2. Nat Methods 9, 357–359. [DOI] [PMC free article] [PubMed] [Google Scholar]
- Levine M, Cattoglio C, and Tjian R (2014). Looping back to leap forward: transcription enters a new era. Cell 157, 13–25. [DOI] [PMC free article] [PubMed] [Google Scholar]
- Lin JJ, and Carey M (2012). In vitro transcription and immobilized template analysis of preinitiation complexes. Curr Protoc Mol Biol Chapter 12, Unit 12 14. [DOI] [PMC free article] [PubMed] [Google Scholar]
- Long HK, Prescott SL, and Wysocka J (2016). Ever-Changing Landscapes: Transcriptional Enhancers in Development and Evolution. Cell 167, 1170–1187. [DOI] [PMC free article] [PubMed] [Google Scholar]
- Lupianez DG, Kraft K, Heinrich V, Krawitz P, Brancati F, Klopocki E, Horn D, Kayserili H, Opitz JM, Laxova R, et al. (2015). Disruptions of topological chromatin domains cause pathogenic rewiring of gene-enhancer interactions. Cell 161, 1012–1025. [DOI] [PMC free article] [PubMed] [Google Scholar]
- Marshall AD, Bailey CG, and Rasko JE (2014). CTCF and BORIS in genome regulation and cancer. Curr Opin Genet Dev 24, 8–15. [DOI] [PubMed] [Google Scholar]
- Martello G, Sugimoto T, Diamanti E, Joshi A, Hannah R, Ohtsuka S, Gottgens B, Niwa H, and Smith A (2012). Esrrb is a pivotal target of the Gsk3/Tcf3 axis regulating embryonic stem cell self-renewal. Cell Stem Cell 11, 491–504. [DOI] [PMC free article] [PubMed] [Google Scholar]
- Maston GA, Evans SK, and Green MR (2006). Transcriptional regulatory elements in the human genome. Annu Rev Genomics Hum Genet 7, 29–59. [DOI] [PubMed] [Google Scholar]
- Mumbach MR, Satpathy AT, Boyle EA, Dai C, Gowen BG, Cho SW, Nguyen ML, Rubin AJ, Granja JM, Kazane KR, et al. (2017). Enhancer connectome in primary human cells identifies target genes of disease-associated DNA elements. Nat Genet 49, 1602–1612. [DOI] [PMC free article] [PubMed] [Google Scholar]
- Phillips-Cremins JE, Sauria ME, Sanyal A, Gerasimova TI, Lajoie BR, Bell JS, Ong CT, Hookway TA, Guo C, Sun Y, et al. (2013). Architectural protein subclasses shape 3D organization of genomes during lineage commitment. Cell 153, 1281–1295. [DOI] [PMC free article] [PubMed] [Google Scholar]
- Pugh BF, and Venters BJ (2016). Genomic Organization of Human Transcription Initiation Complexes. PLoS One 11, e0149339. [DOI] [PMC free article] [PubMed] [Google Scholar]
- Quinlan AR, and Hall IM (2010). BEDTools: a flexible suite of utilities for comparing genomic features. Bioinformatics 26, 841–842. [DOI] [PMC free article] [PubMed] [Google Scholar]
- Rao SS, Huntley MH, Durand NC, Stamenova EK, Bochkov ID, Robinson JT, Sanborn AL, Machol I, Omer AD, Lander ES, et al. (2014). A 3D map of the human genome at kilobase resolution reveals principles of chromatin looping. Cell 159, 1665–1680. [DOI] [PMC free article] [PubMed] [Google Scholar]
- Rao SSP, Huang SC, Glenn St Hilaire B, Engreitz JM, Perez EM, Kieffer-Kwon KR, Sanborn AL, Johnstone SE, Bascom GD, Bochkov ID, et al. (2017). Cohesin Loss Eliminates All Loop Domains. Cell 171, 305–320 e324. [DOI] [PMC free article] [PubMed] [Google Scholar]
- Raviram R, Rocha PP, Muller CL, Miraldi ER, Badri S, Fu Y, Swanzey E, Proudhon C, Snetkova V, Bonneau R, et al. (2016). 4C-ker: A Method to Reproducibly Identify Genome-Wide Interactions Captured by 4C-Seq Experiments. PLoS Comput Biol 12, e1004780. [DOI] [PMC free article] [PubMed] [Google Scholar]
- Saldanha AJ (2004). Java Treeview--extensible visualization of microarray data. Bioinformatics 20, 3246–3248. [DOI] [PubMed] [Google Scholar]
- Sato S, Tomomori-Sato C, Parmely TJ, Florens L, Zybailov B, Swanson SK, Banks CA, Jin J, Cai Y, Washburn MP, et al. (2004). A set of consensus mammalian mediator subunits identified by multidimensional protein identification technology. Mol Cell 14, 685–691. [DOI] [PubMed] [Google Scholar]
- Schoenfelder S, Furlan-Magaril M, Mifsud B, Tavares-Cadete F, Sugar R, Javierre BM, Nagano T, Katsman Y, Sakthidevi M, Wingett SW, et al. (2015). The pluripotent regulatory circuitry connecting promoters to their long-range interacting elements. Genome Res 25, 582–597. [DOI] [PMC free article] [PubMed] [Google Scholar]
- Shastry BS (1996). Transcription factor IIIA (TFIIIA) in the second decade. J Cell Sci 109 (Pt 3), 535–539. [DOI] [PubMed] [Google Scholar]
- Shin H, Liu T, Manrai AK, and Liu XS (2009). CEAS: cis-regulatory element annotation system. Bioinformatics 25, 2605–2606. [DOI] [PubMed] [Google Scholar]
- Takahashi H, Parmely TJ, Sato S, Tomomori-Sato C, Banks CA, Kong SE, Szutorisz H, Swanson SK, Martin-Brown S, Washburn MP, et al. (2011). Human mediator subunit MED26 functions as a docking site for transcription elongation factors. Cell 146, 92–104. [DOI] [PMC free article] [PubMed] [Google Scholar]
- Tang Z, Luo OJ, Li X, Zheng M, Zhu JJ, Szalaj P, Trzaskoma P, Magalska A, Wlodarczyk J, Ruszczycki B, et al. (2015). CTCF-Mediated Human 3D Genome Architecture Reveals Chromatin Topology for Transcription. Cell 163, 1611–1627. [DOI] [PMC free article] [PubMed] [Google Scholar]
- van de Werken HJ, de Vree PJ, Splinter E, Holwerda SJ, Klous P, de Wit E, and de Laat W (2012a). 4C technology: protocols and data analysis. Methods Enzymol 513, 89–112. [DOI] [PubMed] [Google Scholar]
- van de Werken HJ, Landan G, Holwerda SJ, Hoichman M, Klous P, Chachik R, Splinter E, Valdes-Quezada C, Oz Y, Bouwman BA, et al. (2012b). Robust 4C-seq data analysis to screen for regulatory DNA interactions. Nat Methods 9, 969–972. [DOI] [PubMed] [Google Scholar]
- van den Berg DL, Snoek T, Mullin NP, Yates A, Bezstarosti K, Demmers J, Chambers I, and Poot RA (2010). An Oct4-centered protein interaction network in embryonic stem cells. Cell Stem Cell 6, 369–381. [DOI] [PMC free article] [PubMed] [Google Scholar]
- Whyte WA, Orlando DA, Hnisz D, Abraham BJ, Lin CY, Kagey MH, Rahl PB, Lee TI, and Young RA (2013). Master transcription factors and mediator establish super-enhancers at key cell identity genes. Cell 153, 307–319. [DOI] [PMC free article] [PubMed] [Google Scholar]
- Xie L, Torigoe SE, Xiao J, Mai DH, Li L, Davis FP, Dong P, Marie-Nelly H, Grimm J, Lavis L, et al. (2017). A dynamic interplay of enhancer elements regulates Klf4 expression in naive pluripotency. Genes Dev 31, 1795–1808. [DOI] [PMC free article] [PubMed] [Google Scholar]
- Xu G, Deng N, Zhao Z, Judeh T, Flemington E, and Zhu D (2011). SAMMate: a GUI tool for processing short read alignments in SAM/BAM format. Source Code Biol Med 6, 2. [DOI] [PMC free article] [PubMed] [Google Scholar]
- Zhang Y, Liu T, Meyer CA, Eeckhoute J, Johnson DS, Bernstein BE, Nusbaum C, Myers RM, Brown M, Li W, et al. (2008). Model-based analysis of ChIP-Seq (MACS). Genome Biol 9, R137. [DOI] [PMC free article] [PubMed] [Google Scholar]
- Zhou Q, Li T, and Price DH (2012). RNA polymerase II elongation control. Annu Rev Biochem 81, 119–143. [DOI] [PMC free article] [PubMed] [Google Scholar]
Associated Data
This section collects any data citations, data availability statements, or supplementary materials included in this article.
Supplementary Materials
Table S1. Insulated neighborhoods for Each Gene. Related to Figures 1 and S1. (separate Excel table)
Data Availability Statement
Information of previously published datasets used in this paper can be found in Table S3. The accession number for the sequencing data generated in this study is GEO: GSE115340. Raw images of all the Western blots have been uploaded to Mendeley Data and are available at http://doi:10.17632/3twnpm7bdd.1.