

Abstract
Advanced neuroimaging provides new opportunities to enhance head injury models, including the incorporation of white matter (WM) structural anisotropy. Information from high-resolution neuroimaging, however, usually has to be “down-sampled” to match a typically coarse brain mesh. To understand how this mesh-image resolution mismatch affects impact simulation and subsequent response sampling, we compared three competing anisotropy implementations (using either voxels, tractography, or a multiscale submodeling) and two response sampling strategies (element-wise or tractography-based, using brain mesh or neuroimaging for region segmentation, respectively). Using the combination of high resolution options as a baseline, we studied how the choice in each individual category affected the resulting injury metrics. By simulating a recorded loss of consciousness head impact, we found that injury metrics including peak strain and injury susceptibility in the deep WM regions based on fiber strain, but not on maximum principal strain, were sensitive to the anisotropy implementation, response sampling, and region segmentation. Overall, it was recommended to use tractography for anisotropy implementation and response sampling, and to employ neuroimaging for region segmentation, because they led to more accurate injury metrics. Further refining mesh locally via submodeling was unnecessary. Brain strain responses were also parametrically found to be closer to that from minimum fiber reinforcement, consistent with the fact that the majority of WM had a rather high degree of fiber dispersion. Finally, the upgraded Worcester Head Injury Model incorporating WM anisotropy was successfully re-validated against cadaveric impacts and an in vivo head rotation (“good” to “excellent” validation with an average Correlation Analysis score of 0.437 and 0.509, respectively). These investigations may facilitate further continual development of head injury models to better study traumatic brain injury.
Keywords: concussion, tractography, traumatic brain injury, white matter anisotropy, Worcester Head Injury Model
Introduction
Traumatic brain injury (TBI) is a leading cause of morbidity and death in the world.1,2 For decades, TBI has been an active research area where numerous efforts exist to elucidate the biomechanical mechanisms to mitigate the incident rate and severity. The recent heightened public awareness of mild TBI (mTBI), especially in sports-related concussion,3,4 has led to recommendations to address immediately the biomechanical determinants of injury risk and to identify effective concussion diagnostic metrics and biomarkers, among others.5
TBI, including mTBI, is caused by mechanical insult to the brain. For historical reasons, kinematic variables such as linear and rotational acceleration peak magnitudes, as well as their more sophisticated variants, have been used widely to describe impact severity and to predict injury. These scalar injury metrics, however, only indirectly infer brain mechanical responses such as strain and strain rate thought to cause injury.6 Effective, they treat the whole brain as a single unit and are unable to characterize the location or distribution of mechanical responses within the brain.
Characterizing the location and distribution of impact-induced brain responses is likely critical to studying the mechanisms of mTBI, including concussion, given its widespread neuroimaging alterations7 and a diverse spectrum of clinical signs and symptoms.8 Presumably, these clinical indicators of mTBI are a result of injury to specific brain regions of interest (ROIs), functionally important neural tracts, and/or the underlying structural and functional networks of the brain.
To translate an external head impact into region-specific strain responses within the brain, finite element (FE) models of the human head are employed increasingly to simulate the impact biomechanical event using the recorded impact kinematics as input. The resulting estimates of brain strain and strain rate provide much richer information than simple kinematic variables. Potentially, they allow for better correlation with advanced neuroimaging (e.g., diffusion tensor imaging (DTI)9–11 and functional magnetic resonance imaging (fMRI)12,13) and cognitive findings.8,14 This may lead to a multi-faceted understanding of the injury mechanisms and to reinforce injury findings.7,11
The reliability of model-based brain injury studies critically depends on the fidelity of the head injury model and impact simulation. Improving the model biofidelity has been an ongoing process.15 After decades of development, head injury models now have evolved from early two dimensioal versions to three dimensional models, with simplified brain anatomy derived from pictorial drawings to models with sophisticated details16 accurately conforming to high-resolution magnetic resonance imaging (MRI),17 even on a subject-specific basis.11
High-resolution MRI has also allowed substantial increase in brain mesh resolution to improve model geometrical accuracy and numerical convergence behavior. For example, the number of brain finite elements (as opposed to that of the whole head, because other components are irrelevant here) has increased from about 5–7 k18–20 and ∼30 k21 in earlier models, to ∼55 k11 and up to 164 k (depending on the desired resolution),22 for more recent models. The mesh resolution could even reach the level of MRI, when voxels were directly converted into hexahedral elements (∼1–2 million;17,23).
Aside from facilitating more accurate anatomical details, advanced neuroimaging, specifically, diffusion tensor imaging (DTI), has also enabled incorporating white matter (WM) structural anisotropy. The reason is that the brain is known to be heterogeneous and the WM is composed of distinctly aligned axonal fiber bundles that present strong anisotropy in mechanical behavior.24 By measuring the diffusion of water molecules in the brain in different directions with DTI, the orientations of WM axons can be deduced to inform brain regional anisotropy.
The significance of WM anisotropy on impact-induced brain responses has been studied recently.18,25–27 Findings suggest it is important for both impact-induced brain mechanical responses and the development of more reliable injury criteria.28 One study also suggests that the incorporation of WM anisotropy improves injury prediction performance using the reconstructed American National Football League impacts as a single “training dataset.”29
To incorporate WM anisotropy, however, information regarding the WM fiber orientation and dispersion (i.e., the degree of WM fiber alignment) from high resolution DTI usually had to be averaged to match typically coarse brain elements. For example, up to 4096 (range of 70–4096) DTI voxels at an isotropic resolution of 1 mm3 were averaged for a typical brain element.30 In another study, information from a number of DTI voxels of 2 × 2 × 3.6 mm3 were also averaged to match a brain mesh of an estimated resolution of ∼5 mm.31 This forced “down-sampling” could lead to substantial loss of information.29 No study exists, however, to investigate how this could affect model simulation accuracy adversely.
Simply increasing brain mesh resolution to match that of DTI voxels is unlikely to resolve the mesh-image resolution mismatch. The geometry of a brain element does not conform typically to that of a DTI voxel, thus, necessitating information averaging, regardless. Converting image voxels of the brain directly into hexahedral mesh elements17,23 would lead to a direct one-to-one, voxel-to-element correspondence. This would, however, inevitably increase the number of brain elements and simulation runtime, substantially, thus, posing a significant challenge for real-world applications. In fact, a 16-fold increase is expected when halving the element size (23-fold increase in the number of elements, with an additional factor of 2 resulting from halving the explicit stable time increment in simulation32). Further, voxelized meshes could be sensitive to the degree of boundary smoothing and surrounding tissue material properties to avoid artificial strain/stress concentration.22,33
Besides improving model biofidelity, it is also critical to understand how best to sample the simulated brain responses. This is important to derive response-based, region-specific injury metrics for subsequent brain injury prediction, without which the value of an advanced injury model and biofidelic simulation could be lost. Unfortunately, this appears to have been largely under-appreciated in TBI studies to date, because commonly used injury metrics simply rely on the peak response or above-threshold volume fraction of the whole brain (e.g., cumulative strain damage measure, CSDM21). Similar to their kinematic counterparts, these response-based scalar metrics do not inform the location or distribution of brain strains either, thus, leading to substantial loss of information.
Extending the injury metrics to specific brain regions—e.g., deep WM ROIs—could mitigate the limitation.29,34 Both elements and image voxels can be used to define a ROI and to sample the response distribution—i.e., either to directly report responses on coarse elements (which is the most widely used18,21,31,35,36), or on image voxels11 or tractography sampling points in the case of WM fiber strain.37 These response sampling approaches are related directly to deriving ROI-wise injury metrics for injury prediction. This necessitates an investigation into how best to sample the simulated brain responses.
Given these considerations, we conducted the following study with three main aims. First, we explored and compared three competing implementation approaches to incorporate WM anisotropy into the Worcester Head Injury Model (WHIM) by: (1) using DTI voxels or (2) tractography for averaging, and (3) further using submodeling as a cost-effective approach to mitigating the mesh-image resolution mismatch. Instead of uniformly refining the mesh, a multi-scale submodeling technique uses solutions of a “global,” coarse model as appropriate boundary/loading conditions to drive the response of a locally refined submodel.32 This avoided artificial stress/strain concentration with voxelized meshes and has been applied to study the vertebra,38 acetabulum liner,39 and tibial cartilage,40 but not yet the brain. This technique differs from other existing multi-scale modeling studies in the brain that, instead, investigate the micro- and cellular level brain responses using a representative volume element (RVE) and a periodic boundary condition.41,42
Second, we also investigated the significance of brain response sampling strategies and region segmentation methods on two commonly used injury metrics: ROI-wise peak strains and injury susceptibility measures (analogous to CSDM—i.e., above-threshold volume fraction in a given region34). To confirm whether the higher resolution options were preferred, we compared how injury metrics differed when using their respective lower resolution choices.
Finally, a fresh set of model validation was also provided for the upgraded WHIM using data from an expanded set of cadaveric head impacts43 and an in vivo volunteer head rotation.44 Validating the model at both ends of the impact severity spectrum may improve the confidence in its simulation for the majority of real-world concussive and subconcussive head impacts.45 Findings from this study may provide important insight into how best to incorporate WM anisotropy in head injury models and subsequently to sample the simulated brain responses for TBI studies in the future.
Methods
WHIM and WM anisotropy
Details of the WHIM mesh development, mesh quality, geometrical accuracy, and assignment of material properties for the various head components have been reported.11,46 A reduced integration scheme was adopted (C3D8R) and hourglass was controlled to be within 10% of the total internal energy. A layer of pia arachnoid complex between brain and skull allowed them to slide in the tangential direction.21 The hexahedral brain mesh had a resolution of 3.3 ± 0.79 mm. The model has been used recently to establish a real-time model simulation framework via pre-computation47–49 and to integrate tractography for WM fiber strain ( ) evaluation.34,37 The previous WHIM used an isotropic Ogden material model for the entire brain. Here, we incorporated WM anisotropy into the model (Fig. 1).
FIG. 1.

The exterior features (a) and intracranial components (b) of the Worcester Head Injury Model showing the 50 deep white matter (WM) regions of interest (c) and a subset of WM tractography fibers color-coded by their fractional anisotropy values. CSF, cerebrospinal fluid. Color image is available online at www.liebertpub.com/neu
The brain WM is composed of distinctly aligned axonal fiber bundles,50 and its anisotropy is modeled typically as a fiber-reinforced, transversely isotropic material.24 Several anisotropic models exist that accommodate high-rate, large deformation. They include the Puso-Weiss model51 adopted in the University of Strasbourg head injury model,18 quadratic reinforcing material model52 in a two-dimensional injury model,53 and the Holzapfel-Gasser-Ogden (HGO) model.54,55 The HGO model is the most commonly used in TBI studies, 25–27,56 because it allows incorporating DTI-derived fiber orientation ( ) and dispersion parameters (
 ) directly into the strain energy function, U
32:
) directly into the strain energy function, U
32:
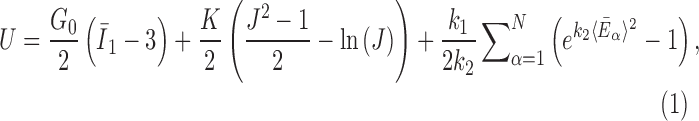 |
with

 |
In these equations, G0 and K are the initial shear modulus and bulk modulus, respectively;  and k2 are fiber stiffness parameters;
  characterizes the deformation of the fiber bundle with a mean direction,
  , via strain pseudo-invariant,
  ;
;  represents deviatoric component of the right Cauchy-Green strain tensor; and finally,
  (range of 0–1/3, from fully aligned to fully dispersed) describes the degree of fiber orientation dispersion.
The brain shear modulus contains both time-independent hyperelasticity and time-dependent viscoelasticity. Hyperelasticity in an HGO anisotropic model currently is only available in the form of a Neo-Hookean model in Abaqus.32 It is governed by either the initial or long-term shear modulus, G0 or  , at the user's discretion. It may not be feasible to directly identify G0 or
  based on existing brain experimental data, or to derive from the previous WHIM that employed an isotropic Odgen model because of the added WM fiber reinforcement. In addition, the shear modulus may still need to be adjusted, regardless, to maximize the model validation performance.17 Given these considerations, here we chose to iteratively optimize
  using a binary search strategy so that the resulting brain strain was comparable in magnitudes relative to the previous, already validated, WHIM, that adopted an isotropic material model for the brain.11 This maximized the overall response consistency between the two versions of WHIM.
Specifically, a lower and an upper bound of  were first determined (200 Pa57 and 1000 Pa,58 respectively). At every iteration,
  was adjusted to the average of the lower and upper bounds to simulate a recorded loss of consciousness (LOC) impact in American college football.59 The resulting element-wise peak maximum principal strains (
 ), regardless of time of occurrence, were compared with those from the previous isotropic WHIM using a linear regression. The iteration would stop when the regression slope was within 1.00 ± 0.05; otherwise, the lower or upper bound was adjusted accordingly to the current
  value. Three iterations were sufficient to yield a target
  of 895.53 Pa, resulting in a slope of 0.9956 in regression.
The viscoelasticity was modeled as a two-term Prony series:
 |
where the dimensionless relaxation modulus, gi, and time constants,  , were drawn from an in vivo shearing dynamic test at a frequency range of 5–350 Hz using corona radiata and thalmic nuclei samples.60 Only the viscoelastic Prony series were adopted here, but not the shear modulus, G0 from this early experiment because it was overly stiff. Nevertheless, its relatively large dynamic frequency range allowed proper model validations using both the high-rate cadaveric impact61,62 and ultra-low-rate in vivo volunteer data.44 This was important, because validating a head injury model at both ends of the impact severity spectrum would likely increase the confidence in model simulation for the majority of real-world concussive and subconcussive head impacts.45 The viscoelasticity may be further “optimized” in the future, by adjusting the time-varying shear moduli most relevant to the two extreme ends of impact severity.45
The fiber stiffness parameter, k1, was determined from the ratio of  (of 0.105; experimentally measured at a loading rate of 25 s−1; 50). For isotropic gray matter without fiber reinforcement, k1 was set to zero,27 instead of prescribing a nonzero value to indicate otherwise.26,31 The discontinuity in k1 and shear stiffness effectively led to property heterogeneity between the gray matter and WM. In contrast, k2 was set to 0 throughout the brain, assuming a linear contribution of fibers to the WM stiffness.63 For each WM element,
  was determined based on the averaged fractional anisotropy (FA) value (details below). Table 1 summarizes the material property parameters of the brain. Material properties of other head components remained identical to the previous WHIM.11
Table 1.
Summary of Holzapfel-Gasser-Ogden Anisotropic Material Property Parameters for the Brain White Matter
| Parameter | Value | References |
|---|---|---|
| G0 (Pa) | 2673.23 | Determined based on  following the viscoelasticity Prony series following the viscoelasticity Prony series |
 (Pa) (Pa) |
895.53 | Iteratively optimized (see text for details) |
| K (MPa) | 219 | References11,46,69 |
| k1 (Pa) | 25459 | Based on  from experiment50 from experiment50
|
| k2 | 0 | Reference63 |
 |
Depending on FA values | Reference25 |
| g1 | 0.6521 | Determined via Abaqus material evaluation based on published experimental data60 |
| g2 | 0.0129 | |
 |
0.0067 | |
 |
0.0747 |
FA, fractional anisotropy.
Property parameters for the gray matter are identical, except that k1 was set to 0 as no fiber reinforcement existed in this region.
WM anisotropy implementation
WM anisotropy was defined on an element-wise basis. Both co-registered DTI voxels11 and whole-brain tractography34 (isotropic resolution of 2 mm3 and 1 mm3, respectively) could be used to determine the averaged FA value and fiber orientation. First, the enclosed DTI voxels or fiber sampling points were identified by testing whether the voxel centroids or sampling points were within the boundary of the given brain element. They were used to compute a distance-weighted average FA30:
 |
where N is the number of enclosed voxels (3 ± 2; range 1–21) or fiber sampling points (149 ± 191; range 1–2223),  is the FA value of each voxel/sampling point, di is the Euclidean distance relative to the element centroid, while Le is one half the length of the element diagonal.18 The resulting
  was used to determine discretized
  values, similarly to a previous study.25
Using the voxel- and tractography-based approaches, the element-wise distributions of FA and  values in the entire WM are shown (Fig. 2). With the latter approach, because tractography tracts would terminate if the FA value was below a pre-set threshold of 0.2,37,64 all of the identified WM elements had an average FA above this threshold (Fig. 2c). Thus, no elements had a
  of 1/3 (Fig. 2d). Regardless, with either method, most of the WM elements (68% and 71%, respectively) had a
  value greater than 0.2.
FIG. 2.

Distribution histograms for (a and c) fractional anisotropy (FA) and (b and d)  values for all of the identified white matter (WM) elements, using two competing approaches. Virtually no elements had an FA greater than 0.9, and the majority had a
  greater than 0.2, regardless of the implementation method. For the voxel-based method, elements with averaged FA <0.2 mostly occurred at the gray matter and WM junction. These elements were treated as gray matter using the tractography-based method, because no fiber sampling points existed with FA <0.2. DTI, diffusion tensor imaging.
The average fiber direction was similarly obtained:
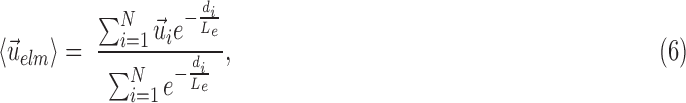 |
where  is the fiber direction of the enclosed voxel/sampling point. Unlike a scalar FA value, however, a vector and its negation,
  and
and  , respectively, were effectively identical in describing the same fiber direction. It was possible that two fibers of (nearly) an identical orientation had (almost) opposite directional vectors, however. This would result in an incorrect “averaged” vector (e.g., perpendicular relative to the true orientation; or, a null vector for two exactly opposing vectors). To ensure consistency among the fiber directions within a given element, it was necessary to negate
  if its angle relative to a randomly selected and common reference vector was greater than 90 degrees. In extreme cases, almost half of the voxel- or point-wise directional vectors needed to be flipped (Fig. 3).
FIG. 3.

Distribution of fiber directional vectors within a representative brain element, where virtually identical fiber orientations were represented by almost opposite directional vectors. It is important to first ensure consistency among the directional vectors before averaging to compute a correct main fiber orientation.
Global, whole-brain model validation
Revising the material properties of the brain required fresh model validations. The previous WHIM with an isotropic Ogden material model was validated using three cadaveric impacts along three different directions (frontal (C383-T1), occipital (C755-T2), and parietal (C393-T4) impacts;11,46). The evaluations were limited to corner locations of neutral density targets (NDT) because of data availability in the original publications.61,62 As more NDT displacement data have become available in other studies, here we reported WHIM validation performances using an expanded dataset (additional tests included C383-T3, C383-T4, and C291-T1; 6 tests in total) for all of the available NDT locations (N = 56 in total).43 For each selected cadaveric impact, WHIM was scaled to match the reported head size. The resulting model-predicted brain-skull relative displacement time histories were then compared against those measured in experiments.
In addition to high-rate cadaveric impacts, strain data from an in vivo head rotation44 was also used to validate at the opposite extreme of impact severity. Radial-circumferential shear strains were obtained from the simulation to report the above-threshold area fractions. For all simulations, validation performances were assessed using correlation score (CS) for consistency with the previous work11 as well as CORrelation and Analysis (CORA65). CS and CORA scores were reported for both the previous isotropic WHIM (Ogden) and the current anisotropic version (HGO), using either DTI voxels or tractography for WM anisotropy implementation.
Further, we used CORA as a ranking metric43 to compare WHIM validation performances against other recent or well-utilized models, including ABM,17 SIMon,21 THUMS,66 GHBMC,16 and the KTH model (with two isotropic material models and an additional anisotropic model;19,29).
Finally, validation against impact-induced brain pressure responses was not necessary for a nearly incompressible brain,1 because the pressure responses were essentially hydrostatic for blunt impacts with a duration longer than 2 msec.67,68 They can be determined uniquely by the magnitude and directionality of linear acceleration, as well as brain size and shape for a given head model.49,69
Submodels for the deep WM
With a co-registered WM atlas, the 50 deep WM ROIs were localized in the T1-weighted MRI (isotropic resolution of 1 mm3) of the subjected used to develop the WHIM mesh.34 The corresponding voxels were then converted into hexahedral elements (143.3 k elements and 190.0 k nodes) with a custom routine. WM anisotropy of the resulting submodel was defined similarly based on whole-brain tractography (average number of enclosed sampling points for each element of 87 ± 62, range 1–559).
Significance of WM fiber alignment
WM anisotropy has only been incorporated into head injury models relatively recently. By parametrically decreasing the dispersion parameter,  , from 1/3 to 0 to incrementally induce stronger WM fiber reinforcement in the local brainstem region, one study reported a lower
  in this area when simulating a sagittal head rotation (with other brain regions assumed isotropic25). The opposite was found, however, when simulating a concussive impact that had large coronal and axial rotational components,31 where fiber reinforcement yielded higher
  for the corpus callosum and brainstem. In contrast, lower WM fiber strains (
 ) in the two regions were observed, as expected.
Here, we extended the investigations further to the whole brain. Instead of locally assigning different dispersion parameter values based on neuroimages, we uniformly set the dispersion parameter,  , either to its lower or its upper bounds (0 and 1/3, respectively) for the entire WM elements. They represented two extreme conditions in which the WM was either fully aligned to induce maximum fiber reinforcement or fully dispersed with minimum reinforcement in effect. The resulting responses would yield the lower and upper bounds, and their differences would indicate the maximum effect because of the degree of WM alignment. It must be recognized, however, that even with
  of 1/3, WM was still stiffer than gray matter because of its nonzero k1 in this region, compared with a value of zero in the gray matter.27 In contrast, the earlier KTH model assumed the gray matter to be identical to an isotropic WM instead (i.e., the same nonzero k1 was used throughout the brain31).
Impact simulation and data analysis
WHIM validation was first conducted using impact acceleration profiles corresponding to the selected impacts as input to the rigid skull through the head center of gravity. All simulations were performed using Abaqus/Explicit (Version 2016; Dassault Systèmes, France). Only results from the baseline HGO model based on tractography were reported, along with those from the previous Ogden model, for comparison and completeness. Next, a recorded LOC impact in American college football59 was simulated using the two global models, with either DTI voxels or tractography to implement WM anisotropy. Each simulation required ∼25 min to complete (impact duration of ∼70 ms; double precision with 15 CPUs and GPU acceleration; Intel Xeon E5-2698 with 256 GB memory, and 4 NVidia Tesla K80 GPUs with 12 GB memory). An additional ∼40 min was required for the tractography-based submodel simulation.
For each global model, element-wise  and strain tensors were obtained at every solution time point (temporal resolution of 1 ms). Peak
  , regardless of the time of occurrence, was also determined. Next,
  was determined either on an element-wise basis (by projecting the strain tensor along the mean element-wise fiber direction) or along WM fiber sampling points within the deep WM.37 The corresponding peak
  was obtained similarly by finding the peak value over the course of impact simulation. For each individual deep WM ROI, peak
  and
and  (assessed at the 95th-percentile level) and injury susceptibility indices based on either
  (
( or
or  (
( were determined. These susceptibility indices characterized the volume fraction above a given threshold34 and were analogous to cumulative strain damage measure (CSDM) based on maximum principal strain.21 For illustration,
  and
and  were assessed at a strain threshold of 0.18 and 0.09, respectively, corresponding to the upper and lower bounds of a conservative strain threshold.70
The ROI-wise injury metrics for the 50 deep WM regions then served as a response group and were derived from each global model simulation (with either DTI voxels or tractography for anisotropy implementation). They were further compared in terms of Pearson correlation coefficient (r) and normalized root mean squared error (NRMSE; normalized by the response range determined from the tractography-based global model). ROI-wise injury metrics from the submodel were similarly assessed using tractography sampling points and were compared with those from the corresponding tractography-based global model.
Finally, the significance of WM fiber alignment was parametrically studied. By setting the FA-dependent  values uniformly to either 1/3 or 0 for the entire WM, two extreme cases were obtained with either the minimum or maximum fiber reinforcement. The same LOC impact was used to generate impact-induced strains. Element-wise
  and fiber sampling point-based
  from the tractography-based global model were used for this comparison. All data analyses were performed in MATLAB (R2017b; MathWorks, Natick, MA).
Results
Model validation
The two global models produced virtually identical relative brain-skull displacements for the cadaveric impacts as well as shear strains for the in vivo head rotation. Hence, only results from the tractography-based global model were reported. For cadaveric impacts, the anisotropic WHIM and the previous isotropic version had an overall CS of 83.89 and 83.72, respectively, based on the six expanded tests (details reported in Supplementary Figs. A1–A6 and Tables A1–A7; see online supplementary material at ftp.liebertpub.com). They were both categorized as “good” to “excellent” in validation performance according to a previously established criterion.71
The two versions of WHIM had an overall CORA score of 0.437 and 0.421, respectively. Among head injury models that have been validated against the five common cadaveric tests, both versions of the WHIM ranked the highest (Table 2). Detailed validation results are reported in the supplementary material; see online supplementary material at ftp.liebertpub.com. The two versions of WHIM had largely similar predictions of relative brain-skull displacements (their CORA scores ranged from 0.66 [C383-T3] to 0.74 [C755-T2]).
Table 2.
Summary of Worcester Head Injury Model Validation Performances Using either Anisotropic (Holzapfel-Gasser-Ogden) or Isotropic (Ogden) Material Properties in Terms of Correlation and Analysis Score, along with Comparisons against Five Other Head Injury Models43
| WHIM (HGO) | WHIM (Ogden) | ABM | SIMon | GHBMC | THUMS | KTH (M-R) | KTH (Ogden) | KTH (HGO) | |
|---|---|---|---|---|---|---|---|---|---|
| All tests Avg. | 0.437 (±0.127) | 0.421 (±0.096) | 0.376 (±0.053) | 0.354 (±0.087) | 0.323 (±0.083) | 0.270 (±0.052) | 0.421 (±0.051) | 0.374 (±0.085) | 0.431 (±0.119) |
| Five common tests avg. | 0.411 (±0.124) | 0.406 (±0.099) | 0.376 (±0.053) | 0.354 (±0.087) | 0.323 (±0.093) | 0.260 (±0.052) | N/A | N/A | N/A |
| Avg. rank | 2.6 | 2.6 | 2.8 | 3 | 4.2 | 5.8 | N/A | N/A | N/A |
Among those having been validated against the same set of impacts (shaded), both versions of WHIM ranked the highest, although the anisotropic version had a slightly higher average CORA score.
Note: CORA scores for ABM, SIMon, GHBMC, and THUMS were drawn from a previous study 43. For the three versions of KTH models, the scores were calculated based on digitized reports in related publications. They were excluded in the ranking because not all of the five common tests were selected for validation, and, for most tests, only the first 40 ms of the time history data or an incomplete set of NDTs were reported.
Finally, validation against a live human head rotation44 is also reported. Figure 4 shows the estimated area fractions of the radial-circumferential shear strains above three thresholds over time. Similarly, the time history curves were compared with the experimental measurements in terms of CS and CORA. On average, the HGO and Ogden version of WHIM had a CS of 90.01 and 89.80, and a CORA of 0.509 and 0.448, respectively (details reported in Supplementary Table A8; see online supplementary material at ftp.liebertpub.com). They were categorized as “excellent” according to a previous criterion.71 Figure 5 compares the estimated shear strain patterns with the experiment.
FIG. 4.

Area fraction of the radial-circumferential shear strains exceeding three strain thresholds44 for the +2 cm axial plane shown in Figure 5. HGO, Holzapfel-Gasser-Ogden.
FIG. 5.

The experimentally measured radial-circumferential shear strains at 228 msec when reaching peak on four axial planes (top) in comparison with those estimated by using the anisotropic (middle) and isotropic (bottom) versions of the Worcester Head Injury Model. Shear strains were scaled to (−0.1, 0.1). HGO, Holzapfel-Gasser-Ogden. Color image is available online at www.liebertpub.com/neu
DTI voxel- and tractography-based global models
Using coarse elements for WM ROI segmentation and brain response sampling (i.e.,  and
and  reported on an element-wise basis), the two global models using either DTI voxels or tractography to implement WM anisotropy had virtually identical
  (correlation coefficient r of 0.99,
  < 0.0001; and NRMSE of 1.01%; not shown). Their differences in
  were more substantial (correlation coefficient r dropped to 0.87 (
 < 0.0001), however, and NRMSE increased to 6.56%; Fig. 6a). For ROI-wise injury metrics, peak
  and
and  , significant correlations existed between the two global models (Fig. 6b, 6c), suggesting their concordance. Differences were also observed, however, with r of 0.82–0.92 and NRMSE of 10.2–13.2%. The difference was significantly correlated with their disparities in average fiber orientation (r of 0.64; p < 0.0001). This is illustrated in Fig. 7, where an example element enclosed two DTI voxels but 158 fiber sampling points, and their resulting average fiber orientations differed by 78.5 degrees.
FIG. 6.

When using coarse elements to sample and to segment the deep white matter regions of interest (ROI)s, the two global models differed in (a) element-wise  distribution, (b) ROI-wise peak
  and (c)
  . The arrow in (a) identifies the element illustrated in Figure 7. The identified fornix (FX) and corticospinal tract right (CST-R) had large differences in
  (0.65 vs. 0 and 0.97 vs. 0.75, respectively). NRMSE, normalized root mean squared error; DTI. Diffusion tensor imaging.
FIG. 7.

A representative brain element in the white region enclosing (a) two diffusion tensor imaging (DTI) voxels and (b) 158 tractography fiber sampling points, respectively. They had a substantial disparity in average fiber orientation (differed by 78.5 degrees) that led to a large difference in  as shown in Figure 6.
In contrast, when using high-resolution MRI to define WM ROIs and tractography (both of 1 mm3 resolution) to sample the responses, much more consistent results were obtained between the two global models (r of nearly 1.00, p < 0.0001; all with NRMSEs less than 2%; Fig. 8).
FIG. 8.

When using high resolution magnetic resonance imaging and tractography for response sampling, the two global models yielded largely comparable (a)  distributions as well as (b) region of interest (ROI)-wise peak
  and (c)
  in the 50 deep white matter (WM) ROIs. Some larger differences in
  occurred in the WM pontine crossing tract (PCT). The reason was that some elements (circled in [a]) were smaller than DTI voxels and they were incorrectly treated as gray matter in the voxel-based global model (hence, larger
  magnitudes because of a reduced modulus in this area). This problem was avoided when using tractography to implement WM anisotropy. NRMSE, normalized root mean squared error.
Tractography-based global model and submodel
Using tractography to implement WM anisotropy and to sample the resulting responses, the submodel had largely similar  and injury metrics compared with the global model (r of 0.98–1.00, p < 0.0001, with NRMSE 1.81–2.31%; Fig. 9). Larger differences in
  were observed in some individual sampling points (Fig. 9a).
FIG. 9.

Using tractography for response sampling, the global model and submodel yielded largely similar (a)  responses and the differences further diminished for (b) peak
  and (c)
  in the 50 deep white matter regions of interest. NRMSE, normalized root mean squared error.
Significance of WM fiber alignment
The significance of WM fiber alignment was not obvious for  , because either the minimum or maximum fiber alignment yielded comparable responses relative to the baseline (r of 0.99 and 0.95, p < 0.0001, and NRMSE of 1.52% and 3.68%, respectively; Fig. 10a, 10b). Nevertheless, the linear regression slopes of 1.01 and 0.94 for the two extreme cases, respectively, agreed with the expected softening/stiffening effect because of the fully dispersed or aligned WM fibers. They also suggested that the baseline model response was closer to the fully dispersed (its corresponding regression slope was closer to 1.0; Fig. 10a), which was confirmed in the fringe plots on a resampled coronal plane (Fig. 11). This was not surprising, because most of the WM elements had a large
  value close to its upper bound of 1/3 (Fig. 2).
FIG. 10.

Comparison of response distribution for element-wise  in the whole white matter (WM) (a, b) and pointwise
  in the entire WM (c, d) with respect to those from the baseline, by setting WM fiber dispersion parameter,
  to either 1/3 (minimum fiber reinforcement; a, c) or 0 (maximum reinforcement; b, d). NRMSE, normalized root mean squared error; HGO, Holzapfel-Gasser-Ogden.
FIG. 11.

Resampled  on a coronal plane (a)
  = 1/3 with minimum fiber alignment; (b) baseline; (c)
  = 0 with maximum alignment.
  reports were scaled to (0, 0.5). HGO, Holzapfel-Gasser-Ogden. Color image is available online at www.liebertpub.com/neu
Greater differences in  were observed (Fig. 10c, 10d), where linear regression slopes against the baseline HGO model for the two extreme cases were 1.09 and 0.81, respectively. Again, the resulting slopes were as expected, where lower or higher degree of WM fiber alignment led to larger or smaller
  , respectively. The fully aligned case with the maximum fiber reinforcement lowered
  in regions with highly aligned fiber bundles such as the corpus callosum, superior longitudinal fasciculus, and corticospinal tract right (arrows in Fig. 12).
FIG. 12.

Comparison of  in a coronal plane. (a)
  = 1/3 with minimum fiber reinforcement; (b) baseline; (c)
  = 0 with maximum reinforcement. HGO, Holzapfel-Gasser-Ogden; CC, corpus callosum; SLF, superior longitudinal fasciculus; CST, corticospinal tract. Color image is available online at www.liebertpub.com/neu
Discussion
The ultimate use of a head injury model is to facilitate reliable prediction of brain injury in the real world. This requires accurate model simulation as well as response sampling. While the former is well recognized throughout the continual model development,15 the importance of the latter appeared to have been largely underappreciated. This is critical, nevertheless, because without accurate response sampling, the advantage of a biofidelic model simulation would be significantly undermined.
With the advent of advanced neuroimaging, new opportunities emerge to further improve model biofidelity (e.g., by incorporating WM anisotropy28) and to enhance the accuracy in response sampling. In this study, we compared three competing approaches for WM anisotropy implementation and two strategies for response sampling. Response from the combination of higher resolution options was treated as the baseline against which results from lower resolution choices were compared. With one real-world LOC head impact simulations,72 we found that the recommended implementation, sampling, and segmentation choices depended on the response variable of interest.
For isotropic maximum principal strain ( ), injury metrics including peak
  and
and  were not sensitive to how WM anisotropy was implemented, because they were virtually identical. In contrast, injury metrics based on direction-sensitive WM fiber strains (
 ) could indeed depend on the choice of using either DTI voxels or tractography for WM anisotropy implementation. The dependency also relied, however, on how responses were sampled and how each ROI was segmented.
Using coarse brain elements for ROI segmentation and response sampling on an element-wise basis (element resolution of 3.3 ± 0.79 mm), peak  and
and  could differ significantly between the two anisotropy implementations (NRMSE of 10.26–13.26%; Fig. 6). This was especially true for
  , because some ROI-wise injury metrics could differ rather significantly (e.g., 0.65 vs. 0 in the fornix and 0.97 vs. 0.75 in the corticospinal tract right, between the two methods). This highlighted the aggregated errors because of finite discretization. Their differences were mainly because of the disparities in the averaged WM fiber direction (Fig. 7), where the substantial “down-sampling” with DTI voxels led to a significant loss of information. Because
  depended significantly on the fiber orientation, the resulting injury metrics also differed significantly, as expected.
When using higher resolution MRI voxels (isotropic resolution of 1 mm3) to define ROIs and tractography (neighboring point pair distance of 1 mm along the same tract) to sample the simulated brain responses, however, the two injury metrics obtained from the two WM anisotropy implementations became largely similar (NRMSE was reduced to below 2%; Fig. 8). This suggested that a higher resolution response sampling scheme was able to compensate for the discretization errors resulting from coarse mesh elements in WM anisotropy implementation.
Nevertheless, tractography outperformed voxels in WM anisotropy implementation in local brain regions that had a refined mesh smaller than that of the isotropic DTI voxels. For example, 20.8% (10 of 48 elements) of the WM PCT (minimum element edge of 1.01 mm) was misclassified as gray matter by DTI voxels (2 mm3 resolution; Fig. 8a; albeit, the two injury metrics in this region did not differ considerably). Refining the brain mesh via submodeling could induce relatively large differences in  pairs (Fig. 9a). This approach, however, did not significantly affect the two injury metrics of interest relative to the tractography-based global model (Fig. 9b, 9c).
These observations confirmed that the mesh-image resolution mismatch played an important role not only in the incorporation of WM anisotropy, but also in response sampling. The observed differences were likely to be even more substantial for other head injury models with coarser brain meshes (e.g., ∼5 mm 29 and up to 7.73 mm 18, vs. 3.3 mm here) because of a greater resolution mismatch. Regardless, our findings suggested that a tractography-based global model may be preferred for WM anisotropy implementation to ensure correct identification of WM ROIs and to assign their material properties accordingly. In addition, more accurate injury metrics were also obtained when using neuroimages to segment ROIs and tractography to sample brain responses. Further increasing the brain mesh resolution via submodeling was not necessary for the two injury metrics analyzed here.
Multi-scale submodeling
A submodeling approach was used to refine locally the brain mesh in the deep WM regions by directly converting image voxels into hexahedral elements. This did not cause a substantial increase in computational cost (∼40 min for 50 deep WM ROIs for a 70 msec impact simulation), compared with other globally refined meshes.17,23 This approach did not significantly affect the two injury metrics (Fig. 9). Nevertheless, the technique may be useful to provide localized strain response state to drive a multi-scale modeling framework to study injury mechanisms at the micro-41,42,73 or even nano-scale.74 There, axonal geometries can be explicitly meshed to represent the anatomical details at the appropriate length scales. In addition, material properties of the different axonal components could also be modeled separately to study axonal damages in the WM region. In this case, the submodel response would provide a link between the global, macroscopic response and the microscopic or nanoscale behavior of the axonal composite structure. While this was not the intention of our current study, the utility of this technique will be explored further in the future.
Significance of WM alignment
Conflicting findings were reported on the significance of WM alignment on regional  by the same group.25,31 Here, we extended the earlier studies by uniformly setting
  of the entire WM to two extreme values, 1/3 and 0. Globally considering the entire WM, the variation in
  only generated subtle changes in
  relative to the baseline (r of 0.92–0.98 and NRMSE of 3.18–5.98%; Fig. 10 and Fig. 11). Smaller differences were observed with the minimum fiber alignment, suggesting that the baseline model was closer to the case of fully dispersed WM fibers. On an element-wise basis, however, larger or smaller
  was both possible (points existed on both sides of the diagonal line; Fig. 10a, 10b), suggesting the alteration in
  magnitude distribution because of the variation in
  . Nevertheless, a direct comparison with the previous findings was not feasible, because they used peak strains in an element for comparison25,31 (which may explain their conflicting findings), rather than
  distribution here.
Larger differences existed in  because of the variation in
  (Fig. 10c, 10d). Similarly, the baseline responses in
  were closer to the fully dispersed scenario when considering the entire WM. The variation in
  mostly affected ROIs with highly aligned fiber bundles of low
  values (Fig. 12), however. For example, peak
  in the corpus callosum decreased by 28.6% (from 0.21 to 0.15) when
  varied from 1/3 to 0 (minimum and maximum reinforcement, respectively). Overall, these parametric investigations indeed demonstrated the stiffening effect because of highly aligned WM fibers, as expected. On a global scale, however, baseline
  and
and  responses were more similar to the fully dispersed cases than the other extreme with fully aligned fibers, because the majority of WM elements had a rather dispersed distribution with a large
  value (>0.2; Fig. 2).
Model validation
Model validation is important to assess the confidence in real-world impact simulations. Using an expanded dataset of cadaveric head impacts43 and all of the available NDT relative displacements (N = 56), both versions of the WHIM with either HGO or Ogden material properties were categorized as “good” to “excellent” in validation according to CS.66 Using the CORA metric, both versions of the WHIM ranked higher over SIMon, GHBMC, THUMS, and the recent ABM that optimized the material properties to maximize CORA.43 Their CORA scores were also comparable to those from the KTH models that limited their evaluation to the first 50 ms in impact (vs. 100–120 ms duration for others).
It was tempting to rank the performances of head injury models. As recognized,43 however, the CORA scores and ranks should be interpreted as a guideline to assess model performance, rather than a reliable approach to pick the “best” model. This was important, because a good validation against sparsely measured NDT displacement time histories was not sufficient to ensure the performance in validation against strain responses that were most relevant to brain injury. For example, consider two perfectly aligned sine wave displacement time histories for two hypothetical locations alone a line. A zero strain was expected because they had no relative displacement over time. A slight misalignment in their phase, however, could lead to a substantial non-zero relative motion or strain. By default, the phase component of the CORA rating had a rather low weighting factor of 0.125 (or 1/3, as recommended75). Therefore, the phase change could lead to a rather high CORA score (because their magnitudes and shapes were identical) that would erroneously suggest an excellent validation performance.
The notion that the earlier cadaveric tests were not “totally suited” or “designed” for head injury model validation was not new, as suggested by the same research group where cadaveric impact tests were conducted.15 Therefore, a recent piglet brain injury study chose to use strain, rather than displacement, for material property optimization and model validation.76
For this reason, we further compared WHIM-estimated radial-circumferential shear strains with the measurements from an in vivo head rotation test (peak rotational acceleration of ∼300 rad/s2;44), similarly to other studies.11,26,27 The above-threshold strain magnitudes and strain patterns for both WHIM versions were similar to those measured, suggesting satisfactory validation performance. Admittedly, the in vivo data were measured far from injurious levels. They were likely relevant, however, to subconcussive head impacts on the sports field (e.g., 25th percentile subconcussive rotational acceleration peak 531–682 rad/s2 in collegiate football,77 which was on the same order of the in vivo data). Therefore, validating a head injury model at both ends of the head impact severity spectrum may improve the confidence of model performance in a range of head impacts relevant to concussion and sub-concussion.45 This was important, given the growing concern on the cumulative effects from repeated subconcussive head impacts.13,78
Averaged brain strains do exist for high-rate cadaveric impacts,68 which were used to validate the KTH model.29 They were calculated based on a triad using the measured brain-skull displacements as input via finite element modeling. The reported strain magnitudes (mostly ∼2% in maximum principal strain and shear strain) were similar to the in vivo shear strains44). The two sets of experiments, however, differed greatly in peak rotational acceleration (7.0–26.3 krad/s2 vs. ∼300 krad/s2). Therefore, their similar strain levels, in fact, suggested substantial inconsistencies between the two datasets. For this reason, the regional average strain data from cadaveric impacts were not used for validation in our study.
Model sophistication vs. validation and injury prediction performances
With the ever-growing sophistication in head injury models, it is desirable that this is accompanied by improved model validation and/or injury prediction performances as well. An objective conclusion may not be trivial, however. For model validation, the current experimental data from the cadaveric impacts and in vivo brain biomechanics may not be sufficient to discriminate two head injury models (as similarly found in other work18,29), particularly given their inherent limitations in model validation as noted recently.45 The two versions of the WHIM (i.e., isotropic and the HGO material properties of the brain, respectively) had largely comparable CORA scores based on the cadaveric impacts (Table 2) and similar patterns and magnitudes of shear strains when simulating in vivo head rotation (Fig. 5). It was difficult to ascertain which one was more “biofidelic,” despite some observed differences (Supplementary Figs. A1–A6 and Fig. 4).
Because the validation performance metric alone is likely insufficient to reliably evaluate the quality of a head injury model, it is necessary to assess the injury prediction performance as a separate measure to justify the increased model sophistication. Based on the reconstructed American National Football League head impacts,79 one study suggests that fiber strain, after incorporating WM anisotropy, improves injury prediction performance.29 Similar to others,19,35,36 however, this study only reported a “training” rather than a “cross-validation” performance.34 This prevented an objective evaluation. Further, the injury dataset is known to have significantly undersampled the noninjury cases and may not reflect the actual distribution of head impacts in the real world (e.g., collegiate football head impacts on the sports field77,80). Finally, only one impact was reconstructed for each selected athlete, and no cumulative effects from repeated head impacts were considered that are now thought to be important.13,78.
Thus, although WM anisotropy was important to brain responses,18,25–27 no objective conclusion could be made here that the added model sophistication indeed improved validation and/or injury prediction performances. This requires further work and better-quality datasets for an objective evaluation.45 Nevertheless, the recommended approaches identified here for WM anisotropy implementation, subsequent response sampling, and region segmentation may facilitate future investigations along this line of research.
Other limitations and further thoughts
Because WM structural anisotropy was only integrated into head injury models relatively recently, there were other limitations worthy of note. For the HGO model adopted here, its hyperelasticity was limited to a Neo-Hookean model in Abaqus, which may not provide reliable nonlinear behavior along the transverse direction.81 In addition, its viscoelasticity was also limited to isotropy.32 The voxel- and tractography-based approaches treated elements near the gray and white matter junction (with FA <0.2) differently—either as WM or as gray matter because of the way tractography was created37,64 (Fig. 2). It was unclear, however, which approach was more “biofidelic.”
There were other inconsistencies in how WM anisotropy was implemented. For example, using the HGO model, the fiber reinforcement parameter, k1, was chosen here according to a high-rate study (25 s−1;  of 0.10550), because this was related to “mild injury.”25,63 Other studies26,27 relied on a low-rate study (0.01 s−1;82), however, where the much higher ratio of
  (value of 2.36 according to26) suggested little fiber reinforcement (confirmed, but not shown here). In contrast, using a Puso-Weiss model, another study determined fiber stiffness in large and small strains using both tests accordingly.83 In addition, some studies assigned a nonzero k1 to the gray matter,26,31 which would artificially induce reinforcement in this well-known isotropic region. Hence, we chose to set k1 to zero in the gray matter instead.27 Similarly, some studies used a continuous, FA-dependent dispersion parameter,
  ,26,27 while others,25 including our work here, discretized its values (which led to a significant reduction in simulation runtime). Most studies also incorporated
  by nonlinearly fitting the FA values, while one study directly multiplied FA values into the constitutive equation without fitting.18 Further, we showed that it was important to ensure fiber orientation consistency before averaging (Fig. 3), which appears to have been neglected in previous studies.
Finally, our current implementation of WM anisotropy relies on discretization of information from WM fiber tracts. However, it is possible to maintain continuous fiber tracts in the model via an embedded method 84 or the submodeling technique presented here. This will be explored in the future.
These limitations and implementation inconsistencies may pose challenges in comparing injury findings across head injury models.85 Nevertheless, by using consistent approaches, it reduces inconsistency and would facilitate future brain injury studies.
Conclusion
Based on results from one recorded LOC head impact, we found that using tractography was preferred to implement WM anisotropy and response sampling to maximize model simulation accuracy. Considering the entire WM regions, the brain is closer to fully dispersed (vs. aligned) WM fiber bundles. Both the previous WHIM and the current version incorporating WM anisotropy had comparable model validation performances, because both were categorized as “good” to “excellent” in validation against cadaveric impacts and in vivo brain biomechanics data. Further work and better-quality datasets are still necessary, however, to conclude that the incorporation of WM anisotropy indeed improves model validation and/or injury prediction performances.
Supplementary Material
Acknowledgment
Funding is provided by the NIH Grants R01 NS092853 and R21 NS088781.
Author Disclosure Statement
No competing financial interests exist.
References
- 1. Meaney D.F., Morrison B., and Dale Bass C. (2014). The mechanics of traumatic brain injury: a review of what we know and what we need to know for reducing its societal burden. J. Biomech. Eng. 136, 021008. [DOI] [PMC free article] [PubMed] [Google Scholar]
- 2. Peden M., Scurfield R., Sleet D., Mohan D., Hyder A., Jarawan E., and Mathers C. (2004). World report on road traffic injury prevention. World Health Organization, Geneva [Google Scholar]
- 3. Chrisman S., Schiff M., Chung S., Herring S., and Rivara F. (2014). Implementation of concussion legislation and extent of concussion education for athletes, parents, and coaches in washington state. Am. J. Sports Med. 42, 1190–1196 [DOI] [PubMed] [Google Scholar]
- 4. Zonfrillo M., Kim K., and Arbogast K.B. (2015). Emergency department visits and head computed tomography utilization for concussion patients from 2006 to 2011. Acad. Emerg. Med. 22, 872–877 [DOI] [PMC free article] [PubMed] [Google Scholar]
- 5. National Research Council I. (2014). Sports-related concussions in youth: improving the science, changing the culture. NRC, Washington, DC: [PubMed] [Google Scholar]
- 6. King A.I., Yang K.H., Zhang L., Hardy W., and Viano D.C. (2003). Is head injury caused by linear or angular acceleration? Presented at the IRCOBI Conference Lisbon [Google Scholar]
- 7. Bigler E.D. (2016). Systems biology, neuroimaging, neuropsychology, neuroconnectivity and traumatic brain injury. Front. Syst. Neurosci. 10, 1–23 [DOI] [PMC free article] [PubMed] [Google Scholar]
- 8. Duhaime A.C., Beckwith J.G., Maerlender A.C., McAllister T.W., Crisco J.J., Duma S.M., Brolinson P.G., Rowson S., Flashman L.A., Chu J.J., and Greenwald R.M. (2012). Spectrum of acute clinical characteristics of diagnosed concussions in college athletes wearing instrumented helmets. J. Neurosurg. 117, 1092–1099 [DOI] [PMC free article] [PubMed] [Google Scholar]
- 9. Bazarian J.J., Zhu T., Blyth B., Borrino A., and Zhong J. (2012). Subject-specific changes in brain white matter on diffusion tensor imaging after sports-related concussion. Magn. Reson. Imaging 30, 171–180 [DOI] [PMC free article] [PubMed] [Google Scholar]
- 10. McAllister T.W., Ford J.C., Flashman L.A., Maerlender A., Greenwald R.M., Beckwith J.G., Bolander R.P., Tosteson T.D., Turco J.H., Raman R., and Jain S. (2014). Effect of head impacts on diffusivity measures in a cohort of collegiate contact sport athletes. Neurology 82, 63–69 [DOI] [PMC free article] [PubMed] [Google Scholar]
- 11. Ji S., Zhao W., Ford J.C., Beckwith J.G., Bolander R.P., Greenwald R.M., Flashman L.A., Paulsen K.D., and McAllister T.W. (2015). Group-wise evaluation and comparison of white matter fiber strain and maximum principal strain in sports-related concussion. J. Neurotrauma 32, 441–454 [DOI] [PMC free article] [PubMed] [Google Scholar]
- 12. Iraji A., Benson R.R., Welch R.D., Neil B.J., Woodard J.L., Ayaz I., Kulek A., Medado P., Soltanian-zadeh H., Liu T., Haacke M., and Kou Z. (2015). Resting state functional connectivity in mild traumatic brain injury at the acute stage: independent component and seed based analyses. J. Neurotrauma 32, 1031–1045 [DOI] [PMC free article] [PubMed] [Google Scholar]
- 13. Talavage T.M., Nauman E.A., Breedlove E.L., Yoruk U., Dye A.E., Morigaki K.E., Feuer H., and Leverenz L.J. (2014). Functionally-detected cognitive impairment in high school football players without clinically-diagnosed concussion. J. Neurotrauma 31, 327–338 [DOI] [PMC free article] [PubMed] [Google Scholar]
- 14. McAllister T.W., Flashman L.A., Maerlender A., Greenwald R.M., Beckwith J.G., Tosteson T.D., Crisco J.J., Brolinson P.G., Duma S.M., Duhaime a-C.C., Grove M.R., and Turco J.H. (2012). Cognitive effects of one season of head impacts in a cohort of collegiate contact sport athletes. Neurology 78, 1777–1784 [DOI] [PMC free article] [PubMed] [Google Scholar]
- 15. Yang K.H., Hu J., White N.A., King A.I., Chou C.C., and Prasad P. (2006). Development of numerical models for injury biomechanics research: a review of 50 years of publications in the Stapp Car Crash Conference. Stapp Car Crash J. 50, 429–490 [DOI] [PubMed] [Google Scholar]
- 16. Mao H., Zhang L., Jiang B., Genthikatti V.V., Jin X., Zhu F., Makwana R., Gill A., Jandir G., Singh A., and Yang K.H. (2013). Development of a finite element human head model partially validated with thirty five experimental cases. J. Biomech. Eng. 135, 111002–15 [DOI] [PubMed] [Google Scholar]
- 17. Miller L.E., Urban J.E., and Stitzel J.D. (2016). Development and validation of an atlas-based finite element brain model model. Biomech Model. 15, 1201–1214 [DOI] [PMC free article] [PubMed] [Google Scholar]
- 18. Sahoo D., Deck C., and Willinger R. (2014). Development and validation of an advanced anisotropic visco-hyperelastic human brain FE model. J. Mech. Behav. Biomed. Mater. 33, 24–42 [DOI] [PubMed] [Google Scholar]
- 19. Kleiven S. (2007). Predictors for traumatic brain injuries evaluated through accident reconstructions. Stapp Car Crash J. 51, 81–114 [DOI] [PubMed] [Google Scholar]
- 20. Horgan T.J., and Gilchrist M.D. (2003). The creation of three-dimensional finite element models for simulating head impact biomechanics. Int. J. Crashworthiness 8, 353–366 [Google Scholar]
- 21. Takhounts E.G., Ridella S.A., Tannous R.E., Campbell J.Q., Malone D., Danelson K., Stitzel J., Rowson S., Duma S., Hasija V., Tannous R.E., Campbell J.Q., Malone D., Danelson K., Stitzel J., Rowson S., and Duma S. (2008). Investigation of traumatic brain injuries using the next generation of simulated injury monitor (SIMon) finite element head model. Stapp Car Crash J. 52, 1–31 [DOI] [PubMed] [Google Scholar]
- 22. Mao H., Gao H., Cao L., Genthikatti V.V., and Yang K.H. (2013). Development of high-quality hexahedral human brain meshes using feature-based multi-block approach. Comput. Methods Biomech. Biomed. Engin. 16, 271–279 [DOI] [PubMed] [Google Scholar]
- 23. Chen Y., and Ostoja-Starzewski M. (2010). MRI-based finite element modeling of head trauma: spherically focusing shear waves. Acta Mech. 213, 155–167 [Google Scholar]
- 24. Feng Y., Qiu S., Xia X., Ji S., and Lee C.H. (2017). A computational study of invariant I5 in a nearly incompressible transversely isotropic model for white matter. J. Biomech. 57, 146–151 [DOI] [PMC free article] [PubMed] [Google Scholar]
- 25. Giordano C., and Kleiven S. (2014). Connecting fractional anisotropy from medical images with mechanical anisotropy of a hyperviscoelastic fibre-reinforced constitutive model for brain tissue. J. R. Soc. Interface 11, 20130914. [DOI] [PMC free article] [PubMed] [Google Scholar]
- 26. Wright R.M., Post A., Hoshizaki B., and Ramesh K.T. (2013). A multiscale computational approach to estimating axonal damage under inertial loading of the head. J. Neurotrauma 30, 102–118 [DOI] [PubMed] [Google Scholar]
- 27. Ganpule S., Daphalapurkar N.P., Ramesh K.T., Knutsen A.K., Pham D.L., Bayly P. V., and Prince J.L. (2017). A Three-dimensional computational human head model that captures live human brain dynamics. J. Neurotrauma 34, 2154–2166 [DOI] [PMC free article] [PubMed] [Google Scholar]
- 28. Carlsen R.W., and Daphalapurkar N.P. (2015). The importance of structural anisotropy in computational models of traumatic brain injury. Front. Neurol. 6, 28. [DOI] [PMC free article] [PubMed] [Google Scholar]
- 29. Giordano C., and Kleiven S. (2014). Evaluation of axonal strain as a predictor for mild traumatic brain injuries using finite element modeling. Stapp Car Crash J. 58, 29–61 [DOI] [PubMed] [Google Scholar]
- 30. Chatelin S., Deck C., Renard F., Kremer S., Heinrich C., Armspach J.P., and Willinger R. (2011). Computation of axonal elongation in head trauma finite element simulation. J. Mech. Behav. Biomed. Mater. 4, 1905–1919 [DOI] [PubMed] [Google Scholar]
- 31. Giordano C., Cloots R.J.H., van Dommelen J.A.W., and Kleiven S. (2014). The influence of anisotropy on brain injury prediction. J. Biomech. 47, 1052–1059 [DOI] [PubMed] [Google Scholar]
- 32. Abaqus. (2016). Abaqus Online Documentation, Abaqus 2016
- 33. Ji S., Ford J.C., Greenwald, Richard M. Beckwith J.G., Paulsen K.D., Flashman L.A., and McAllister T.W. (2011). Automated subject-specific, hexahedral mesh generation via image registration. Finite Elem. Anal. Des. 47, 1178–1185 [DOI] [PMC free article] [PubMed] [Google Scholar]
- 34. Zhao W., Cai Y., Li Z., and Ji S. (2017). Injury prediction and vulnerability assessment using strain and susceptibility measures of the deep white matter. Biomech. Model. Mechanobiol. 16, 1709–1727 [DOI] [PMC free article] [PubMed] [Google Scholar]
- 35. Zhang L., Yang K.H.H., and King A.I.I. (2004). A proposed injury threshold for mild traumatic brain injury. J. Biomech. Eng. 126, 226–236 [DOI] [PubMed] [Google Scholar]
- 36. Viano D.C., Casson I.R., Pellman E.J., Zhang L., King A.I., and Yang K.H. (2005). Concussion in professional football: Brain responses by finite element analysis: Part 9. Neurosurgery 57, 891–915 [DOI] [PubMed] [Google Scholar]
- 37. Zhao W., Ford J.C., Flashman L.A., McAllister T.W., and Ji S. (2016). White matter injury susceptibility via fiber strain evaluation using whole-brain tractography. J. Neurotrauma 33, 1834–1847 [DOI] [PMC free article] [PubMed] [Google Scholar]
- 38. Rohlmann A., Boustani H.N., Bergmann G., and Zander T. (2010). A probabilistic finite element analysis of the stresses in the augmented vertebral body after vertebroplasty. Eur. Spine J. 19, 1585–1595 [DOI] [PMC free article] [PubMed] [Google Scholar]
- 39. Elkins J.M., O'Brien M.K., Stroud N.J., Pedersen D.R., Callaghan J.J., and Brown T.D. (2011). Hard-on-hard total hip impingement causes extreme contact stress concentrations. Clin. Orthop. Relat. Res. 469, 454–463 [DOI] [PMC free article] [PubMed] [Google Scholar]
- 40. Räsänen L.P., Mononen M.E., Lammentausta E., Nieminen M.T., Jurvelin J.S., and Korhonen R.K. (2016). Three dimensional patient-specific collagen architecture modulates cartilage responses in the knee joint during gait. Comput. Methods Biomech. Biomed. Engin. 19, 1225–1240 [DOI] [PubMed] [Google Scholar]
- 41. Javid S., Rezaei A., and Karami G. (2014). A micromechanical procedure for viscoelastic characterization of the axons and ECM of the brainstem. J. Mech. Behav. Biomed. Mater. 30, 290–299 [DOI] [PubMed] [Google Scholar]
- 42. Cloots R.J., van Dommelen J.A., Kleiven S., and Geers M.G.. (2012). Multi-scale mechanics of traumatic brain injury: predicting axonal strains from head loads. Biomech. Model. Mechanobiol. 12, 137–150 [DOI] [PubMed] [Google Scholar]
- 43. Miller L.E., Urban J.E., and Stitzel J.D. (2017). Validation performance comparison for finite element models of the human brain. Comput. Methods Biomech. Biomed. Engin. 20, 1273–1288 [DOI] [PMC free article] [PubMed] [Google Scholar]
- 44. Sabet A.A., Christoforou E., Zatlin B., Genin G.M., and Bayly P.V. (2008). Deformation of the human brain induced by mild angular head acceleration. J. Biomech. 41, 307–315 [DOI] [PMC free article] [PubMed] [Google Scholar]
- 45. Zhao W., Choate B., and Ji S. (2018). Material properties of the brain in injury-relevant conditions – Experiments and computational modeling. J. Mech. Behav. Biomed. Mater. 80, 222–234 [DOI] [PMC free article] [PubMed] [Google Scholar]
- 46. Ji S., Zhao W., Li Z., and McAllister T.W. (2014). Head impact accelerations for brain strain-related responses in contact sports: a model-based investigation. Biomech. Model. Mechanobiol. 13, 1121–1136 [DOI] [PMC free article] [PubMed] [Google Scholar]
- 47. Ji S., and Zhao W. (2015). A Pre-computed brain response atlas for instantaneous strain estimation in contact sports. Ann. Biomed. Eng. 43, 1877–1895 [DOI] [PMC free article] [PubMed] [Google Scholar]
- 48. Zhao W., and Ji S. (2015). Parametric investigation of regional brain strain responses via a pre-computed atlas. Presented at IRCOBI Conferonce, Lyon, pps. 208–220 [Google Scholar]
- 49. Zhao W., and Ji S. (2016). Real-time, whole-brain, temporally resolved pressure responses in translational head impact. Interface Focus 6, 20150091. [DOI] [PMC free article] [PubMed] [Google Scholar]
- 50. Ning X., Zhu Q., Lanir Y., and Margulies S.S. (2006). A transversely isotropic viscoelastic constitutive equation for brainstem undergoing finite deformation. J. Biomech. Eng. 128, 925–933 [DOI] [PubMed] [Google Scholar]
- 51. Puso M.A., and Weiss J.A. (1998). Finite element implementation of anisotropic quasi-linear viscoelasticity using a discrete spectrum approximation. J. Biomech. Eng. 120, 62–70 [DOI] [PubMed] [Google Scholar]
- 52. Meaney D.F. (2003). Relationship between structural modeling and hyperelastic material behavior: application to CNS white matter. Biomech. Model. Mechanobiol. 1, 279–293 [DOI] [PubMed] [Google Scholar]
- 53. Wright R.M., and Ramesh K.T. (2012). An axonal strain injury criterion for traumatic brain injury. Biomech. Model. Mechanobiol. 11, 245–260 [DOI] [PubMed] [Google Scholar]
- 54. Holzapfel G.A., Gasser T.C., and Ogden R.W. (2000). A new constitutive framework for arterial wall mechanics and a comparative study of material models. J. Elast. 61, 1–48 [Google Scholar]
- 55. Gasser T.C., Ogden R.W., and Holzapfel G.A. (2006). Hyperelastic modelling of arterial layers with distributed collagen fibre orientations. J. R. Soc. Interface 3, 15–35 [DOI] [PMC free article] [PubMed] [Google Scholar]
- 56. Colgan N.C., Gilchrist M.D., and Curran K.M. (2010). Applying DTI white matter orientations to finite element head models to examine diffuse TBI under high rotational accelerations. Prog. Biophys. Mol. Biol. 103, 304–309 [DOI] [PubMed] [Google Scholar]
- 57. Finan J.D., Sundaresh S.N., Elkin B.S., Mckhann Ii G.M., Morrison Iii B., McKhann G.M., and Morrison B. (2017). Regional mechanical properties of human brain tissue for computational models of traumatic brain injury. Acta Biomater. 55, 333–339 [DOI] [PubMed] [Google Scholar]
- 58. Nicolle S., Lounis M., and Willinger R. (2004). Shear properties of brain tissue over a frequency range relevant for automotive impact situations: new experimental results. Stapp Car Crash J. 48, 239–258 [DOI] [PubMed] [Google Scholar]
- 59. Hernandez F., Wu L.C., Yip M.C., Laksari K., Hoffman A.R., Lopez J.R., Grant G.A., Kleiven S., and Camarillo D.B. (2015). Six degree-of-freedom measurements of human mild traumatic brain injury. Ann. Biomed. Eng. 43, 1918–1934 [DOI] [PMC free article] [PubMed] [Google Scholar]
- 60. Shuck L.Z., and Advani S.H. (1972). Rheological response of human brain tissue in shear. J. Basic Eng. 84, 905–911 [Google Scholar]
- 61. Hardy W.N., Foster C.D., Mason M.J., Yang K.H., King A.I., and Tashman S. (2001). Investigation of head injury mechanisms using neutral density technology and high-speed biplanar x-ray. Stapp Car Crash J. 45, 337–368 [DOI] [PubMed] [Google Scholar]
- 62. Hardy W.N., Mason M.J., Foster C.D., Shah C.S., Kopacz J.M., Yang K.H., King A.I., Bishop J., Bey M., Anderst W., and Tashman S. (2007). A study of the response of the human cadaver head to impact. Stapp Car Crash J. 51, 17–80 [DOI] [PMC free article] [PubMed] [Google Scholar]
- 63. Cloots R.J., van Dommelen J.A., Nyberg T., Kleiven S., and Geers M.G. (2011). Micromechanics of diffuse axonal injury: influence of axonal orientation and anisotropy. Biomech. Model. Mechanobiol. 10, 413–22 [DOI] [PubMed] [Google Scholar]
- 64. Leemans A., Jeurissen B., Siibers J., and Jones D. (2009). ExploreDTI: a graphical tool box for processing, analyzing, and visualizing diffusion MR data. Presented at 17th Anuual Meeting of the International Society of Magnetic Resonance in Medicine, Hawaii [Google Scholar]
- 65. Gehre C., Gades H., and Wernicke P. (2009). Objective rating of signals using test and simulation responses. Presented at 21st ESV Conference, Stuttgart [Google Scholar]
- 66. Kimpara H., Nakahira Y., Iwamoto M., Miki K., Ichihara K., Kawano S., and Taguchi T. (2006). Investigation of anteroposterior head-neck responses during severe frontal impacts using a brain-spinal cord complex FE model. Stapp Car Crash J. 50, 509–544 [DOI] [PubMed] [Google Scholar]
- 67. Bradshaw D., and Morfey C. (2001). Pressure and shear response in brain injury models. Proc. 17th Int. Tech. Conf. Enhanc. Saf. Veh., 1–10 [Google Scholar]
- 68. Kleiven S., and Hardy W.N. (2002). Correlation of an FE model of the human head with local brain motion—consequences for injury prediction. Stapp Car Crash J. 46, 123–144 [DOI] [PubMed] [Google Scholar]
- 69. Zhao W., Ruan S., and Ji S. (2015). Brain pressure responses in translational head impact: a dimensional analysis and a further computational study. Biomech. Model. Mechanobiol. 14, 753–766 [DOI] [PMC free article] [PubMed] [Google Scholar]
- 70. Bain A.C., and Meaney D.F. (2000). Tissue-level thresholds for axonal damage in an experimental model of central nervous system white matter injury. J. Biomech. Eng. 122, 615–622 [DOI] [PubMed] [Google Scholar]
- 71. Donnelly B.B., Morgan R.U., and Eppinger R.R. (1983). Reliability, repeatability and reproducibility of the NHTSA side impact dummy. Stapp Car Crash J. 27, 299–310 [Google Scholar]
- 72. Hernandez F., Wu L.C., Yip M.C., Laksari K., Hoffman A.R., Lopez J.R., Grant G.A., Kleiven S., and Camarillo D.B. (2016). Erratum to: Six degree-of-freedom measurements of human mild traumatic brain injury Ann. Biomed. Eng. 44, 828–829 [DOI] [PubMed] [Google Scholar]
- 73. Mohammadipour A., and Alemi A. (2017). Micromechanical analysis of brain's diffuse axonal injury. J. Biomech. 65, 61–74 [DOI] [PubMed] [Google Scholar]
- 74. Zhu F., Gatti D.L., and Yang K.H. (2016). Nodal versus total axonal strain and the role of cholesterol in traumatic brain injury. J. Neurotrauma 33, 859–870 [DOI] [PubMed] [Google Scholar]
- 75. Giordano C., and Kleiven S. (2016). Development of an unbiased validation protocol to assess the biofidelity of finite element head models used in prediction of traumatic brain injury. Stapp Car Crash J. 60, 363–471 [DOI] [PubMed] [Google Scholar]
- 76. Sullivan S., Eucker S.A., Gabrieli D., Bradfield C., Coats B., Maltese M.R., Lee J., Smith C., and Margulies S.S. (2015). White matter tract-oriented deformation predicts traumatic axonal brain injury and reveals rotational direction-specific vulnerabilities. Biomech. Model. Mechanobiol. 14, 877–896 [DOI] [PMC free article] [PubMed] [Google Scholar]
- 77. Rowson S., Duma S.M., Beckwith J.G., Chu J.J., Greenwald R.M., Crisco J.J., Brolinson P.G., Duhaime A.-C.C., McAllister T.W., and Maerlender A.C. (2012). Rotational head kinematics in football impacts: an injury risk function for concussion. Ann. Biomed. Eng. 40, 1–13 [DOI] [PMC free article] [PubMed] [Google Scholar]
- 78. Bahrami N., Sharma D., Rosenthal S., Davenport E.M., Urban J.E., Wagner B., Jung Y., Vaughan C.G., Gioia G.A., Stitzel J.D., Whitlow C.T., and Maldjian J.A. (2017). Subconcussive head impact exposure and white matter tract changes over a single season of youth football. Radiology 281, 919–926 [DOI] [PMC free article] [PubMed] [Google Scholar]
- 79. Newman J., Shewchenko N., Welbourn E., Welbourne E., and Welbourn E. (2000). A proposed new biomechanical head injury assessment function—the maximum power index. Stapp Car Crash J. 44, 215–247 [DOI] [PubMed] [Google Scholar]
- 80. Rowson S., Brolinson G., Goforth M., Dietter D., and Duma S. (2009). Linear and angular head acceleration measurements in collegiate football. J. Biomech. Eng. 131,0 61016. [DOI] [PubMed] [Google Scholar]
- 81. Garcia-Gonzalez D., Jérusalem A., Garzon-Hernandez S., Zaera R., and Arias A. (2018). A continuum mechanics constitutive framework for transverse isotropic soft tissues. J. Mech. Phys. Solids 112, 209–224 [Google Scholar]
- 82. Velardi F., Fraternali F., and Angelillo M. (2006). Anisotropic constitutive equations and experimental tensile behavior of brain tissue. Biomech. Model. Mechanobiol. 5, 53–61 [DOI] [PubMed] [Google Scholar]
- 83. Chatelin S., Deck C., and Willinger R. (2013). An anisotropic viscous hyperelastic constitutive law for brain material finite-element modeling. J. Biorheol. 27, 26–37 [Google Scholar]
- 84. Garimella H.T., and Kraft R.H. (2016). Modeling the mechanics of axonal fiber tracts using the embedded finite element method. Int. J. Numer. Method. Biomed. Eng. 33, 26–35 [DOI] [PubMed] [Google Scholar]
- 85. Ji S., Ghadyani H., Bolander R.P., Beckwith J.G., Ford J.C., McAllister T.W., Flashman L.A., Paulsen K.D., Ernstrom K., Jain S., Raman R., Zhang L., and Greenwald R.M. (2014). Parametric comparisons of intracranial mechanical responses from three validated finite element models of the human head. Ann. Biomed. Eng. 42, 11–24 [DOI] [PMC free article] [PubMed] [Google Scholar]
Associated Data
This section collects any data citations, data availability statements, or supplementary materials included in this article.