Abstract
Objectives
The purpose of this study was to determine the reliability of Grayscale Median (GSM) measurements across different ultrasound systems and effects of gain on GSM values.
Methods
Two vessels in a grayscale vascular phantom were imaged with 7 ultrasound systems at 3 gain settings. Two human subjects were imaged at 3 gain settings. Each image was normalized, standardized, and segmented by expert and novice readers using grayscale analysis software. Concordance correlation coefficient (CCC) assessed agreement of GSM values for each system across gain settings, vessels, and between readers. Intra-class correlation coefficient (ICC) assessed system-level reader concordance across gain settings and vessels. A general linear mixed model for repeated measures was used to assess within- and between-system mean GSM values.
Results
GSM measurements performed on images from the same ultrasound system yielded excellent CCC[95% confidence intervals]: 0.85[0.75, 0.92]–0.96[0.92, 0.98]. ICC per system was 0.94–0.98 for expert and 0.85–0.95 for novice reader. Gain adjustments above and below an optimal setting contributed to significantly different intra-system GSM values on 4/7 systems in near and 5/7 systems in far zone (p<0.05). Inter-system GSM values differed on 5/7 systems (p<0.05). Images from human subjects demonstrated differences in GSM values at OGV+/−10 dB/% gain values.
Conclusions
GSM measurements are highly reproducible when obtained from the same ultrasound system with similar gain settings. GSM values differ significantly across gain values and between systems. Researchers should consider the impact ultrasound system and gain settings have on GSM values when working to minimize system- and operator-dependent factors.
Keywords: Ultrasound, Vascular Phantom, Grayscale median value, Gain
Introduction
Quantitative grayscale ultrasound can be used to quantify echogenicity and to characterize tissue in anatomical structures.[1–9] Increasingly, quantitative grayscale ultrasound and textural features extraction are being used to assess characteristics associated with pre-clinical arterial injury and risk of cardiovascular disease (CVD), including stroke.[4–7] For example, several authors have described an association between low grayscale median (GSM) values with plaques that are at high risk of rupture and have a large lipid and/or thrombotic component.[10–14] Further, echolucent (darker) common carotid artery walls have been associated with CVD risk factors such as inflammation, hyperlipidemia, obesity, and circulating measures of oxidative stress; they also predict adverse CVD events.[4, 5, 15–17]
Within studies, GSM and other textural features have been measured reproducibly using dedicated software analysis programs.[9, 11, 18, 19] Computer-assisted methods for plaque classification can reduce GSM variability using image normalization procedures, which linearly scale grayscale values in the image between two different reference points available in every subject.[7, 11, 18, 20, 21] However, even after employing normalization, there is a wide range (across studies) of GSM values that represent, for example, the lowest echogenicity value/quintile threshold that is associated with an echolucent arterial wall and/or vulnerable plaque that may rupture or release emboli and thereby contribute to an adverse cerebrovascular event.[4, 5, 8, 10, 11, 15, 18, 19, 22–35] Although the GSM is a valid research tool, this range limits the transition of the GSM measurement into widespread clinical use.
These variations may be due to insufficient compensation for differences in hardware and software used for image acquisition and analysis used in textural features extraction techniques.[2, 32] Changes in the instrumentation settings, such as dynamic range, time gain compensation (TGC), overall gain, post-processing map, and imaging frequency, a sonographer selects for imaging can result in the same tissue appearing brighter or darker and thereby yield different GSM values.[3, 36–38] Some studies that have used grayscale image processing methods, such as normalization, claim to mitigate effects on the GSM value due to aspects of the imaging system, such as the transducer used for image acquisition [18, 20, 21] Additionally, effects on the GSM due to varying gain values, which are readily manipulated by a sonographer during an imaging exam, have been shown to be reduced by normalization in studies with human data.[18, 20]
Based on these discrepancies, we pursued a standardized image acquisition and processing approach where ultrasound imaging system and gain were manipulated during the imaging of a vascular phantom. Ultrasound system and receiver gain are two readily adjustable factors that may still affect GSM values. Therefore, the aims of this study were to 1) determine the reliability of GSM measurements performed on different ultrasound systems and 2) determine the effects of gain settings on GSM values using a grayscale vascular phantom and a plaque analysis software that allows for image normalization and standardization.
Materials and Methods
Vascular Phantom
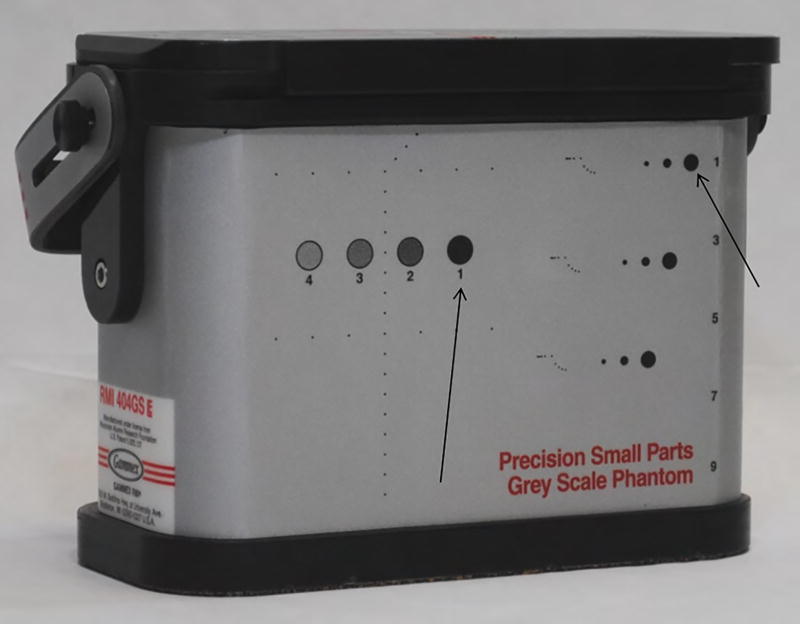
B-mode ultrasound images of a commercially available water-based gelatin phantom (Gammex Precision Small Parts Grey Scale Phantom, 404GS, Middleton, WI, U.S.A.) with reproducible vessel geometry and tissue-mimicking background material (speed of sound = 1540 ± 10 m/s; attenuation coefficient = 0.7 ± 0.01 dB/cm-MHz; Figure 1) were obtained at multiple gain settings with 6 clinical ultrasound platforms (7 ultrasound systems total). The imaging protocol described below was performed by a single sonographer on each ultrasound system five times for a cumulative total of 35 scanning sessions performed over a period of two months. The scanning sessions for each ultrasound system were separated by at least 24 hours to ensure independent selection of the optimally gained image during each scan session.
Figure 1.
Gammex small parts grey scale phantom used in image acquisition. Arrows point to the two cystic structures imaged as the simulated near zone (cystic target) and far zone (grayscale target) vessels. Ultrasound images obtained from these vessels are shown in Figure 2.
Ultrasound Systems
The 7 ultrasound systems, transducer, transmission frequency, imaging preset, dynamic range setting, and grayscale map used for image acquisition are described in Table 1. Ultrasound systems were optimized to minimize differences in GSM values using techniques previously reported.[7, 11, 13] The time gain compensation (TGC) potentiometers were set in the middle for each system to standardize image acquisition and ensure uniform receiver amplification with depth through the simulated vessel.[7, 11, 13] The most linear grayscale map, as obtained from the ultrasound system manufacturers, was selected (Table 1, systems A–F) to optimize the results of rescaling grayscale values accomplished by image normalization. The clinical carotid grayscale map was chosen for system G (Table 1). The highest dynamic range for each ultrasound system was set to maximize the range of echo signals appearing as shades of gray on the ultrasound image monitor and kept constant as part of the system preset.[7, 11, 13] The transmit focus and gain settings were adjusted manually by the sonographer at each scanning session.
Table 1.
Ultrasound System Settings for Imaging Near and Far Zone Vessels in a Grayscale Small Parts Phantom.
| System Identification Code |
Transducer & Transmission Frequency (MHz) |
Dynamic Range (dB) or Compression |
Most Linear Grayscale Map(*) |
MI (Near & Far) |
Mean Optimum Gain Value per Vessel Near (Range), Far (Range) |
|---|---|---|---|---|---|
| A | L14-5/38 | 145 | 6 | <0.80 | 66.8(58–77), 71.2(58–84) |
| Ultrasonix SonicTOUCH (BK Ultrasound, Peabody, MA, USA) | H 10.0 | <0.75 | |||
| B | 9L4 | 90 | A | 0.90 | 0.0(0-0), 0.0(0-0) |
| Acuson S2000 (Siemens Medical Solutions, Malvern, PA, USA) | H 9.0 | 0.80 | |||
| C | L10-5 | 70 | L | 0.50 | 8.8(8–10), 15.2(12–18) |
| Siemens CV 70 (Siemens Medical Solutions, Malvern, PA, USA) | 10.0 | 0.50 | |||
| D | 8L5 | 100 | 4 | 0.80 | 8.0(4–14), 8.6(5–13) |
| Acuson Sequoia (Siemens Medical Solutions, Malvern, PA, USA) | 8.0 | 0.59 | |||
| E | L9-3 | 70 | 5 | 0.70 | 47.6(45–50), 48.6(46–50) |
| Philips iE33 (Philips Healthcare, Andover, MA, USA) | Gen | 0.90 | |||
| F | 9L4 | 90 | A | 1.3 | 0.0(0-0), 0.0(0-0) |
| Acuson S2000 (Siemens Medical Solutions, Malvern, PA, USA) | H 8.0 | 1.1 | |||
| G | 9L | 102 | C | 1.2 | 3.2(2–4), 3.2(2–4) |
| GE VIVID E9 (GE Healthcare, Waukesha, WI, USA) | 4.0/8.0 | 1.2 |
MI = mechanical index
H = harmonic
System G clinical carotid grayscale map.
During each ultrasound system scanning session, 10 images were acquired by an expert sonographer. Images were acquired by placing the linear transducer face perpendicular to the phantom’s longest side at the surface of the phantom to scan the simulated vessels lengthwise. Ultrasound gel (Aquasonic, Parker Laboratories, Inc. Fairfield, New Jersey, U.S.A.) was used to acoustically couple the transducer face to the phantom surface.
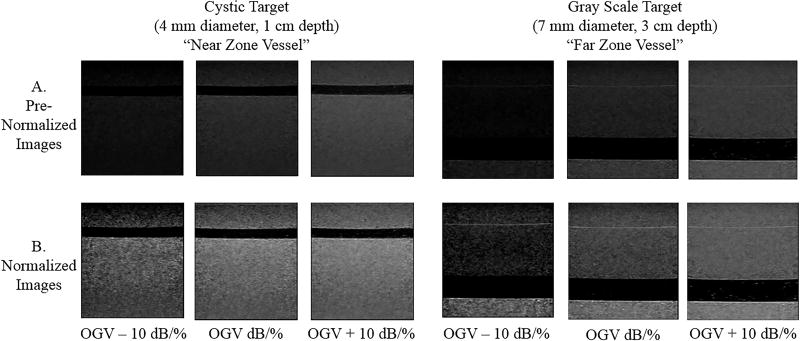
The first image acquired was from a near zone fluid-filled tube that simulates a blood vessel (cystic target, diameter 4.00 mm) at a depth of 1.00 centimeters (cm) below the imaging surface. The focal zone was set to the center of the simulated vessel, and the overall gain was optimized to the “optimum gain value” (OGV). The OGV was defined as the gain setting where the fluid in the vessel (simulated blood) was predominantly anechoic, with just a few echoes in it, and the borders of the simulated vessel (simulated adventitia) were white.[11, 20, 26, 27, 40] After obtaining the OGV near zone image, the sonographer adjusted the gain by 10 gain units (decibels [dB] or percent [%]), according to the ultrasound system designation for gain. Hereafter, this will be designated as 10 dB/%. The resulting image was acquired and labeled as OGV + 10. This process was repeated for gain settings at OGV + 20 dB/%, OGV – 10 dB/%, and OGV – 20 dB/% (Figure 2) as in studies using similar gain ranges to study the effects of normalization and/or calibration on GSM values.[20, 36, 38, 39] In some instances, the system could only be adjusted −14 dB/% from the OGV, and thus an image could not be obtained at a true OGV − 20 dB/%. After imaging the near zone vessel, the imaging protocol was repeated for a large diameter simulated vessel (grayscale target, diameter 7.00 mm) at a depth of 3.00 cm designated as the far zone vessel.
Figure 2.
Images in row A show the near and far zone vessels at various gains before normalization. Images in row B show the same vessels after normalization. After normalization, grayscale variations across differently gained images appear more uniform.
All images were saved in DICOM format and uploaded to a dedicated research server. Image-viewing software (Access Point, Freeland Systems, Alpharetta, GA, U.S.A.) was used to convert DICOM images to BITMAP files that were used for grayscale analysis.
Human Subject Imaging Methods
Two subjects enrolled in the Structural Stability of Carotid Plaque and Symptomatology Study (R01 NS064034 funded by the National Institutes of Health, Bethesda, MD, USA) were imaged with a Siemens Acuson S2000 (Siemens Medical Solutions USA, Inc., Malvern, PA, U.S.A.). A 9L4 transducer and the cardiovascular (CV) preset (tissue harmonic imaging [THI] on, H8.00 MHz frequency, dynamic range 65, advanced spatial compounding [ASC] 5, dynamic tissue contrast enhancement technology [DTCE] M, grayscale map E, space time 3) were used. Images were acquired at three different gain settings (OGV dB, OGV − 10 dB and OGV + 10 dB). The University of Wisconsin Health Science Institutional Review Board approved this study, and all subjects provided informed consent.
Methods for GSM measurement discussed below were used to obtain the GSM value at each gain setting. In Subject 1, a focal plaque in the left common carotid artery was segmented and measured in the plaque texture analysis software. In Subject 2, the distal far wall of the left common carotid artery was segmented and measured.
Measurement of Phantom GSM
GSM was measured with plaque texture analysis software (LifeQ Medical, Cyprus). Both an expert and a novice reader performed the procedures described below to extract GSM values for reliability calculations. The image processing sessions by each reader were separated by at least 24 hours to avoid recall bias and ensure independent selection of the reference points for normalization and selection of the region of interest, as described below, for each image. Measurements from both readers were used for Concordance Correlation Coefficient (CCC) calculations, as described below. Only the expert reader measurements were utilized to assess inter-system mean GSM comparisons and evaluate effects of gain settings on intra-system mean GSM values. Images were normalized by manually selecting the blackest area of the simulated fluid filled vessel and the brightest area of the simulated vessel wall as reference points for blood and adventitia, which are anatomical reference points available in every human patient. The reference points for blood and the adventitia were assigned grayscale values of 0 and 190, respectively.[7] With this normalization method, the gray values of all pixels change according to this new linear scale such that texture features of the images can be extracted and compared.[20, 26, 40] Using a reference value of 190 for adventitia allows structures brighter than the adventitia to be displayed with a grayscale value greater than 190 (i.e., up to a grayscale value of 255).[41]
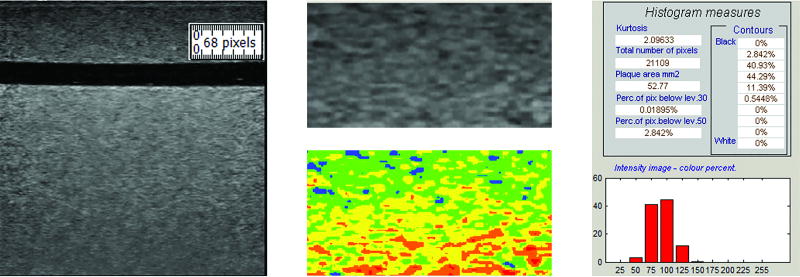
After images were scaled linearly between these two reference points, they were standardized to a pixel density of 20.00 pixels per millimeter (mm). The size of the measured area was standardized by using an online ruler tool (https://github.com/andrijac/ruler#newfeatures), set to a size of 1.00 cm in length by 0.50 cm in height. A rectangle was placed just above the simulated vessel and to the extreme right side of the image and its outline traced manually using the plaque texture analysis software, as shown in Figure 3. The GSM value was calculated by the software as the median value of all pixel grayscale values within the traced area (Figures 3 and 4). The same process was repeated for all far zone vessel images by placing the on-screen rectangle just above the simulated far zone vessel and to the extreme right of the image.
Figure 3.
The region of interest (ROI) traced for grayscale analysis is identified by the ruler tool (left). The resulting segmentation is shown in grayscale and in color (middle). Colors correspond to the following grayscale values: black – 0 to 25; blue – 26 to 50; green – 51 to 75; yellow – 76 to 100; orange – 101 to 125; and, red – 126 to 255. Grayscale median value and grayscale value histogram for this segmentation is also shown (right). The GSM for this ROI is 78.90.
Figure 4.
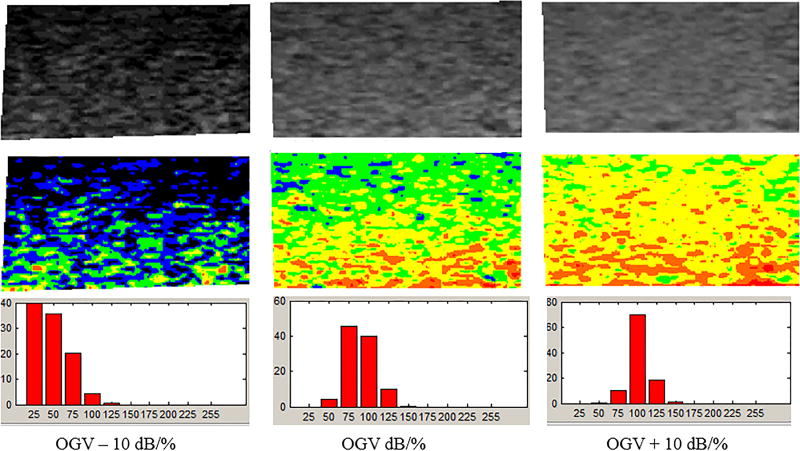
The output from the grayscale analysis software shows segmented grayscale images in the top row and colorized images better depicting grayscale variations in the bottom row. With this software, the colors correspond to the following grayscale values: black – 0 to 25; blue – 26 to 50; green – 51 to 75; yellow – 76 to 100; orange – 101 to 125; and, red – 126 to 255...GSM for OGV – 10 dB/%, OGV dB/%, and OGV + 10 dB/% are 35.45, 75.53, and 90.97.
Statistical Analysis
Statistical analyses were performed using SAS software Version 9.4 (SAS Institute, Cary NC).[42] Agreement between the 2 readers was measured using Lin’s concordance correlation coefficient (ρ CCC) for two observers based on their variances (σ1 and σ2), covariance (σ12), and means (μ1 and μ2), as shown in Equation (1).
| (1) |
An extension of Lin’s coefficient was used in this study to measure the agreement between two observers over three repeated measurements.[43, 44]
Within-observer agreement over the repeated assessments was measured using intra-class correlation coefficients (ICCs). A series of random coefficients general linear mixed models for repeated measures was used to assess both intra- and inter-system differences for OGV − 10 dB/%, OGV dB/%, and OGV + 10 dB/% mean GSM values. General linear mixed effects models for repeated measures combine the theory of general linear models and linear mixed effects models for repeated measures data analysis.[46] The random intercepts model was used as shown in Equation (2).
| (2) |
In this model, GSAij denotes the average OGV values over all images for the ith system and jth measurement, and timeij refers to the time of measurement by each reader for the ith system and jth measurement. The beta terms are explanatory variables that represent fixed effects. The variance (ν) term is assumed to be distributed as Ν(0,σν2) and the error (ε) term is assumed to be distributed as Ν(0,σ2). The parameter σν2 refers to the variance in the population distribution. The fourth term of Equation (2) includes an interaction between ultrasound system and time of acquisition and measurement. This interaction is not statistically significant in the current study.
In order to protect against Type I error, we used Sidak adjustment [1 − (1 − pr)R] where pr are the unadjusted p-values, and R is the number of tests performed. Sidak adjustment provides a slightly less conservative adjustment than Bonferroni adjustment.[46]
Results
Images
Images at OGV − 20 dB/% and OGV + 20 dB/% were eliminated from analysis since not all systems could acquire diagnostic images at these extreme gain settings. Each reader independently normalized, standardized, and segmented each image. All 210 images were measured in triplicate by each reader (n = 630 measurements per reader * 2 readers = 1,260 GSM measurements). The mean (standard deviation) pre-normalization grayscale values for the region of interest at OGV ranged from 60.13 (13.22) to 106.72 (33.77). The range of pre-normalization mean (standard deviation) simulated blood at OGV was 0.13 (0.73) to 3.73 (4.45).
GSM Measurement Reliability
The within-ultrasound system CCC range (95% CI) was 0.85 (0.75, 0.92) – 0.96 (0.92, 0.98), demonstrating excellent intra-system reliability for five acquisition time points, by two readers reading each image in triplicate (see Table 2). The ICC per system, across 3 GSM measurement times for each reader, also was excellent, with the expert reader overall ICC 0.94 to 0.98 and ICC range 0.85 to 0.95 for the novice reader (see Table 2).
Table 2.
Concordance Correlation Coefficients (CCC) and Within-Reader Reliability Intra-Class Correlation Coefficients (ICC) per System and Averaged Across 3 GSM Measurement Sessions.
| System Identification Code |
CCC (95% CI) | ICC – Reader 1 | ICC – Reader 2 |
|---|---|---|---|
| A | 0.853 (0.750, 0.915) | 0.941 | 0.878 |
| B | 0.956 (0.922, 0.975) | 0.976 | 0.941 |
| C | 0.893 (0.834, 0.932) | 0.959 | 0.853 |
| D | 0.876 (0.778, 0.932) | 0.922 | 0.847 |
| E | 0.941 (0.887, 0.969) | 0.952 | 0.944 |
| F | 0.936 (0.894, 0.962) | 0.941 | 0.946 |
| G | 0.938 (0.894, 0.964) | 0.945 | 0.938 |
Intra-System GSM Values
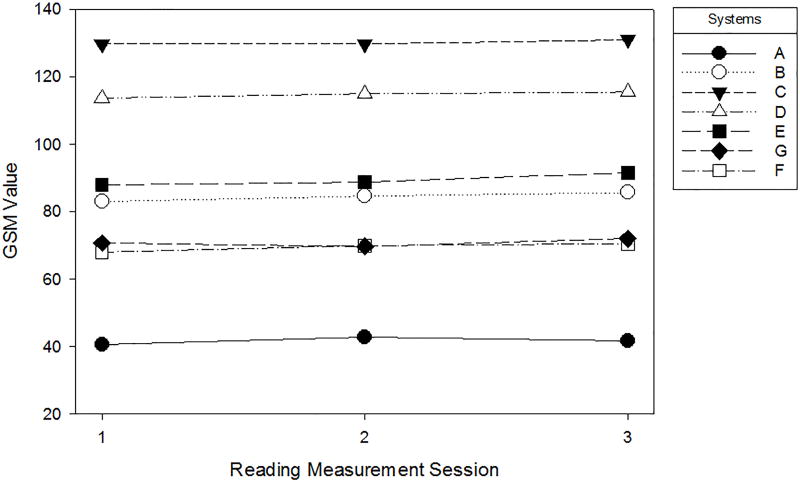
Over the 5 scanning sessions and three measurement time periods, the mean GSM remained stable within each ultrasound system (intra-system). Mean GSM values derived from averaging all GSM measures from the OGV − 10 dB/%, OGV dB/% and OGV + 10 dB/% over the scanning sessions for each system and 3 reading measurement time periods ranged from 41.63 (System A) to 130.17 (System C) (see Figure 5).
Figure 5.
Mean GSM value plotted for each reading measurement session. GSM values within ultrasound system and across reading sessions are relatively stable.
Inter-System GSM Values
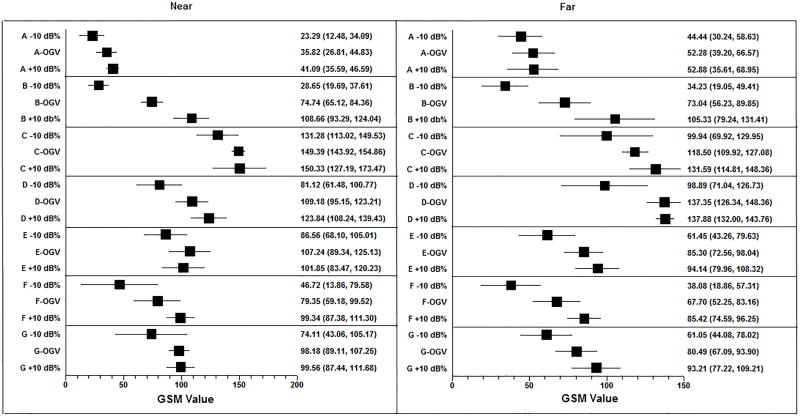
The mean GSM value per ultrasound system is reported in Table 3. System B was designated as the reference ultrasound system because it had the highest CCC, 0.956 (0.922, 0.975). Compared to the reference system, 5 ultrasound systems had significantly different GSM values (p<0.05). Unless otherwise noted, p-values reported are Sidak-adjusted p-values. The only system that did not have significantly different GSM values was System F. System F was the same imaging system and transducer (manufacturer and model) as System B but was located in a different laboratory and utilized a slightly different preset (see Table 2) for carotid imaging. When evaluating GSM by near zone and far zone, Systems E, F, and G did not have statistically significantly different mean GSM values from the reference system (all p>0.05) but did differ significantly from the average of all measurements (OGV − 10 dB/%, OGV dB/%, OGV + 10 dB/%). This reference system had the widest variation in gain values between OGV − 10 dB/% and OGV + 10 dB/% (see Forest Plot, Figure 6). While System B and System F are the same system, the vascular presets were slightly different. The System B preset was centered at a higher imaging frequency, which resulted in the wider spread of gain values, especially in the far field.
Table 3.
Mean GSM Values per System for Far Zone Vessel, Near Zone Vessel, and both Vessels (“Overall”). Mean difference, paired t-test, and raw and Sidak-adjusted p-values compare system mean GSM values against referent system. Referent system (System B) was chosen because it had the highest concordance correlation coefficient (CCC).
| Vessel | System Mean GSM (95% CI) |
Referent System Mean GSM (95% CI) |
Mean Difference (95% CI) |
Test statistics (paired t- test) |
Raw p- values Sidak- adjusted p- values |
|---|---|---|---|---|---|
| A | B | ||||
|
| |||||
| Far Zone | 41.00 (35.91, 46.09) | 82.42 (74.80, 90.05) | −41.42 (−51.05, −31.80) | −9.23 (df=14) | <0.001, <0.001 |
| Near Zone | 42.27 (37.92, 46.62) | 86.44 (79.19, 93.70) | −44.17 (−51.58, −36.77) | −12.70 (df=14) | <0.001, <0.001 |
| Overall | 41.63 (38.49, 44.78) | 70.78 (63.68, 77.88) | −29.14 (−36.40, −21.88) | −8.20 (df=29) | <0.001, <0.001 |
|
| |||||
| C | B | ||||
|
| |||||
| Far Zone | 128.97 (122.79, 135.16) | 82.42 (74.80, 90.05) | 46.54 (37.16, 55.93) | 10.64 (df=14) | <0.001, <0.001 |
| Near Zone | 131.37 (124.28, 138.45) | 86.44 (79.19, 93.70) | 44.92 (34.52, 55.32) | 9.26 (df=14) | <0.001, <0.001 |
| Overall | 130.17 (125.74, 134.60) | 70.78 (63.68, 77.88) | 59.39 (52.16, 66.62) | 16.80 (df=29) | <0.001, <0.001 |
|
| |||||
| D | B | ||||
|
| |||||
| Far Zone | 112.79 (104.92,120.66) | 82.42 (74.80, 90.05) | 30.36 (19.21, 41.51) | 5.84 (df=14) | <0.001, <0.001 |
| Near Zone | 116.63 (110.73, 122.53) | 86.44 (79.19, 93.70) | 30.18 (21.96, 38.40) | 7.87 (df=14) | <0.001, <0.001 |
| Overall | 114.71 (110.04, 119.38) | 70.78 (63.68, 77.88) | 43.93 (35.54, 52.32) | 10.71 (df=29) | <0.001, <0.001 |
|
| |||||
| E | B | ||||
|
| |||||
| Far Zone | 88.19 (81.80, 94.59) | 82.42 (74.80, 90.05) | 5.76 (−2.61, 14.15) | 1.47 (df=14) | 0.16, 0.95 |
| Near Zone | 90.65 (83.11, 98.18) | 86.44 (79.19, 93.70) | 4.20 (−7.88, 16.29) | 0.745 (df=14) | 0.47, 0.99 |
| Overall | 89.42 (84.77, 94.07) | 70.78 (63.68, 77.88) | 18.64 (10.16, 27.12) | 4.49 (df=29) | <0.001, <0.001 |
|
| |||||
| F | B | ||||
|
| |||||
| Far Zone | 68.35 (58.88, 77.82) | 82.42 (74.80, 90.05) | −14.07 (−25.99, −2.15) | −2.53 (df=14) | 0.02, 0.34 |
| Near Zone | 70.52 (59.90, 81.14) | 86.44 (79.19, 93.70) | −15.92 (−29.78, −2.05) | −2.46 (df=14) | 0.03, 0.39 |
| Overall | 69.44 (62.76, 76.12) | 70.78 (63.68, 77.88) | −1.34 (−10.76, 8.08) | −0.290 (df=29) | 0.77, 0.99 |
|
| |||||
| G | B | ||||
|
| |||||
| Far Zone | 69.50 (56.85, 82.14) | 82.42 (74.80, 90.05) | −12.92 (−27.05, 1.20) | −1.96 (df=14) | 0.07, 0.72 |
| Near Zone | 72.05 (63.76, 80.35) | 86.44 (79.19, 93.70) | −14.39 (−22.51, −6.27) | −3.80 (df=14) | 0.002, 0.03 |
| Overall | 84.43 (79.45, 89.42) | 70.78 (63.68, 77.88) | 13.65 (6.01, 21.29) | 3.65 (df=29) | 0.001, 0.02 |
p-values appearing in bold are significant (p<0.05).
Figure 6.
Forest plot demonstrating mean GSM values and 95% CI for each system and across gain settings (OGV − 10 dB/%, OGV dB/%, OGV + 10 dB/%).
Effects of Gain on Grayscale Median Measurement Value
The intra-system ranges of mean GSM values for OGV − 10 dB/%, OGV dB/%, and OGV + 10 dB/% in the near and far zones are presented in Tables 4 and 5 (note OGV ranges as determined by the sonographer are very similar). In 4/7 ultrasound systems (A, B, D, F), the near zone intra-ultrasound system grayscale values at OGV − 10 dB/%, OGV dB/% and OGV + 10 dB/% were significantly different (p<0.05). In 5/7 ultrasound systems (B, D, E, F, G), the far zone intra-ultrasound system grayscale values at the OGV − 10 dB/%, OGV dB/% and OGV + 10 dB/% were significantly different (p<0.05). The spread of GSM values in System A is smaller in both the near and far zone relative to the other systems. This may be due to the units of gain. The units of gain on System A are expressed as a percentage change, which is smaller than the equivalent numerical change in decibels.
Table 4.
Differences in Near Zone Mean GSM values at three gain settings: OGV + 10 dB/%, OGV − 10 dB/% and OGV dB/%.
| System Identification Code |
OGV + 10 Mean (SD) |
OGV − 10 Mean (SD) |
OGV Mean (SD) |
F- Statistic (df) |
p-value | Sidak- adjusted p-values |
|---|---|---|---|---|---|---|
| A | 41.09 (4.43) | 23.29 (8.70) | 35.82 (7.25) | 8.48 (2, 14) | 0.005 | 0.04 |
| B | 108.66 (12.38) | 28.65 (7.21) | 74.74 (7.74) | 91.13 (2, 14) | <0.001 | <0.001 |
| C | 150.33 (18.63) | 131.28 (14.70) | 149.39 (4.40) | 2.97 (2, 14) | 0.089 | 0.48 |
| D | 123.84 (12.56) | 81.12 (15.82) | 109.18 (11.29) | 13.19 (2, 14) | <0.001 | <0.001 |
| E | 101.85 (14.80) | 86.56 (14.86) | 107.24 (14.41) | 2.67 (2, 14) | 0.110 | 0.56 |
| F | 99.34 (9.63) | 46.72 (26.46) | 79.35 (16.24) | 10.01 (2, 14) | 0.003 | 0.02 |
| G | 99.56 (9.76) | 74.11 (25.00) | 98.18 (7.30) | 3.97 (2, 14) | 0.047 | 0.29 |
Significant differences in GSM values are in bold (p<0.05).
Table 5.
Differences in Far Zone Mean GSM values at three gain settings: OGV + 10 dB/%, OGV − 10 dB/% and OGV dB/%.
| System Identification Code |
OGV + 10 Mean (SD) |
OGV − 10 Mean (SD) |
OGV Mean (SD) |
F- Statistic (df) |
p-value | Sidak- adjusted p-values |
|---|---|---|---|---|---|---|
| A | 52.88 (11.01) | 44.44 (11.43) | 52.28 (13.42) | 0.77 (2, 14) | 0.484 | 0.99 |
| B | 105.33 (21.00) | 34.23 (12.22) | 73.04 (13.54) | 24.55 (2, 14) | <0.001 | <0.001 |
| C | 131.59 (13.51) | 99.94 (24.17) | 118.50 (6.91) | 4.66 (2, 14) | 0.031 | 0.20 |
| D | 137.88 (4.73) | 98.89 (22.42) | 137.35 (8.86) | 12.42 (2, 14) | 0.001 | 0.01 |
| E | 94.14 (11.41) | 61.45 (14.64) | 85.30 (10.25) | 9.53 (2, 14) | 0.003 | 0.02 |
| F | 85.42 (8.71) | 38.08 (15.48) | 67.70 (12.44) | 18.23 (2, 14) | <0.001 | <0.001 |
| G | 93.21 (12.87) | 61.05 (13.66) | 80.49 (10.79) | 8.39 (2, 14) | 0.005 | 0.03 |
Significant differences in GSM values are in bold (p<0.05).
Human Subject Imaging
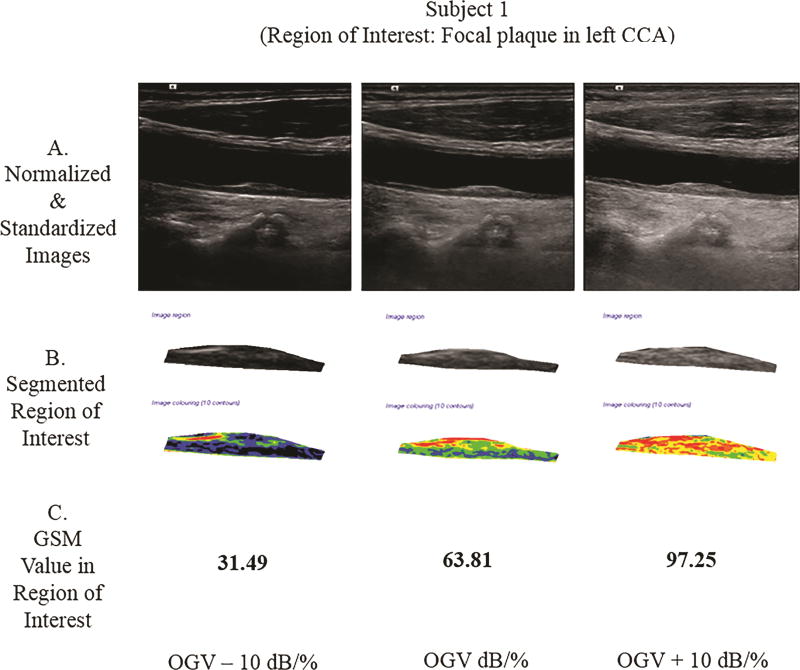
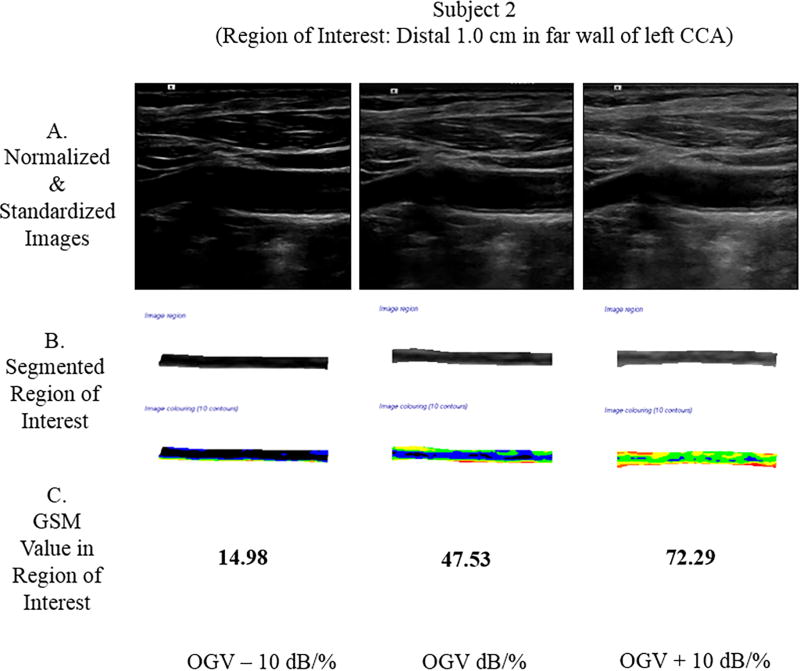
Two subjects were scanned, and the GSM value was extracted from the region of interest (ROI). Subject 1 had a focal plaque in the mid-left common carotid artery (CCA). At the OGV dB setting, the GSM value for the plaque was 63.81; at the OGV − 10 dB setting, the GSM was 31.49; and, at the OGV + 10 dB setting, the GSM was 97.25. In Subject 2, the ROI was the distal 1.0 cm of the far wall of the left CCA. At the OGV dB setting, the GSM value for the far wall was 47.53; at the OGV − 10 dB setting, the GSM was 14.98; and, at the OGV + 10 dB setting, the GSM value was 72.29 (see Figure 7). Differences in GSM values in the regions of interest were noted for both subjects in images obtained at different gain settings (OGV dB versus OGV + dB and OGV – 10 dB).
Figure 7.
Grayscale analysis results for the 2 human participants obtained across 3 different gain values are shown below. For each participant, row A shows the normalized and standardized images used. Images in row B show the segmented ROIs in grayscale and as a colorized output from the plaque analysis software. Row C provides the GSM values for these ROIs. Note that as the gain value increases, the GSM value likewise increases, which agrees with the grayscale phantom results for a single ultrasound imaging system. CCA indicates common carotid artery.
Discussion
This study demonstrated that GSM measurements are reliable when using the same ultrasound system and OGV setting. However, the ultrasound systems used for image acquisition and the gain settings at OGV ± 10 dB/% influenced the measured GSM value - even when images were normalized using previously described techniques,[7, 11, 13, 22] making it difficult to compare GSM values obtained from different ultrasound systems. Since the GSM, an echolucency measure associated with CVD risk factors and events,[4, 8 11–13] is influenced by these factors, among others, researchers and clinicians need to be aware of the equipment and instrumentation settings they choose to utilize. Our findings suggest that ultrasound grayscale studies should 1) utilize a standardized preset that is not altered throughout the course of a study, 2) engage in phantom assessments throughout the study to assure stable image quality, and 3) incorporate reproducibility measures to ensure that machine settings remain constant.
This study also demonstrated differences in mean GSM values between ultrasound systems and gain settings on the same ultrasound system, even after using normalization techniques similar to those previously reported.[7, 11, 13, 18] Again, researchers and clinicians need to be aware of the equipment and instrumentation settings they choose to utilize. Further, researchers need to continue to work to minimize variability in GSM measurement of carotid artery plaque and the arterial wall through both phantom and patient studies. Normalization[18–20] and calibration[38] are two techniques that have been used to reduce variability in grayscale values due to instrumentation and gain settings. The normalization technique, which is a linear scaling between reference points, was employed in the current work. A calibrated backscatter technique has been applied to reduce mean grayscale variability in musculoskeletal (MSK) ultrasound.[3, 36, 37] In this method, statistically significant variability due to system and acquisition settings was successfully removed by normalizing grayscale values to a conversion factor applied in the linear range of a grayscale value-gain curve acquired using a reference phantom. This method also used a subtraction term to try and eliminate system and settings effects. In MSK work, calibrated backscatter values demonstrated less variability across ultrasound systems and imaging presets than mean grayscale values; however, effects due to different transducers (namely, center operating frequency) were not eliminated. The calibrated backscatter may be an alternative method for standardization to reduce variability in grayscale images of arteries. Future work will apply a similar method to assess the validity of this approach for grayscale phantoms and carotid plaques. Alternative approaches for tissue characterization include the Reference Phantom Method[47, 48] and others, which require access to the radiofrequency (RF) ultrasound signal collected during an ultrasound examination. While this technique and subsequent advances in signal processing have shown promise in assessing liver tumors[49], monitoring liver ablation[50], kidney disease[51] and studying carotid plaque[52, 53], imaging centers may not have access to equipment and personnel required to extract and analyze these RF signals.
The current work was performed on a grayscale small parts phantom with homogenous tissue-mimicking grayscale properties. A tissue-mimicking phantom was chosen to ensure that the same structure and imaging plane were acquired during each imaging session so that GSM comparisons could be made across systems. With a phantom, the simulated vascular structures are located at the exact same depth in every image and these structures can only be imaged from one perpendicular plane at the phantom surface. This phantom did not incorporate a representation of a carotid plaque and did not represent the heterogeneity of most plaques. The simulated fluid and rigid tube walls in the phantom are not blood and adventitia, respectively, and there is no intima-media in the simulated vessel. Thus, even though the phantom used is a tissue-mimicking phantom, the GSM values obtained on these simulated structures may not be representative of carotid plaque tissue. Similar results were observed in human data from two subjects where GSM values changed in the same direction as the adjustment in gain value (see Figure 7).
Fluid in a vascular phantom can desiccate non-uniformly. Ideally, the integrity of the phantom should be tested throughout the course of the experiment; however, such desiccation processes, for a well-maintained phantom, occur over the timescale of years. The measurements acquired during the current study were taken over a two-month period; thus, the authors believe that the desiccation phenomenon is not of significance in this work. The range of gain settings was selected a priori to represent extremes of what would be a diagnostic image. Ideally, gain should be incremented over 1 dB/% intervals to more precisely determine the influence of gain on GSM values.
This study demonstrated that the GSM values, measured from images of a grayscale small parts phantom, are influenced markedly by ultrasound instrumentation. The methods provided in the current work can be adapted by investigators wishing to quantify the reliability and variability in their own studies using textural features for analysis of carotid plaque and the arterial wall. GSM measurements are reliable when obtained from the same ultrasound system but differ within systems as gain changes and between systems. Because this textural feature has been shown to have merit for risk stratification of carotid atherosclerotic disease and in the detection of vulnerable plaque, researchers and clinicians should work to minimize variability in GSM values resulting from ultrasound system and image acquisition settings, in particular, gain. Suggestions include: 1) utilizing a standardized preset that is not altered throughout the course of a study, 2) engaging in phantom assessments throughout the study to assure stable image quality, and 3) incorporating reproducibility measures to ensure that machine settings remain constant over the course of an imaging session or study.
Acknowledgments
Sources of Funding: This investigation was supported by the National Institutes of Health under Ruth L. Kirschstein National Research Service Award T32 HL 007936 from the National Heart Lung and Blood Institute to the University of Wisconsin-Madison Cardiovascular Research Center and the National Institutes of Health grant R01 NS064034.
Footnotes
Presentations at Meetings: This work was presented as an oral abstract at the 2017 American Institute of Ultrasound in Medicine Annual Convention; March 25–29; Lake Buena Vista, Florida.
Disclosures: C.N. Steffel – None. R. Brown – None. T. Varghese – Other; Siemens Ultrasound, Research Agreement for use of Ultrasound Research Interface. No financial benefit. C.E. Korcarz – None. J.H. Stein – Other; Wisconsin Alumni Research Foundation-patent related to carotid wall thickness and vascular age. S.M. Wilbrand – None. R.J. Dempsey – None. C.C. Mitchell – Other; Davies Publishing Inc, authorship echocardiography textbook. Elsevier, Wolters-Kluwer, author textbook chapters, royalties. Contracted research grants from WL Gore to UW Madison.
References
- 1.Collinger JL, Fullerton B, Impink BG, Koontz AM, Boninger ML. Validation of greyscale-based quantitative ultrasound in manual wheelchair users: relationship to established clinical measures of shoulder pathology. Am J Phys Med Rehabil. 2010;89:390–400. doi: 10.1097/PHM.0b013e3181d8a238. [DOI] [PMC free article] [PubMed] [Google Scholar]
- 2.Pillen S, van Dijk JP, Weijers G, Raijmann W, de Korte C, Zwarts MJ. Quantitative gray-scale analysis in skeletal muscle ultrasound: Comparison study of two ultrasound devices. Muscle Nerve. 2009;39:781–6. doi: 10.1002/mus.21285. [DOI] [PubMed] [Google Scholar]
- 3.Zaidman CM, Connolly AM, Malkus EC, Florence JM, Pestronk A. Quantitative ultrasound using backscatter analysis in Duchenne and Becker muscular dystrophy. Neuromusc Disord. 2010;20:805–9. doi: 10.1016/j.nmd.2010.06.019. [DOI] [PMC free article] [PubMed] [Google Scholar]
- 4.Wohlin M, Sundstrom J, Andren B, Larsson A, Lind L. An echolucent carotid artery intima-media complex is a new and independent predictor of mortality in an elderly male cohort. Atherosclerosis. 2009;205:486–91. doi: 10.1016/j.atherosclerosis.2009.01.032. [DOI] [PubMed] [Google Scholar]
- 5.Lind L, Peters SAE, den Ruijter HM, Palmer MK, Grobbee DE, Crouse JR, et al. Effect of rosuvastatin on the echolucency of the common carotid intima-media in low-risk individuals: The METEOR Trial. J Am Soc Echocardiogr. 2012;25:1120–7. e1. doi: 10.1016/j.echo.2012.07.004. [DOI] [PubMed] [Google Scholar]
- 6.Peters SA, Lind L, Palmer MK, Grobbee DE, Crouse JR, O'Leary DH, et al. Increased age, high body mass index and low HDL-C levels are related to an echolucent carotid intima-media: the METEOR study. J Intern Med. 2012;272:257–66. doi: 10.1111/j.1365-2796.2011.02505.x. [DOI] [PubMed] [Google Scholar]
- 7.Nicolaides AN, Kakkos SK, Kyriacou E, Griffin M, Sabetai M, Thomas DJ, et al. Asymptomatic internal carotid artery stenosis and cerebrovascular risk stratification. J Vasc Surg. 2010;52:1486–96. doi: 10.1016/j.jvs.2010.07.021. [DOI] [PubMed] [Google Scholar]
- 8.Loizou CP, Georgiou N, Griffin M, Kyriacou E, Nicolaides A, Pattichis CS. Texture analysis of the media-layer of the left and right common carotid artery; IEEE-EMBS International Conference on Biomedical and Health Informatics (BHI); 2014. pp. 684–7. [Google Scholar]
- 9.Mitchell CC, Stein JH, Cook TD, Salamat S, Wang X, Varghese T, et al. Histopathologic Validation of Grayscale Carotid Plaque Characteristics Related to Plaque Vulnerability. Ultrasound Med Biol. 2017;43:129–37. doi: 10.1016/j.ultrasmedbio.2016.08.011. [DOI] [PMC free article] [PubMed] [Google Scholar]
- 10.Lind L, Andersson J, Rönn M, Gustavsson T. The echogenicity of the intima-media complex in the common carotid artery is closely related to the echogenicity in plaques. Atherosclerosis. 2007;195:411–4. doi: 10.1016/j.atherosclerosis.2007.03.029. [DOI] [PubMed] [Google Scholar]
- 11.Griffin M, Kyriacou E, Pattichis C, Bond D, Kakkos S, Sabetai M, et al. Juxtaluminal hypoechoic area in ultrasonic images of carotid plaques and hemispheric symptoms. J Vasc Surg. 2010;52:69–76. doi: 10.1016/j.jvs.2010.02.265. [DOI] [PubMed] [Google Scholar]
- 12.Giannoukas AD, Sfyroeras GS, Griffin M, Saleptsis V, Nicolaides AN. Association of plaque echostructure and cardiovascular risk factors with symptomatic carotid artery disease. J Cardiovasc Surg (Torino) 2010;51:245–51. [PubMed] [Google Scholar]
- 13.Kakkos SK, Griffin MB, Nicolaides AN, Kyriacou E, Sabetai MM, Tegos T, et al. The size of juxtaluminal hypoechoic area in ultrasound images of asymptomatic carotid plaques predicts the occurrence of stroke. J Vasc Surg. 2013;57:609–18. doi: 10.1016/j.jvs.2012.09.045. [DOI] [PubMed] [Google Scholar]
- 14.El-Barghouty NM, Levine T, Ladva S, Flanagan A, Nicolaides A. Histological verification of computerised carotid plaque charaterisation. Eur J Vasc Endovasc Surg. 1996;11:414–6. doi: 10.1016/s1078-5884(96)80172-9. [DOI] [PubMed] [Google Scholar]
- 15.Andersson J, Sundstrom J, Gustavsson T, Hulthe J, Elmgren A, Zilmer K, et al. Echogenicity of the carotid intima-media complex is related to cardiovascular risk factors, dyslipidemia, oxidative stress and inflammation: The Prospective Investigation of the Vasculature in Uppsala Seniors (PIVUS) study. Atherosclerosis. 2009;204:612–8. doi: 10.1016/j.atherosclerosis.2008.10.038. [DOI] [PubMed] [Google Scholar]
- 16.Mitchell CC, Korcarz CE, Tattersall MC, Gepner AD, Young RL, Post WS, et al. Carotid artery ultrasound texture, cardiovascular risk factors, and subclinical arterial disease: the Multi-Ethnic Study of Atherosclerosis (MESA) Br J Radiol. 2018;31 doi: 10.1259/bjr.20170637. [DOI] [PMC free article] [PubMed] [Google Scholar]
- 17.Mitchell C, Piper ME, Korcarze CE, Hansen K, Weber J, Fiore MC, et al. Echogenicity of the carotid arterial wall in active smokers. J Diag Med Sonogr. 2017 doi: 10.1177/8756479317747226. doi/10.1177/8756479317747226. [DOI] [PMC free article] [PubMed] [Google Scholar]
- 18.Griffin M, Nicolaides A, Kyriacou E. Normalisation of ultrasonic images of atherosclerotic plaques and reproducibility of grey scale median using dedicated software. Int Angiol. 2007;26:372–7. [PubMed] [Google Scholar]
- 19.Ruiz-Ares G, Fuentes B, Martínez-Sánchez P, Díez-Tejedor E. A prediction model for unstable carotid atheromatous plaque in acute ischemic stroke patients: Proposal and internal validation. Ultrasound Med & Biol. 2014;40:1958–65. doi: 10.1016/j.ultrasmedbio.2014.04.015. [DOI] [PubMed] [Google Scholar]
- 20.Tegos TJ, Sabetai MM, Nicolaides AN, Pare G, Elatrozy TS, Dhanjil S, et al. Comparability of the Ultrasonic Tissue Characteristics of Carotid Plaques. J Ultrasound Med. 2000;19:399–407. doi: 10.7863/jum.2000.19.6.399. [DOI] [PubMed] [Google Scholar]
- 21.Sabetai MM, Tegos TJ, Nicolaides AN, Dhanjil S, Pare GJ, Stevens JM. Reproducibility of computer-quantified carotid plaque echogenicity can we overcome the subjectivity? Stroke. 2000;31:2189–96. doi: 10.1161/01.str.31.9.2189. [DOI] [PubMed] [Google Scholar]
- 22.Salem MK, Bown MJ, Sayers RD, West K, Moore D, Nicolaides A, et al. Identification of patients with a histologically unstable carotid plaque using ultrasonic plaque image analysis. Eur J Vasc Endovasc Surg. 2014;48:118–25. doi: 10.1016/j.ejvs.2014.05.015. [DOI] [PubMed] [Google Scholar]
- 23.Salem MK, Sayers RD, Bown MJ, West K, Moore D, Nicolaides A, et al. Patients with recurrent ischaemic events from carotid artery disease have a large lipid core and low GSM. Eur J Vasc Endovasc Surg. 2012;43:147–53. doi: 10.1016/j.ejvs.2011.11.008. [DOI] [PubMed] [Google Scholar]
- 24.Ruiz-Ares G, Fuentes B, Martínez-Sánchez P, Martínez-Martínez M, Díez-Tejedor E. Utility of the assessment of echogenicity in the identification of symptomatic carotid artery atheroma plaques in ischemic stroke patients. Cerebrovasc Dis. 2011;32:535–41. doi: 10.1159/000330654. [DOI] [PubMed] [Google Scholar]
- 25.Tegos TJ, Sohail M, Sabetai MM, Robless P, Akbar N, Pare G, et al. Echomorphologic and histopathologic characteristics of unstable carotid plaques. AJNR Am J Neuroradiol. 2000;21:1937–44. [PMC free article] [PubMed] [Google Scholar]
- 26.Nicolaides AN, Kakkos SK, Griffin M, Sabetai M, Dhanjil S, Thomas DJ, et al. Effect of image normalization on carotid plaque classification and the risk of ipsilateral hemispheric ischemic events: Results from the asymptomatic carotid stenosis and risk of stroke study. Vascular. 2005;13:211–21. doi: 10.1258/rsmvasc.13.4.211. [DOI] [PubMed] [Google Scholar]
- 27.Ibrahimi P, Jashari F, Johansson E, Gronlund C, Bajraktari G, Wester P, et al. Vulnerable plaques in the contralateral carotid arteries in symptomatic patients: a detailed ultrasound analysis. Atherosclerosis. 2014;235:526–31. doi: 10.1016/j.atherosclerosis.2014.05.934. [DOI] [PubMed] [Google Scholar]
- 28.Loizou CP, Pantziaria M, Pattichis MS, Kyriakou E, Pattichis CS. Ultrasound image texture analysis of the intima and media layers of the common carotid artery and its correlation with age and gender. Comput Med Imaging Graph. 2009;33:317–24. doi: 10.1016/j.compmedimag.2009.02.005. [DOI] [PubMed] [Google Scholar]
- 29.Kolkert JL, Meerwaldt R, Loonstra J, Schenk M, van der Palen J, van den Dungen JJ, et al. Relation between B-mode gray-scale median and clinical features of carotid stenosis vulnerability. Ann Vasc Surg. 2014;28:404–10. doi: 10.1016/j.avsg.2013.04.025. [DOI] [PubMed] [Google Scholar]
- 30.Doonan RJ, Dawson AJ, Kyriacou E, Nicolaides AN, Corriveau MM, Steinmetz OK, et al. Association of ultrasonic texture and echodensity features between sides in patients with bilateral carotid atherosclerosis. Eur J Vasc Endovasc Surg. 2013;46:299–305. doi: 10.1016/j.ejvs.2013.05.024. [DOI] [PubMed] [Google Scholar]
- 31.Kanber B, Hartshorne TC, Horsfield MA, Naylor AR, Robinson TG, Ramnarine KV. Dynamic variations in the ultrasound greyscale median of carotid artery plaques. Cardiovasc Ultrasound. 2013;11:21. doi: 10.1186/1476-7120-11-21. [DOI] [PMC free article] [PubMed] [Google Scholar]
- 32.Ostling G, Persson M, Hedblad B, Goncalves I. Comparison of grey scale median (GSM) measurement in ultrasound images of human carotid plaques using two different softwares. Clin Physiol Funct Imaging. 2013;33:431–5. doi: 10.1111/cpf.12049. [DOI] [PubMed] [Google Scholar]
- 33.Kadoglou NPE, Gerasimidis T, Moumtzouoglou A, Kapelouzou A, Sailer N, Fotiadis G, et al. Intensive lipid-lowering therapy ameliorates novel calcification markers and GSM score in patients with carotid stenosis. Eur J Vasc Endovasc Surg. 2008;35:661–8. doi: 10.1016/j.ejvs.2007.12.011. [DOI] [PubMed] [Google Scholar]
- 34.Ostling G, Hedblad B, Berglund G, Concalves I. Increased echolucency of carotid plaques in patients with type 2 diabetes. Stroke. 2007;38:2074–8. doi: 10.1161/STROKEAHA.106.480830. [DOI] [PubMed] [Google Scholar]
- 35.Grogan JK, Shaalan WE, Cheng H, Gewertz B, Desai T, Schwarze G, et al. B-mode ultrasonographic characterization of carotid atherosclerotic plaques in symptomatic and asymptomatic patients. J Vasc Surg. 2005:435–41. doi: 10.1016/j.jvs.2005.05.033. [DOI] [PubMed] [Google Scholar]
- 36.Zaidman CM, Holland MR, Anderson CC, Pestronk A. Calibrated quantitative ultrasound imaging of skeletal muscle using backscatter analysis. Muscle Nerve. 2008;38:893–8. doi: 10.1002/mus.21052. [DOI] [PubMed] [Google Scholar]
- 37.Zaidman CM, Holland MR, Hughes MS. Quantitative ultrasound of skeletal muscle: Reliable measurements of calibrated muscle backscatter from different ultrasound systems. Ultrasound Med Biol. 2012;38:1618–25. doi: 10.1016/j.ultrasmedbio.2012.04.020. [DOI] [PMC free article] [PubMed] [Google Scholar]
- 38.Peters SAE, Bots ML, Lind L, Groenewegen KA, de Korte C, den Ruijter HM. The impact of variability in ultrasound settings on the measured echolucency of the carotid intima-media. J Hypertens. 2013;31:1861–7. doi: 10.1097/HJH.0b013e3283623548. [DOI] [PubMed] [Google Scholar]
- 39.Ibrahimi P, Jashari F, Bajraktari G, Wester P, Henein MY. Ultrasound assessment of carotid plaque echogenicity response to statin therapy: A systematic review and meta-analysis. Int J Mol Sci. 2015;16:10734–47. doi: 10.3390/ijms160510734. [DOI] [PMC free article] [PubMed] [Google Scholar]
- 40.Elatrozy T, Nicolaides A, Tegos T, Zarka AZ, Griffin M, Sabetai M. The effect of B-mode ultrasonic image standardisation on the echodensity of symptomatic and asymptomatic carotid bifurcation plaques. Int Angiol. 1998;17:179–86. [PubMed] [Google Scholar]
- 41.Griffin M, Kyriacou E, Kakkos SK, Beach KW, Nicolaides A. Image normalization, plaque typing, and texture feature extraction. In: Nicolaides A, Beach KW, Kyriacou E, Pattichis CS, editors. Ultrasound and carotid bifurction atherosclerosis. London: Springer; 2012. p. 193. [Google Scholar]
- 42.SAS Institute Inc. The SAS System for Windows: Release 9.4. SAS Institute Inc; Cary, NC: 2016. [Google Scholar]
- 43.King TS, Chinchilli VM, Carrasco JL. A repeated measures concordance correlation coefficient. Stat Med. 2007;26:3095–113. doi: 10.1002/sim.2778. [DOI] [PubMed] [Google Scholar]
- 44.Carrasco JL, Phillips BR, Puig-Martinez J, King TS, Chinchilli VM. Estimation of the concordance correlation coefficient for repeated measures using SAS and R. Comp Methods and Programs in Biomed. 2013;109:293–304. doi: 10.1016/j.cmpb.2012.09.002. [DOI] [PubMed] [Google Scholar]
- 45.Cnaan A, Laird NM, Slasor P. Using the general linear mixed model to analyse unbalanced repeated measures and longitudinal data. Stat Med. 1997;16:2349–80. doi: 10.1002/(sici)1097-0258(19971030)16:20<2349::aid-sim667>3.0.co;2-e. [DOI] [PubMed] [Google Scholar]
- 46.Westfall PH, Wolfinger RD. Multiple tests with discrete distributions. Am Stat. 1997;51:3–8. [Google Scholar]
- 47.Yao LX, Zagzebski JA, Madsen EL. Backscatter coefficient measurements using a reference phantom to extract depth-dependent instrumenation factors. Ultrason Imaging. 1990;12:58–70. doi: 10.1177/016173469001200105. [DOI] [PubMed] [Google Scholar]
- 48.Yao LX, Zagzebski JA, Madsen EL. Statistical uncertainty in ultrasonic backscatter and attneuation coefficients determined with a reference phantom. Ultrasound Med Biol. 1991;17:187–94. doi: 10.1016/0301-5629(91)90126-h. [DOI] [PubMed] [Google Scholar]
- 49.Liu T, Lizzi FL, Ketterling JA, Silverman RH, Kutcher GJ. Ultrasonic tissue characterization via 2-D spectrum analysis: theory and in vitro measurements. Med Phys. 2007;34:1037–46. doi: 10.1118/1.2436978. [DOI] [PMC free article] [PubMed] [Google Scholar]
- 50.Samimi K, White JK, Brace CL, Varghese T. Monitoring microwave ablation of ex vivo bovine liver using ultrasonic attenuation imaging. Ultrasound Med Biol. 2017;43:1441–51. doi: 10.1016/j.ultrasmedbio.2017.03.010. [DOI] [PMC free article] [PubMed] [Google Scholar]
- 51.Insana MF, Hall TJ, Wood JG, Yan ZY. Renal ultrasound using parametric imaging techniques to detect changes in microstructure and function. Invest Radiol. 1993;28:720–5. doi: 10.1097/00004424-199308000-00013. [DOI] [PubMed] [Google Scholar]
- 52.Shi H, Mitchell C, McCormick M, Kliewer M, Dempsey R, Varghese T. Preliminary in vivo atherosclerotic carotid plaque characterization using the accumulated axial strain and relative lateral shift strain indices. Phys Med Biol. 2008;53:6377–94. doi: 10.1088/0031-9155/53/22/008. [DOI] [PMC free article] [PubMed] [Google Scholar]
- 53.Shi H, Varghese T, Mitchell C, McCormick M, Dempsey R, Kliewer M. In vivo attenuation and equivalent scattererer size parameters for atherosclerotic carotid plaque: preliminary results. Ultrasonics. 2009;49:779–85. doi: 10.1016/j.ultras.2009.06.004. [DOI] [PMC free article] [PubMed] [Google Scholar]


