

Abstract
Aims
The present study assessed the acute effects of methadone and buprenorphine on actual on‐road driving performance and neurocognitive function.
Methods
Methadone (5 and 10 mg per os) and buprenorphine (0.2 and 0.4 mg sublingual) were administered to 22 healthy volunteers in a five‐way, double‐blind, randomized, placebo‐controlled, double‐dummy, cross‐over study. Driving performance was assessed with an on‐road driving test. The primary outcome measure was standard deviation of lateral position (SDLP), a measure of road tracking control. Laboratory tests were used to measure cognitive function (e.g. reaction time and attention) and questionnaires were used to assess subjective measures of mood and sedation.
Results
There was no significant main effect of treatment on SDLP. Yet, analysis of individual drug‐placebo contrast data revealed that buprenorphine 0.4 mg significantly increased SDLP. Driving impairment was mild and below the impairment threshold of a blood alcohol concentration of 0.5 mg ml−1. Four participants stopped their driving test while under the influence of either opioid due to sleepiness. Both opioids produced impairments of cognitive task performance and increased sleepiness particularly at the highest dose.
Conclusions
Analgesic doses of buprenorphine produced mild impairing effects on driving and related cognitive skills, while methadone impaired cognitive task performance but not driving performance. Large individual variations were observed for both drugs. Patients should be informed about the possibility of driving impairment when initiating opioid treatment.
Keywords: clinical trials, opioids, pharmacodynamics
What is Already Known about this Subject
Opioids have been associated with increased crash risk among drivers but it is unknown whether this association generalizes to all opioids or pertains to specific opioids in particular.
What this Study Adds
An on‐road driving test was used to assess the acute effects of analgesic doses of methadone and buprenorphine.
Buprenorphine 0.4 mg mildly impaired on‐road driving.
Buprenorphine and methadone produced some cognitive and clinical impairments and increased sleepiness, particularly after the high doses.
Introduction
Opioids are frequently prescribed for the treatment of pain. The global consumption of opioids was close to 12 billion of defined daily doses in 2016 1. Over the last 20 years, the global consumption has more than tripled and the share of synthetic opioids has increased to 39%. In addition, non‐medical use of prescription opioids has been rising excessively. The large numbers of overprescription, abuse and overdose death have subsequently generated an opioid crisis, particularly in North America. In 2016, more than 42 000 persons died in the US as a result of an opioid overdose, including prescription opioids 2. Between January 2016 and September 2017 there were close to 6000 opioid‐related deaths in Canada 3.
Besides the overdoses, mortality among opioid users has also been associated with accidents related to driving under the influence. Epidemiological studies have shown a statistically significant association between opioid use and road traffic crashes 4. A European case–control study that was conducted as part of the research project DRUID concluded that the average odds ratio of getting seriously injured or killed in an accident increased by a factor of 2–10 when driving under the influence of medicinal opioids. The latter is comparable to the risk of driving under the influence of alcohol at blood alcohol concentrations (BAC) of 0.5–0.8 mg ml−1 5.
Methadone and buprenorphine are opioids widely used as analgesics and in opioid maintenance treatment. In blood samples from drivers suspected of drugged driving in Norway in 2016, methadone was detected in 2% and buprenorphine in 3% of cases 6. Approximately 26 000 persons used buprenorphine or methadone on prescription in Norway in 2016, 18 000 of which used buprenorphine as an analgesic patch 7. Opioid prescription in Norway between 2014–2016 was 12 defined daily doses (DDD) per 1000 inhabitants per day 8.
Methadone is a synthetic, long‐acting opioid. Methadone acts primarily on μ‐opioid receptors that are thought to be particularly important for analgesia, euphoria, respiratory depression, tolerance and dependence. A regular dose of methadone in pain treatment is 5–10 mg per os 3–4 times per day. Buprenorphine is a semi‐synthetic partial opioid agonist/antagonist which binds to δ‐receptors, μ‐receptors and κ‐receptors in the brain. Buprenorphine has a wide therapeutic range due to its agonist/antagonist effects, which limits its depressant effects especially on respiratory and cardiac functions. A regular dose of buprenorphine in pain treatment is 0.2–0.4 mg sublingual up to 3–4 times daily.
Although epidemiological studies indicate that opioid use increases crash risk among drivers, it is less clear whether driving impairment is caused by each and every opioid within this group. Traditionally, placebo‐controlled studies have been employed to study differential effects of opioids on neurocognitive function and skills related to driving 9. So far, experimental studies on the acute effects of methadone and buprenorphine on driving‐related performance in opioid‐naïve subjects have been inconclusive. Few studies on psychomotor and cognitive performance among healthy volunteers after administration of a single dose of methadone or buprenorphine have been performed 10, 11, 12, 13, 14, 15, 16, 17. Only some of these indicated that methadone 5 mg per os and buprenorphine 0.3 mg sublingual produced psychomotor impairment in opioid naïve individuals 13, 14, 15, 16. However, the clinical relevance of these findings is difficult to establish as these studies neither included a reference drug like ethanol, nor included standardized tests to assess impairment 18, 19, 20.
Dedicated driving studies to determine and qualify the clinical relevance of drug effects on driver safety have been conducted for over 30 years by researchers in the Netherlands 21. These studies employed a standardized on‐road driving test that is conducted on a primary highway in normal traffic. The primary outcome parameter is standard deviation of lateral position (SDLP), a measure of road tracking performance. This measure has been shown to significantly increase in drivers who are exposed to acute or repeated doses of sedating drugs 21 and to be sensitive to BAC as low as 0.35 mg ml−1 22. Alcohol produced an exponential rise in SDLP with increasing BACs. The mean increment in SDLP (i.e. 2.5 cm) that was observed while driving with a BAC of 0.5 mg ml−1 has been defined as the minimal cut‐off value to represent clinical relevance 23. Recently, the on‐road test was used to compare driving performance of chronic non‐cancer pain patients who received chronic opioid therapy (e.g. hydromorphone, oxycodone and fentanyl) to that of matched controls. Driving performance of these patients did not significantly differ from that of controls indicating tolerance to certain opioid effects, although large inter‐individual variations were observed 24. On‐road studies assessing the acute effects of buprenorphine and methadone are still lacking.
The aims of this study were to assess and compare the effects of methadone and buprenorphine on actual driving and cognitive and psychomotor performance in healthy volunteers.
Methods
Subjects
Twenty‐two healthy volunteers (11 male, 11 female) aged 23–49 years (mean age 36 years) were included after screening of 29 volunteers in total. They were recruited via advertisements in local newspapers and poster advertisements in Maastricht University. None of the volunteers used opioid analgesics regularly at the time of testing.
Inclusion criteria were: healthy males or females based on a physical examination, medical history, vital signs, electrocardiogram, and the results of blood chemistry and haematology tests, and urine analysis; age between 23 and 50 years; body mass index (weight/length2) between 19 and 29 kg m−2; possession of a valid driving license for minimum 4 years; driving experience of minimum 5000 km per year on average; and good sleeper.
Exclusion criteria were: pregnancy or lactation, sleep disorders; drug or alcohol abuse; use of psychoactive medication or drug considered to influence the test drugs; excessive alcohol use (>21 units per week); excessive caffeine use (≥5 cups per day); smoking >6 cigarettes per day; intake of any opioid within 3 months before the study; significant disease; and poor metabolism of methadone due to CYP2B6 polymorphism.
Approval of the study was obtained from the independent Ethics Committee of Maastricht University and the Academic Hospital Maastricht in the Netherlands and from the Regional Committees for Medical and Health Research Ethics in Norway. This study was conducted according to the code of ethics on human experimentation established by the Declaration of Helsinki (1964) and amended in Fortaleza, Brazil (2013) and in accordance with the Medical Research Involving Human Subjects Act. Written informed consent was obtained from all volunteers.
Design and treatments
The study followed a five‐way, double‐blind, randomized, placebo‐controlled, double‐dummy, cross‐over design to compare the acute effects of two single doses of methadone (5 and 10 mg per os) and buprenorphine (0.2 and 0.4 mg sublingual) with placebo. The minimum washout period between test days was 10 days.
Similar doses of methadone and buprenorphine have been administered to opioid naïve users in previous studies 13, 14, 15, 16. The dose regimen of methadone frequently used for pain relief is 5–10 mg per os 3–4 times daily. Buprenorphine is used in pain treatment in doses of 0.2–0.4 mg sublingual up to 3–4 times daily. A single dose of buprenorphine 0.8 mg sublingual is equivalent to morphine 60 mg per os, while a single dose of methadone 20 mg per os is equivalent to morphine 60 mg per os 25.
Methadone (methadone capsules and placebo capsules) and buprenorphine (buprenorphine sublingual tablets and placebo sublingual tablets) were purchased, blinded and labelled by University Pharmacy (Nijmegen, the Netherlands) and Tiofarma (Oud‐Beijerland, the Netherlands), respectively, according to the Good Manufacturing Practice guidelines.
Procedure
When participants arrived, urine samples were screened for drugs by using the SureStep™ Drug Screen Cup (Abbott, Abbott Park, IL, USA); a pregnancy test was performed using the Alere™ hCG Cassette (Abbott), and breath alcohol was analysed using Dräger Alcotest 5000 (Drägerwerk AG & Co., Lübeck, Germany).
Participants were asked to refrain from consuming caffeine (coffee, tea and soft drinks) on test days from awakening until the end of testing as well as alcohol intake from 24 h prior to test days. Participants were instructed to have a normal night of sleep before test days. This was assessed with the Groningen Subjective Quality of Sleep Questionnaire 26. Drug screens assessed for the presence of methamphetamine, cocaine, THC, morphine, benzodiazepines and amphetamine in urine. On each test day participants received two capsules containing methadone or placebo and two sublingual tablets containing buprenorphine or placebo, according to a double‐dummy procedure. Figure 1 provides a schematic overview of a test day.
Figure 1.

Schematic overview of a test day
Blood was collected using 5‐ml Vacutainer® tubes containing sodium fluoride (20 mg) and sodium heparin (143 IU) (BD Diagnostics, Franklin Lakes, NJ, USA).
Highway driving test
The on‐road driving test was performed on a 100 km primary highway segment in normal traffic 21, 27. Participants were instructed to drive with a steady lateral position within the right traffic lane at a constant speed of 95 km h−1 (60 mph). A licensed driving instructor accompanied the driver. A specially instrumented vehicle was used to measure standard deviation of lateral position (SDLP in cm) or ‘weaving’, the primary outcome variable 28, see Figure 2. In addition to SDLP, the standard deviation of speed (SDSP) and mean lateral position (MLP) were measured.
Figure 2.
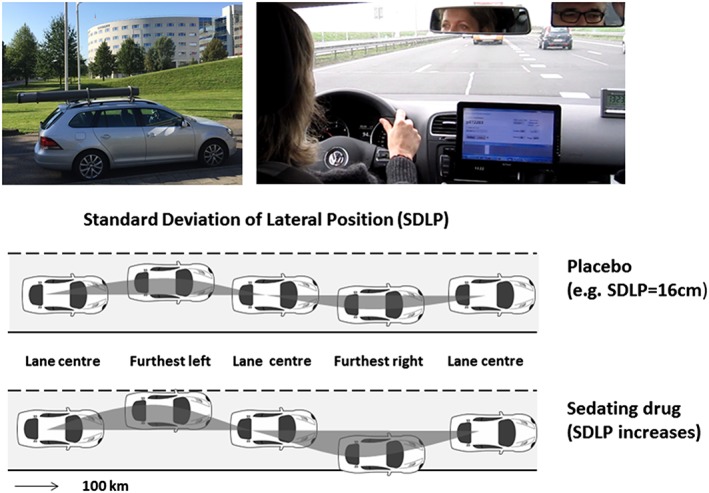
Standardized highway driving test. A specially instrumented car was used during the on‐road driving test. Participants were instructed to drive with a steady lateral position between the delineated borders of the right lane with a constant speed of 95 km h−1 (60 mph). A licensed driving instructor was accompanying the participant in the car (upper panels). The standard deviation of lateral position (SDLP in cm) is an index of road tracking error or ‘weaving’ (lower panel)
Cognitive and psychomotor tests
The Psychomotor Vigilance Task (PVT) measured sustained attention by assessing the reaction time in response to a visual stimulus. The subject had to react to the onset of the counter as quickly as possible by pressing a response button 29. Lapses were defined as a failure to react or any reaction exceeding 500 msec.
The Critical Tracking Task (CTT) measured the ability to control an unstable error signal in a first‐order compensatory tracking task 30. Subjects were instructed to keep an unstable bar in the middle of a horizontal plane by counteracting or reversing its movements with the aid of a joystick. The frequency of cursor deviations at which the subject lost control is the critical frequency.
The Divided Attention Test (DAT) measured the ability to divide attention between two simultaneously performed tasks 31. In the primary task, the subject performed the same tracking task as described above (CTT), yet at a constant level of difficulty set at 50% of his or her maximum capacity. In the secondary task, the subject monitored 24 peripheral displays in which single digits changed asynchronously at 5 s intervals. Subjects were instructed to remove their foot from a pedal as rapidly as possible whenever the digit ‘2’ appeared.
The Useful Field of View Test (UFOV) included three increasingly difficult, visually presented subtests: stimulus identification, divided attention and selective attention 32. The participants had to identify a target presented at a central fixation point on the screen, and the second and third subtest included peripheral simultaneous targets as visual distractors.
The Digit Symbol Substitution Test (DSST) measured executive attention and processing speed 33. A computerized version was used 34. The subject was required to match digits with a symbol from an encoding list as rapidly as possible by clicking the corresponding response button.
Postural Balance test (PBT) measured balance using the AMTI AccuSway System for Balance and Postural Sway Measurement (Advanced Mechanical Technology, Inc., Watertown, MA, USA) force platform 35, 36. Postural sway was assessed in two trials (eyes open and eyes closed) by measuring the length of the path of the centre‐of‐pressure (COP), and the area of the 95% confidence ellipse enclosing the COP (A95).
Vienna Test System – Determination Test (DT/S1) measured resilience of attention and reaction speed under conditions of sensory stress. The task of the respondent was to identify various stimuli and to react to them by pressing the respective corresponding response buttons. This test presented the stimuli a little faster than would be optimal given the respondents' reaction speed, thus resulting in a condition of sensory stress.
A simplified clinical test of impairment was performed 37. The clinical test of impairment, used in Norway by medical doctors working for the police with suspects driving under the influence of drugs, consists of 25 tests and observations related to common signs of drug impairment 38. Five subtests from the Norwegian clinical test of impairment were selected: gait‐on‐line test, turn‐on‐line test, finger‐to‐finger test, finger‐to‐nose test, and Romberg's test (standing steady on one leg for at least 5 s with arms stretched out and eyes closed) 37. For each of the five subtests, the performance was measured and scored as either ‘habitual’, ‘somewhat deviant’ or ‘deviant’. An overall impression of the subject, termed the ‘global impression’, being the sixth subtest, was graded as either ‘not impaired’, ‘slightly impaired’, ‘moderately impaired’ or ‘obviously impaired’.
Subjective evaluations
Subjective evaluations of mood and apparent sedation were assessed by using a series of visual analogue scales (100 mm) 39. Subjects rated their subjective feelings on a 16‐item mood scale which provided three factor analytically defined summary scores for ‘alertness’, ‘contentedness’ and ‘calmness’.
The Karolinska sleepiness scale is a subjective rating scale with scores that range from 1, ‘extremely alert,’ to 9, ‘very sleepy, great effort to keep alert, fighting sleep’ 40. Reyner and Horne modified the original scale by adding verbal descriptions to intermediate steps, which do not have any descriptions in the original version 41.
Safety assessment
During test periods, side effects either observed by the investigator or spontaneously reported by the subject were recorded.
Pharmacokinetics
Concentrations of methadone and buprenorphine in samples of whole blood were determined using ultra‐high‐performance liquid chromatography–tandem mass spectrometry (UHPLC–MS/MS) after 96‐well supported liquid extraction 42, which was slightly modified for the determination of methadone and buprenorphine by adding relevant calibration standards. The cut‐off concentrations were 0.5 nM for methadone and 0.2 nM for buprenorphine.
Statistics
All measures were analysed using General Linear Model (GLM) univariate measures. The model included two fixed factors, i.e. Treatment (5 levels) and Time (2 levels), and a random factor for Subjects. Independent of the results of the main effect of treatment analysis, a drug–placebo contrast as well as low dose vs. high dose contrast for each opioid was performed. In addition, a non‐inferiority analysis was conducted on SDLP data collected in the highway driving test to determine clinical relevance of drug‐induced changes relative to placebo. For SDLP, non‐inferiority between treatment and placebo was concluded if the upper limit of the 95% CI of the mean difference between drug and placebo was <2.5 cm. The latter criterion represents a clinically relevant change in SDLP as observed after a BAC of 0.5 mg ml−1 23. A power analysis showed that in order to detect drug effects of medium size (f = 0.25) on the within subject variable (SDLP), a total of 20 participants would be adequate, using a two‐sided t‐test with 95% power at a significance level of 5%. All statistical analyses were conducted using SPSS for Windows (version 25; SPSS Inc., Chicago, IL, USA).
Nomenclature of targets and ligands
Key protein targets and ligands in this article are hyperlinked to corresponding entries in http://www.guidetopharmacology.org, the common portal for data from the IUPHAR/BPS Guide to PHARMACOLOGY 43, and are permanently archived in the Concise Guide to PHARMACOLOGY 2017/18 44.
Results
Failure to complete driving test and missing data
Driving tests had to be terminated prematurely on request of the participants six times (by four participants). In all cases, the participants told the driving instructor that they wanted to terminate the driving session because they felt too sleepy to continue driving. Driving tests were stopped twice during methadone 10 mg and buprenorphine 0.4 mg and once following buprenorphine 0.2 and placebo. Two subjects did not complete all treatment conditions. All data from the on‐road driving test entered the analysis, except one prematurely terminated ride where driving data was collected for 6 min only (in the buprenorphine 0.2 mg condition). Extreme outliers, defined as deviating more than ±3 SD from the mean were removed from the respective parameter. In the PBT, three values were excluded in the eyes open condition, and five values in the eyes closed condition.
On several test days subjects were not able to complete neurocognitive tests because of side effects. These data were registered as missing data and were not included in the analysis. The number (%) of subjects that were unable to perform neurocognitive tasks were: PVT n = 3 (14%); CTT n = 5 (23%); DAT n = 7 (32%); DSST n = 4 (18%); DTS1 n = 7 (32%); UFOV n = 5 (23%); and PBT n = 10 (45%).
Highway driving test
Table 1 presents a summary of mean (SE) driving and cognitive test performances in all treatment conditions and their associated GLM statistics.
Table 1.
Mean (SE) driving and cognitive test performances in all treatment conditions and their associated General Linear Model (GLM) statistics
| Performance parameters | Time of testing | Treatments Mean (SE) | Main effect treatment | |||||||
|---|---|---|---|---|---|---|---|---|---|---|
| Placebo | Buprenorphine 0.2 mg | Buprenorphine 0.4 mg | Methadone 5 mg | Methadone 10 mg | df | F | P | Main effect Treatment × Time | ||
| Driving test | ||||||||||
| Standard deviation of lateral position (cm) | + 4 h | 18.31 (0.34) | 18.36 (0.35) | 19.45 (0.36)a | 18.34 (0.37) | 18.73 (0.34) | – | – | NS | n.a. |
| Standard deviation of speed (km h −1 ) | + 4 h | 2.91 (0.10) | 2.83 (0.10) | 2.86 (0.10) | 2.83 (0.11) | 2.96 (0.10) | – | – | NS | n.a. |
| Mean lateral position (cm) | + 4 h | 87.38 (1.22) | 83.57 (1.26)a | 89.01 (1.30)b | 87.74 (1.34) | 85.66 (1.22) | 4.78 | 2.78 | 0.032 | n.a. |
| Psychomotor Vigilance Test | ||||||||||
| Mean reaction time (ms) | + 2 h | 283.54 (11.75) | 295.83 (11.75) | 322.71 (12.12)a | 283.79 (12.48) | 315.93 (11.75) | 4.181 | 4.37 | 0.002 | P = 0.002 |
| + 6 h | 292.04 (29.98) | 344.51 (29.98) | 405.90 (32.92)a , b | 338.27 (31.91) | 412.99 (29.98)a | |||||
| Lapses (#) | + 2 h | 0.73 (0.19) | 1.55 (0.30) | 3.86 (1.51) | 0.90 (0.27) | 3.77 (2.05) | 4.181 | 5.32 | 0.000 | P = 0.000 |
| + 6 h | 1.41 (0.48) | 7.36 (2.61)a | 10.58 (2.88)a | 5.35 (1.96) | 11.59 (3.66)a | |||||
| Critical Tracking Test | ||||||||||
| Critical lambda (rad s −1 ) | + 2 h | 3.17 (0.12) | 3.16 (0.14) | 2.99 (0.16)a | 3.29 (0.17) | 3.12 (0.19) | 4.177 | 5.05 | 0.001 | NS |
| + 6 h | 3.10 (0.16) | 3.18 (0.16) | 2.88 (0.18)a , b | 3.16 (0.20) | 3.03 (0.21) | |||||
| Divided Attention Test | ||||||||||
| Tracking errors (mm) | + 2 h | 18.57 (1.11) | 18.15 (1.24) | 17.72 (1.16) | 16.96 (1.23) | 17.97 (1.25) | – | – | NS | NS |
| + 6 h | 19.18 (1.19) | 19.46 (1.31) | 18.94 (1.34) | 17.92 (1.24) | 19.25 (1.06)b | |||||
| Control losses (#) | + 2 h | 15.09 (4.93) | 6.36 (1.62) | 35.45 (16.15) | 19.05 (13.46) | 10.05 (4.85) | 4.169 | 4.12 | 0.003 | P = 0.011 |
| + 6 h | 13.00 (4.17) | 38.71 (10.85)a | 54.47 (22.05)a | 25.59 (10.02) | 37.11 (12.34)a | |||||
| Hits (#) | + 2 h | 44.45 (1.33) | 44.86 (1.11) | 42.90 (1.38)a , b | 45.15 (1.20) | 43.57 (1.45) | 4.169 | 7.37 | 0.000 | P = 0.002 |
| + 6 h | 44.23 (1.34) | 43.10 (1.44) | 40.29 (1.76)a , b | 43.00 (1.79) | 42.00 (1.80)a | |||||
| False alarms (#) | + 2 h | 2.27 (0.50) | 3.09 (0.63) | 3.05 (0.63) | 1.70 (0.29) | 2.52 (0.43) | – | – | NS | NS |
| + 6 h | 2.05 (0.45) | 2.43 (0.58) | 2.65 (0.62) | 1.94 (0.37) | 2.17 (0.41) | |||||
| Reaction time (ms) | + 2 h | 1830.86 (72.43) | 1837.41 (74.96) | 1999.40 (68.26)a , b | 1894.80 (77.42) | 1880.10 (73.63) | 4.167 | 6.19 | 0.000 | P = 0.000 |
| + 6 h | 1899.57 (66.08) | 2064.60 (87.81)a | 2119.12 (85.35)a | 1990.82 (80.31) | 1991.28 (75.26) | |||||
| Digit Symbol Substitution Test | ||||||||||
| Correct responses (#) | + 2 h | 88.14 (3.00) | 88.18 (2.92) | 81.57 (3.87)a , b | 90.10 (3.19) | 85.64 (3.58) | 4.179 | 14.15 | 0.000 | P = 0.007 |
| + 6 h | 88.00 (3.19) | 85.76 (3.17) | 77.21 (3.49)a , b | 88.16 (3.08) | 79.59 (3.62)a , b | |||||
| Determination Test version S1 | ||||||||||
| Median reaction time (ms) | + 2 h | 0.74 (0.02) | 0.76 (0.02) | 0.80 (0.03)a , b | 0.74 (0.02) | 0.78 (0.03)a , b | 4.175 | 12.05 | 0.000 | NS |
| + 6 h | 0.72 (0.02) | 0.74 (0.02) | 0.81 (0.03)a , b | 0.72 (0.02) | 0.79 (0.04)a | |||||
| Correct responses (#) | + 2 h | 278.82 (18.49) | 273.36 (13.05) | 260.10 (22.02) | 283.00 (21.80) | 275.27 (21.69) | – | – | NS | NS |
| + 6 h | 287.91 (18.65) | 274.33 (13.57) | 247.95 (24.78) | 286.11 (23.93) | 276.43 (24.10) | |||||
| Useful Field of View | ||||||||||
| Processing speed | + 2 h | 115.65 (15.78) | 88.54 (15.23) | 117.22 (18.36) | 107.86 (21.61) | 139.58 (28.64) | 4.175 | 3.46 | 0.009 | NS |
| + 6 h | 98.60 (14.93) | 111.74 (16.48) | 153.1 (27.90)a | 130.64 (28.64) | 166.86 (37.88)a | |||||
| Postural Balance test | ||||||||||
| Eyes open –ln area 95 (cm 2 ) | + 2 h | 0.59 (0.14) | 0.61 (0.13) | 0.96 (0.16)a , b | 0.56 (0.11) | 0.70 (0.13) | 4.174 | 4.07 | 0.004 | P = 0.004 |
| + 6 h | 0.63 (0.11) | 0.92 (0.16) | 0.96 (0.17)a | 0.92 (0.18) | 1.05 (0.14)a | |||||
| Eyes closed –ln area 95 (cm 2 ) | + 2 h | 1.04 (0.15) | 1.10 (0.15) | 1.39 (0.19)a | 1.14 (0.16) | 1.03 (0.14) | 4.170 | 4.89 | 0.001 | NS |
| + 6 h | 0.81 (0.15) | 1.18 (0.17)a | 1.48 (0.20)a | 1.20 (0.20)a | 1.45 (0.18)a | |||||
n.a. = not applicable; NS = not significant;
Significant drug–placebo contrast (P < 0.05);
Significant low‐high contrast (P < 0.05) (Buprenorphine 0.2 mg vs. buprenorphine 0.4 mg; methadone 5 mg vs. methadone 10 mg)
Analysis of variance showed no significant main effects of Treatment on SDLP or standard deviation of speed (SDSP), but a significant effect on mean lateral position (MLP). Drug–placebo contrasts revealed that buprenorphine 0.4 mg significantly increased SDLP. Non‐inferiority was shown for both methadone conditions as well as the low dose of buprenorphine. The high dose of buprenorphine significantly increased SDLP relative to placebo, but the 95% CI did not include the criterion for clinical relevance at a BAC of 0.5 mg ml−1. Mean changes in SDLP (95% CI) in all drug conditions are shown in Figure 3.
Figure 3.

Mean (95% CI) changes in standard deviation of lateral position (SDLP) relative to placebo, in every drug condition
Cognitive tests
Significant main effects of Treatment and Treatment × Time were observed in the PVT (reaction time and lapses), the DAT (control losses, hits and reaction time), Postural balance (eyes open) and the DSST (correct response). Main effects of Treatment were found for all tests.
Drug–placebo contrasts revealed that the low dose of methadone did not affect any of the cognitive parameters, except for an increase in postural balance in the eyes closed condition. The high dose of methadone significantly increased number of lapses (PVT), number of control losses (DAT), reaction time (PVT and DT) and decreased number of hits (DAT), correct responses (DSST), processing speed (UFOV) and postural balance. Drug–drug contrast revealed that impairments observed in reaction time (DT), tracking error (DAT) and correct responses (DSST) were significantly more pronounced during the high as compared to the low dose.
The low dose of buprenorphine significantly increased reaction time (DAT), number of lapses (PVT), number of control losses (DAT) and postural balance (eyes closed). The high dose of buprenorphine significantly increased reaction time (PVT, DAT and DT), number of lapses (PVT), tracking (CTT), number of control losses (DAT) and decreased number of hits (DAT), correct responses (DSST), processing speed (UFOV) and postural balance. Drug–drug contrast revealed that impairments observed in reaction time (PVT, DAT and DAT), tracking (CTT), hits (DAT), correct responding (DSST) and postural balance were significantly more pronounced during the high as compared to the low dose.
Questionnaires and clinical test of impairment
Table 2 presents mean (SE) scores on questionnaires and the clinical test of impairment in every treatment condition and statistics for main effects, drug–placebo and low vs. high dose contrasts.
Table 2.
Mean (SE) scores on questionnaires and the clinical test of impairment in every treatment condition and their associated General Linear Model (GLM) statistics
| Performance parameters | Time of testing | Treatments | Main effect treatment | Main effect Treatment × Time | ||||||
|---|---|---|---|---|---|---|---|---|---|---|
| Placebo | Buprenorphine 0.2 mg | Buprenorphine 0.4 mg | Methadone 5 mg | Methadone 10 mg | df | F | p | |||
| Karolinska sleepiness scale | + 2 h | 3.14 (0.23) | 3.82 (0.35) | 4.81 (0.42)a , b | 3.70 (0.33) | 4.05 (0.33)a | 4.182 | 11.79 | 0.000 | P = 0.000 |
| + 6 h | 4.09 (0.38) | 6.05 (0.41)a | 6.35 (0.45)a | 5.55 (0.44)a | 5.82 (0.43)a | |||||
| Simplified clinical test of impairment | ||||||||||
| Walk‐on‐line | + 2 h | 1.46 (0.14) | 1.82 (0.14) | 2.06 (0.14)a | 1.77 (0.15) | 1.86 (0.14)a | 4.81 | 2.48 | 0.050 | – |
| Gait‐on‐line | + 2 h | 1.41 (0.13) | 1.77 (0.13) | 2.11 (0.13) | 1.69 (0.14)a | 1.73 (0.13)a | 4.81 | 3.69 | 0.008 | – |
| Finger‐finger‐test | + 2 h | 1.18 (0.11) | 1.23 (0.11) | 1.65 (0.12)a , b | 1.24 (0.12) | 1.50 (0.11)a | 4.81 | 3.21 | 0.017 | – |
| Finger‐nose‐test | + 2 h | 1.14 (0.08) | 1.14 (0.08) | 1.13 (0.09) | 1.05 (0.09) | 1.18 (0.08) | NS | – | ||
| Romberg's test | + 2 h | 1.50 (0.15) | 2.09 (0.15)a | 2.19 (0.16)a | 1.91 (0.16) | 2.27 (0.15)a | 4.81 | 4.08 | 0.005 | – |
| Overall impression | + 2 h | 1.23 (0.14) | 1.73 (0.14)a | 2.26 (0.14)a | 1.53 (0.15) | 2.00 (0.14)a | 4.81 | 8.38 | 0.000 | – |
| Bond & Lader | ||||||||||
| Alertness | +2 h | 23.55 (3.74) | 30.56 (3.13) | 45.71 (4.56)a , b | 31.39 (3.25) | 39.00 (3.91)a | 4.182 | 11.80 | 0.000 | P = 0.001 |
| + 6 h | 30.29 (3.59) | 44.10 (4.08)a | 50.72 (4.55)a | 43.14 (3.64)a | 46.88 (4.21)a | |||||
| Contentedness | + 2 h | 15.50 (2.52) | 19.11 (2.85) | 24.35 (3.22)a | 21.18 (2.46) | 18.55 (2.54) | 4.182 | 7.30 | 0.000 | NS |
| + 6 h | 17.67 (2.98) | 23.58 (3.03)a | 27.90 (3.42)a | 20.58 (2.41) | 20.67 (2.18) | |||||
| Calmness | + 2 h | 19.20 (2.66) | 22.82 (2.93) | 21.80 (2.69) | 24.55 (3.32) | 20.39 (3.39) | – | – | NS | NS |
| + 6 h | 21.41 (3.26) | 24.27 (2.50) | 19.30 (3.00)b | 21.00 (2.98) | 20.82 (3.14) | |||||
NS = not significant;
Significant drug–placebo contrast (P < 0.05);
Significant low‐high contrast (P < 0.05)
Main effects of treatment were observed for all parameters of the clinical test of impairment except the finger‐to‐nose test, the Karolinska sleepiness scale and the factors alertness and contentedness of the Bond and Lader scale. Main effects of Treatment × Time were only observed for ratings of sleepiness and alertness.
Drug–placebo contrasts showed that the low dose of methadone increased sleepiness, clinical impairment rating (on one parameter) and reduced alertness. The high dose also increased sleepiness, clinical ratings of impairment (on five parameters) and alertness. Levels of impairment did not significantly differ between both doses on any of these parameters.
The low dose of buprenorphine increased sleepiness, clinical ratings of impairment (on two parameters) and reduced alertness and contentedness. The high dose increased sleepiness, clinical ratings of impairment (on four parameters) and reduced alertness and contentedness. Sleepiness, loss of alertness and clinical ratings of impairment (on one parameter) were more pronounced after the high dose as compared to the low dose.
Side effects
No serious adverse events were observed during the study. The most frequently reported side effects were nausea, vomiting, dizziness and tiredness/sleepiness. A summary of the most frequently reported side effects is given in Table 3.
Table 3.
Side effects occurring in >2 subjects
| Side effects | Placebo (n = 22) n (%) | Buprenorphine 0.2 mg (n = 22) n (%) | Buprenorphine 0.4 mg (n = 21) n (%) | Methadone 5 mg (n = 20) n (%) | Methadone 10 mg (n = 22) n (%) |
|---|---|---|---|---|---|
| Nausea | 1 (5) | 5 (23) | 15 (71) | 4 (20) | 11 (50) |
| Vomiting | – | – | 9 (43) | 1 (5) | 4 (18) |
| Tiredness | 7 (32) | 9 (41) | 8 (38) | 11 (55) | 11 (50) |
| Sleepiness | 6 (27) | 10 (45) | 6 (29) | 7 (35) | 7 (32) |
| Headache | 2 (9) | 2 (9) | 2 (10) | 4 (20) | 1 (5) |
| Warm/sweaty | – | 1 (5) | 5 (24) | 1 (5) | 4 (18) |
| Clammy | – | – | 3 (14) | 1 (5) | – |
| Paleness | – | – | 3 (14) | – | 4 (18) |
| Dizziness | – | 7 (32) | 11 (52) | 7 (35) | 14 (64) |
| Itching | – | – | – | 1 (5) | 3 (14) |
| Concentration problems | 2 (9) | 2 (9) | 1 (5) | – | – |
| Euphoria | – | – | – | 1 (5) | 2 (9) |
| Drowsiness | – | 1 (5) | 2 (10) | – | 1 (5) |
| Dry mouth | 2 (9) | 2 (9) | 1 (5) | – | 3 (14) |
Pharmacokinetics
Mean (±SD) methadone and buprenorphine blood concentrations are presented in Table 4.
Table 4.
Drug concentrations in whole blood in all opioid condition as a function of the time after administration (mean ± SD) (nM)
| Time post drug (h) | Buprenorphine 0.2 mg | n | Buprenorphine 0.4 mg | n | Methadone 5 mg | n | Methadone 10 mg | n |
|---|---|---|---|---|---|---|---|---|
| 1 | 0.16 (0.08) | 20 | 0.30 (0.13) | 21 | 14.44 (11.82) | 19 | 19.18 (16.33) | 20 |
| 2 | 0.21 (0.10) | 21 | 0.38 (0.18) | 21 | 30.10 (10.33) | 20 | 53.73 (21.06) | 20 |
| 3.5 | 0.15 (0.09) | 22 | 0.28 (0.12) | 21 | 36.28 (9.35) | 20 | 65.13 (15.30) | 20 |
| 6.5 | 0.05 (0.04) | 21 | 0.09 (0.05) | 20 | 25.83 (6.28) | 19 | 51.78 (8.33) | 20 |
Discussion
In the current study the acute effects of methadone (5 mg and 10 mg) and buprenorphine (0.2 mg and 0.4 mg) on on‐road driving, psychomotor and cognitive performance were assessed. A significant increase in SDLP (i.e. 1.12 cm) during highway driving was found after 0.4 mg of buprenorphine as compared to placebo. The low dose of buprenorphine as well as both doses of methadone did not affect on‐road driving. The influence of both opioids on cognitive task performance was more prominent. Particularly the high doses produced performance impairments on several neurocognitive tests. In addition, both drugs increased levels of sleepiness, reduced alertness and increased ratings of clinical impairment.
On‐road driving data indicated that overall, the influence of methadone and buprenorphine were mild or even absent. Non‐inferiority was shown for both methadone doses as well as the low dose of buprenorphine, relative to placebo. The high dose of buprenorphine significantly increased SDLP relative to placebo, but the 95% CI did not exceed the BAC (0.5 mg ml−1) criterion for clinical relevance. Mean lateral position (LP) differed significantly across treatments, mainly because mean LP was lower after the low dose of buprenorphine, relative to placebo. During this treatment condition, subjects chose a lane position that was slightly left of the lane centre. Mean LP is a control measure to check if subjects adhered to the instruction of driving in the centre of the lane. The current data thus indicated that subjects did not entirely adhere to that instruction during the lower dose of buprenorphine but instead chose to drive closer to the midline of the road. One can only speculate that the choice to drive closer to the middle line reflects risk‐taking behaviour, a strategy for road tracking or other motivations. Driving impairment was sometimes noticeable at the individual level across treatment conditions. Four participants (18%) decided to prematurely finish their driving tests while under the influence of buprenorphine (on three occasions) and methadone (on two occasions) because of sleepiness while driving. This indicates large inter‐individual variations in driving performance of patients who receive opioid treatment, some of whom might be impaired whilst most are not. Individual differences in impairment levels might be associated to individual differences in drug concentrations, drug sensitivity and the presence of side effects that may affect driving.
In contrast to the sparse impairments observed in the driving tests, all of the cognitive and psychomotor tests showed dose‐related impairment during opioid treatment conditions as compared to placebo. Seven cognitive tests were included to measure skills related to driving, such as psychomotor speed (CTT, PVT, DSST, DAT), divided attention (DAT, UFOV), sustained attention (PVT), reaction speed (DTS1) and postural balance (PBT). The high doses of buprenorphine and methadone impaired performance in almost every cognitive test. The low doses of buprenorphine and methadone, on the other hand, only affected some parameters in the PBT, DAT and PVT and in the PBT, respectively. These findings are in line with previous research showing that methadone and buprenorphine can impair reaction time and attention 18. For several tasks, a significant Treatment × Time interaction was observed indicating that opioid effects were more pronounced at 6 h post administration as compared to 2 h. This suggests that impairments levels may increase with increasing time on task due to tiredness. Participants indeed felt less alert and more sleepy during the final part of the test schedule.
Buprenorphine and methadone furthermore increased sleepiness, ratings of clinical impairment and reduced alertness and contentedness. Well‐known side effects of opioid use such as nausea and vomiting, sleepiness/tiredness and dizziness were frequently observed, and pronounced in some subjects. Concentration problems were reported by one subject only in the high dose buprenorphine condition. Two participants reported to experience euphoria, in the methadone condition. Frequently reported side effects such as sleepiness and reduced alertness might have contributed significantly to impairments of driving and neurocognitive function that were observed after both opioids.
Impairments observed during on‐road driving and during neurocognitive testing in the present study are not necessarily inconsistent. Impairments of neurocognitive test performance and on‐road driving were most prominent after the high dose of both opioids and virtually absent for the low dose. The impaired driving observed after the high dose of buprenorphine was less than that observed while driving with a BAC of 0.5 mg ml−1. Likewise, when compared to alcohol, neurocognitive impairment observed in the DSST and DAT (i.e. reaction time) in the present study were equivalent to impairments previously observed at BACs between 0.2 and 0.8 mg ml−1 45. It has been demonstrated that the presence or absence of impairments in neurocognitive tests are relatively poor predictors of drug effects in the on‐road test 46, 47. In part, the lack of correlation between drug‐induced impairment during on‐road and neurocognitive performance might be explained by a lack of overlap in their underlying cognitive domains 20. The SDLP of the on‐road driving test primarily measures sustained attention and road tracking performance. As such, it measures operational performance that is highly overlearned and automated and which does not require higher order cognitive control that one typically observes during complex task performance as assessed with neurocognitive tasks of executive function 20, 48. Alternatively, participants in the present study may have been able to compensate for their level of drowsiness to some degree when confronted with real‐life risk situations such as driving in traffic. The need to compensate is less urgent when performing neurocognitive tests in a laboratory setting.
A number of limitations of the current study should be considered. The driving tests were performed at the time at which the maximum concentration of drug in blood (T max) is observed during the methadone conditions but slightly after the expected T max during buprenorphine. This could imply that driving impairment observed after buprenorphine might have been more pronounced when measured at T max. However, buprenorphine concentrations assessed prior to driving were very much in the range of the expected maximum concentration in blood (C max), which indicates that the present buprenorphine data do represent impairment levels at maximal buprenorphine concentrations. In addition, many subjects suffered from adverse events that sometimes prevented data from being collected. Driving impairment in tests that were stopped prematurely might have progressively increased if the test had continued. Likewise, a number of cognitive tasks were never conducted because subjects were unable to perform the task. None of these ‘missing’ data contributed to performance measures that were established in this study. This could mean that the impairment levels observed in the present study might be an underestimation of impairment levels that can be expected in real life.
We conclude that overall, the influence of single analgesic doses of buprenorphine and methadone on actual driving performance were mild. Cognitive functions were somewhat more affected. At the group level, impairment was most evident following the high dose of buprenorphine but its magnitude was below the BAC (0.5 mg ml−1) criterion threshold of clinical relevance. For both drugs, more pronounced effects were found after the higher dose. At the individual level, however, four participants felt unsafe and discontinued their driving test while under the influence of buprenorphine or methadone. Based on these findings it is therefore impossible to state that use of buprenorphine and methadone will not impair driving in any patient. Consequently, patients should always be informed about the potential driving impairment that might be caused by buprenorphine and methadone.
Competing Interests
There are no competing interests to declare.
The authors would like to thank Nadia Hutten for her contribution to the data collection and Håvard Furuhaugen for performing the analysis of the blood samples. We would also like to thank all participants as well as Anita van Oers, Irma Brauers, Henk Brauers and Cees van Leeuwen. This study was sponsored by the Norwegian Ministry of Transport and Communications.
Strand, M. C. , Vindenes, V. , Gjerde, H. , Mørland, J. G. , and Ramaekers, J. G. (2019) A clinical trial on the acute effects of methadone and buprenorphine on actual driving and cognitive function of healthy volunteers. Br J Clin Pharmacol, 85: 442–453. 10.1111/bcp.13818.
References
- 1. International Narcotics Control Board , Supply of opiate raw materials and demand for opiates for medical and scientific purposes. International Narcotics Control Board, 2018.
- 2. Centers for Disease Control and Prevention . Drug Overdose Death Data, 2018. Available at https://www.cdc.gov/drugoverdose/data/statedeaths.html (last accessed 14 June 2018).
- 3. Government of Canada . Apparent opioid‐related deaths, 2018. Available at https://www.canada.ca/en/health‐canada/services/substance‐abuse/prescription‐drug‐abuse/opioids/apparent‐opioid‐related‐deaths.html (last accessed 2 June 2018).
- 4. Gjerde H, Strand MC, Mørland J. Driving under the influence of non‐alcohol drugs – an update. Part I: epidemiological studies. Forensic Sci Rev 2015; 27: 89–113. [PubMed] [Google Scholar]
- 5. Schulze H, Schumacher M, Urmeew R, Auerbach K. DRUID‐Driving under the Influence of Drugs, Alcohol and Medicines. Final Report: Work performed, main results and recommendations. 6th Framework Programme Deliverable (0.1.8), 2012.
- 6. Rusmiddelstatistikk . Funn i blodprøver hos bilførere mistenkt for påvirket kjøring 2017. Oslo: Oslo University Hospital, 2018. [Google Scholar]
- 7. The Norwegian Institute of Public Health . The Norwegian Prescription Database (NorPD). Available at http://www.norpd.no/ (last accessed 2 February 2018).
- 8. International Narcotics Control Board , Narcotic Drugs: Estimated World Requirements for 2018 – Statistics for 2016. Vienna: INCB, 2018.
- 9. Strand MC, Gjerde H, Morland J. Driving under the influence of non‐alcohol drugs – an update. Part II: Experimental studies. Forensic Sci Rev 2016; 28: 79–101. [PubMed] [Google Scholar]
- 10. Jensen ML, Sjogren P, Upton RN, Foster DJ, Bonde P, Graae C, et al Pharmacokinetic‐pharmacodynamic relationships of cognitive and psychomotor effects of intravenous buprenorphine infusion in human volunteers. Basic Clin Pharmacol Toxicol 2008; 103: 94–101. [DOI] [PubMed] [Google Scholar]
- 11. MacDonald FC, Gough KJ, Nicoll RA, Dow RJ. Psychomotor effects of ketorolac in comparison with buprenorphine and diclofenac. BrJ Clin Pharmacol 1989; 27: 453–459. [DOI] [PMC free article] [PubMed] [Google Scholar]
- 12. Manner T, Kanto J, Salonen M. Simple devices in differentiating the effects of buprenorphine and fentanyl in healthy volunteers. EurJ Clin Pharmacol 1987; 31: 673–676. [DOI] [PubMed] [Google Scholar]
- 13. Rothenberg S, Schottenfeld S, Gross K, Selkoe D. Specific oculomotor deficit after acute methadone. I Saccadic eye movements. Psychopharmacology (Berl) 1980; 67: 221–227. [DOI] [PubMed] [Google Scholar]
- 14. Rothenberg S, Schottenfeld S, Meyer RE, Krauss B, Gross K. Performance differences between addicts and non‐addicts. Psychopharmacology (Berl) 1977; 52: 299–306. [DOI] [PubMed] [Google Scholar]
- 15. Rothenberg S, Schottenfeld S, Selkoe D, Gross K. Specific oculomotor deficit after acute methadone. II Smooth pursuit eye movements. Psychopharmacology (Berl) 1980; 67: 229–234. [DOI] [PubMed] [Google Scholar]
- 16. Saarialho‐Kere U, Mattila MJ, Paloheimo M, Seppala T. Psychomotor, respiratory and neuroendocrinological effects of buprenorphine and amitriptyline in healthy volunteers. Eur J Clin Pharmacol 1987; 33: 139–146. [DOI] [PubMed] [Google Scholar]
- 17. Zacny JP, Conley K, Galinkin J. Comparing the subjective, psychomotor and physiological effects of intravenous buprenorphine and morphine in healthy volunteers. J Pharmacol Exp Ther 1997; 282: 1187–1197. [PubMed] [Google Scholar]
- 18. Strand MC, Fjeld B, Arnestad M, Mørland J. Can patients receiving opioid maintenance therapy safely drive? A systematic review of epidemiological and experimental studies on driving ability with a focus on concomitant methadone or buprenorphine administration. Traffic Inj Prev 2013; 14: 26–38. [DOI] [PubMed] [Google Scholar]
- 19. Jongen S, Vuurman EF, Ramaekers JG, Vermeeren A. The sensitivity of laboratory tests assessing driving related skills to dose‐related impairment of alcohol: a literature review. Accid Anal Prev 2016; 89: 31–48. [DOI] [PubMed] [Google Scholar]
- 20. Walsh JM, Verstraete AG, Huestis MA, Morland J. Guidelines for research on drugged driving. Addiction 2008; 103: 1258–1268. [DOI] [PMC free article] [PubMed] [Google Scholar]
- 21. Ramaekers JG. Drugs and driving research in medicinal drug development. Trends Pharmacol Sci 2017; 38: 319–321. [DOI] [PubMed] [Google Scholar]
- 22. Vuurman EF, Muntjewerff ND, Uiterwijk MM, van Veggel LM, Crevoisier C, Haglund L, et al Effects of mefloquine alone and with alcohol on psychomotor and driving performance. Eur J Clin Pharmacol 1996; 50: 475–482. [DOI] [PubMed] [Google Scholar]
- 23. Jongen S, Vermeeren A, van der Sluiszen NN, Schumacher MB, Theunissen EL, Kuypers KP, et al A pooled analysis of on‐the‐road highway driving studies in actual traffic measuring standard deviation of lateral position (i.e., ‘weaving’) while driving at a blood alcohol concentration of 0.5 g/L. Psychopharmacology (Berl) 2017; 234: 837–844. [DOI] [PMC free article] [PubMed] [Google Scholar]
- 24. Schumacher MB, Jongen S, Knoche A, Petzke F, Vuurman EF, Vollrath M, et al Effect of chronic opioid therapy on actual driving performance in non‐cancer pain patients. Psychopharmacology (Berl) 2017; 234: 989–999. [DOI] [PubMed] [Google Scholar]
- 25. Zacny JP, James P. A review of the effects of opioids on psychomotor and cognitive functioning in humans. Exp Clin Psychopharmacol 1995; 3: 432–466. [Google Scholar]
- 26. van der Mulder‐Hajonides Meulen WREH, Van den Hoofdakker RH, eds. The Groningen Sleep Quality Scale. The 14th CINP Congress, 1984; Florence.
- 27. O'Hanlon JF, Haak TW, Blaauw GJ, Riemersma JB. Diazepam impairs lateral position control in highway driving. Science 1982; 217: 79–81. [DOI] [PubMed] [Google Scholar]
- 28. O'Hanlon JF. Driving performance under the influence of drugs: rationale for, and application of, a new test. Br J Clin Pharmacol 1984; 18 (Suppl. 1): 121S–129S. [DOI] [PMC free article] [PubMed] [Google Scholar]
- 29. Loh S, Lamond N, Dorrian J, Roach G, Dawson D. The validity of psychomotor vigilance tasks of less than 10‐minute duration. Behav Res Methods Instrum Comput 2004; 36: 339–346. [DOI] [PubMed] [Google Scholar]
- 30. Jex HR, McDonnell JD, Phatak AV. A ‘critical’ tracking task for man‐machine research related to the operator's effective delay time. I. Theory and experiments with a first‐order divergent controlled element. NASA CR‐616. NASA Contract Rep NASA CR 1966; 1–105. [PubMed] [Google Scholar]
- 31. Moskowitz H. Laboratory studies of the effects of alcohol on some variables related to driving. J Safety Res 1973; 5: 185–199. [Google Scholar]
- 32. Ball K, Owsley C. The useful field of view test: a new technique for evaluating age‐related declines in visual function. J Am Optom Assoc 1993; 64: 71–79. [PubMed] [Google Scholar]
- 33. McLeod DR, Griffiths RR, Bigelow GE, Yingling J. An automated version of the digit symbol substitution test (DSST). Behav Res Methods Instrum 1982; 14: 463–466. [Google Scholar]
- 34. Leufkens TR, Lund JS, Vermeeren A. Highway driving performance and cognitive functioning the morning after bedtime and middle‐of‐the‐night use of gaboxadol, zopiclone and zolpidem. J Sleep Res 2009; 18: 387–396. [DOI] [PubMed] [Google Scholar]
- 35. Mets MA, Volkerts ER, Olivier B, Verster JC. Effect of hypnotic drugs on body balance and standing steadiness. Sleep Med Rev 2010; 14: 259–267. [DOI] [PubMed] [Google Scholar]
- 36. Mets MA, de Vries JM, de Senerpont Domis LM, Volkerts ER, Olivier B, Verster JC. Next‐day effects of ramelteon (8 mg), zopiclone (7.5 mg), and placebo on highway driving performance, memory functioning, psychomotor performance, and mood in healthy adult subjects. Sleep 2011; 34: 1327–1334. [DOI] [PMC free article] [PubMed] [Google Scholar]
- 37. Hjelmeland K, Gustavsen I, Bernard JP, Morland J. Can a simple clinical test detect impairment of zopiclone and alcohol? A randomized controlled trial. Forensic Sci Int 2015; 248: 129–133. [DOI] [PubMed] [Google Scholar]
- 38. Bramness JG, Skurtveit S, Morland J. Clinical impairment of benzodiazepines – relation between benzodiazepine concentrations and impairment in apprehended drivers. Drug Alcohol Depend 2002; 68: 131–141. [DOI] [PubMed] [Google Scholar]
- 39. Bond A, Lader M. The use of analogue scales in rating subjective feelings. Br J Med Psychol 1974; 47: 211–218. [Google Scholar]
- 40. Akerstedt T, Gillberg M. Subjective and objective sleepiness in the active individual. Int J Neurosci 1990; 52: 29–37. [DOI] [PubMed] [Google Scholar]
- 41. Reyner LA, Horne JA. Falling asleep whilst driving: are drivers aware of prior sleepiness? Int J Leg Med 1998; 111: 120–123. [DOI] [PubMed] [Google Scholar]
- 42. Kristoffersen L, Langødegård M, Gaare KI, Amundsen I, Nilsen M, Strand DH. Determination of 12 commonly found compounds in DUID cases in whole blood using fully automated supported liquid extraction and UHPLC‐MS/MS. J Chromatogr B 2018; 1093–1094: 8–23. [DOI] [PubMed] [Google Scholar]
- 43. Harding SD, Sharman JL, Faccenda E, Southan C, Pawson AJ, Ireland S, et al The IUPHAR/BPS Guide to PHARMACOLOGY in 2018: updates and expansion to encompass the new guide to IMMUNOPHARMACOLOGY. Nucl Acids Res 2017; 46: D1091–D1106. [DOI] [PMC free article] [PubMed] [Google Scholar]
- 44. Alexander SP, Christopoulos A, Davenport AP, Kelly E, Marrion NV, Peters JA, et al The Concise Guide to PHARMACOLOGY 2017/18: G protein‐coupled receptors. Br J Pharmacol 2017; 174: S17–S129. [DOI] [PMC free article] [PubMed] [Google Scholar]
- 45. Jongen S, Vuurman E, Ramaekers J, Vermeeren A. Alcohol calibration of tests measuring skills related to car driving. Psychopharmacology (Berl) 2014; 231: 2435–2447. [DOI] [PMC free article] [PubMed] [Google Scholar]
- 46. Ramaekers JG. Antidepressants and driver impairment: Empirical evidence from a standard on‐the‐road test. J Clin Psychiatry 2003; 64: 20–29. [PubMed] [Google Scholar]
- 47. Verster JC, Roth T. Predicting psychopharmacological drug effects on actual driving performance (SDLP) from psychometric tests measuring driving‐related skills. Psychopharmacology (Berl) 2012; 220: 293–301. [DOI] [PMC free article] [PubMed] [Google Scholar]
- 48. Michon JA. A critical view of driver behavior models: what do we know, what should we do? In: Human Behavior and Traffic Safety, eds Evans L, Schwing RC. Springer, Boston, MA: Springer, 1985; 485–524. [Google Scholar]