

Abstract
Bscl2−/− mice recapitulate many of the major metabolic manifestations in Berardinelli-Seip congenital lipodystrophy type 2 (BSCL2) individuals, including lipodystrophy, hepatosteatosis, muscular hypertrophy, and insulin resistance. Metabolic defects in Bscl2−/− mice with regard to glucose and lipid metabolism in skeletal muscle have never been investigated. Here, we identified Bscl2−/− mice displayed reduced intramyocellular triglyceride (IMTG) content but increased glycogen storage predominantly in oxidative type I soleus muscle (SM). These changes were associated with increased incomplete fatty acid oxidation and glycogen synthesis. Interestingly, SM in Bscl2−/− mice demonstrated a fasting duration induced insulin sensitivity which was further confirmed by hyperinsulinemic-euglycemic clamp in SM of overnight fasted Bscl2−/− mice but reversed by raising circulating NEFA levels through intralipid infusion. Furthermore, mice with skeletal muscle-specific inactivation of BSCL2 manifested no changes in muscle deposition of lipids and glycogen, suggesting BSCL2 does not play a cell-autonomous role in muscle lipid and glucose homeostasis. Our study uncovers a novel link between muscle metabolic defects and insulin resistance, and underscores an important role of circulating NEFA in regulating oxidative muscle insulin signaling in BSCL2 lipodystrophy.
Keywords: skeletal muscle, insulin resistance, hyperinsulinemic-euglycemic clamp, BSCL2, lipodystrophy
1. Introduction
Skeletal muscle represents a major insulin active organ that accounts for 80-90% of insulin-stimulated glucose uptake from circulation. It is also a major site of fatty acid (FA) uptake and oxidation with lipid catabolism supplying approximately 70% of the energy requirement for resting muscle. Skeletal muscle is composed of different fiber types which vary in their insulin mediated glucose metabolism, fuel storage and utilization. Type I “oxidative” myofibers possess most intramyocellular triglyceride (IMTG) and greater fatty acid oxidation (FAO) capacity, and appear to be inherently more insulin sensitive than type II “glycolytic” myofibers (Bassel-Duby and Olson, 2006,Shaw, Shepherd, Wagenmakers et al., 2012). Insulin resistance is a core defect in obesity, lipodystrophy and type 2 diabetes. Research over the past three decades has established a compelling connection between aberrant lipid and glucose metabolism and muscle insulin resistance in obesity and type 2 diabetes (Shulman, 2004,Holland, Brozinick, Wang et al., 2007,Yu, Chen, Cline et al., 2002). In lipodystrophy, elevated muscle triglyceride content was shown to be associated with insulin resistance in A-ZIP/F-1 fatless (Kim, Gavrilova, Chen et al., 2000). However, excess of lipid accumulation was not consistently observed in muscle of patients with Dunnigan-type familial partial lipodystrophy (FPLD) (Boschmann, Engeli, Moro et al., 2010,Vantyghem, Pigny, Maurage et al., 2004). Examination of muscle biopsies from human PTRF linked generalized lipodystrophy also fails to identify an increase in IMTG (Hayashi, Matsuda, Ogawa et al., 2009). The link between muscle metabolic deviation and insulin resistance in lipodystrophy needs to be further studied.
Congenital generalized lipodystrophy (CGL), also called Berardinelli-Seip congenital lipodystrophy (BSCL), is a rare autosomal recessive disorder characterized by a near total absence of body fat from birth or infancy, associated with a prominent muscular appearance and enlarged internal organs (Berardinelli, 1954,Seip and Trygstad, 1996). Affected individuals develop metabolic abnormalities that include hyperinsulinemia, hypertriglyceridemia, insulin resistance and type 2 diabetes (Garg, 2011). Mutations in human BSCL2 (also called Seipin) gene underlie type 2 BSCL (Magre, Delepine, Khallouf et al., 2001). Four independent groups (including ours) have generated Bscl2-knockout (Bscl2−/−) mice, which recapitulate most of the metabolic manifestations including hyperinsulinemia, insulin resistance and hepatosteatosis in type 2 BSCL patients (Cui, Wang, Tang et al., 2011,Chen, Chang, Saha et al., 2012,Prieur, Dollet, Takahashi et al., 2013,McIlroy, Suchacki, Roelofs et al., 2018). Various mechanisms whereby lack of BSCL2 leads to lipodystrophy have been proposed. Specifically in rodents, BSCL2 was reported to be involved in regulating phospholipid metabolism and PPARγ activity (Liu, Jiang, Wang et al., 2014) potentially through interacting with glycerol-3-phosphate acyltransferase (GPAT) (Pagac, Cooper, Qi et al., 2016). Our own work has consistently demonstrated an essential role of BSCL2 in regulating PKA-mediated lipolysis thus adipocyte differentiation and maturation (Chen et al., 2012). Interestingly, in contrast to other lipodystrophic animal models such as A-ZIP/F-1 (Moitra, Mason, Olive et al., 1998), aP2-SREBP-1c (Shimomura, Hammer, Richardson et al., 1998) and Agpat2−/− (Cortes, Curtis, Sukumaran et al., 2009) mice, Bscl2−/− mice demonstrate unique metabolic phenotypes highlighted by lack of overt fasting hyperglycemia and hypertriglyceridemia. Instead, a 4-hour short fast leads to lower plasma levels of glucose, triglyceride (TG), nonesterified free fatty acids (NEFA) and glycerol, with the latter three further decreased after an overnight fast as compared to those in wild-type mice (Chen et al., 2012,Prieur et al., 2013). These unique metabolic phenotypes suggest a markedly different regulation of glucose and lipid metabolism in lipodystrophic Bscl2−/− mice.
Impaired glycogen synthesis and accumulation of intramyocellular triglyceride (IMTG) have been implicated in the pathogenesis of muscle insulin resistance (DeFronzo and Tripathy, 2009,Dohm, Tapscott, Pories et al., 1988). Prior work has demonstrated severe insulin resistance after a short fast but an acutely improved insulin action after a prolonged fast in lipodystrophic Bscl2−/− mice (Chen, Zhou, Saha et al., 2014). Notably, Bscl2−/− mice present prominent muscular features and contain 117% more lean muscle mass as compared to the wild-type (Chen et al., 2012). However, the metabolic activity and insulin action in skeletal muscle of lipodystrophic Bscl2−/− mice remain largely uncharacterized. It is also not known whether BSCL2 plays a cell-autonomous role in regulating skeletal muscle fuel metabolism and whole-body insulin resistance.
In this study, we dissected the molecular underpinnings of metabolic adaptations and the effect of fasting duration on insulin action in different muscle fiber types of Bscl2−/− mice under the fed, short-term, and prolonged fasting states. We also generated mice with skeletal muscle-specific deletion of BSCL2 to study the possible autonomous role of BSCL2 in skeletal muscle metabolism. Our experiments documented the absence of any significant abnormalities in muscle lipid and glucose homeostasis in mice with striated muscle-specific deletion of BSCL2. Instead, we uncovered reduced IMTG and elevated glycogen accumulation which were associated with enhanced β-oxidation and glycogen synthesis in oxidative muscle of fed Bscl2−/− mice. We further identified an unusual modification of oxidative muscle FAO and insulin sensitivity by circulating NEFA levels in global Bscl2−/− mice.
2. Materials and Methods
2.1. Mice
Global Bscl2−/− mice (backcrossed to C57BL/6J for 5 generations) and Bscl2f/f mice (backcrossed to C57BL/6J for 8 generations) were previously generated in the lab (Chen et al., 2012). Striated muscle-specific Bscl2 deficient mice (i.e. Bscl2Mck−/−) were generated by crossing Bscl2f/f mice with Mck-Cre transgenic mice (Jackson Laboratory stock#:8154). Bscl2f/f littermates were used as control (Ctrl). All mice were fed with a chow diet and maintained under standard conditions with controlled 12 h / 12 h light-dark cycle and 21 °C room temperature. Mice were sacrificed under fed condition at 4:00 pm or after 4-6 h fast (9:00 am-1-3:00 pm) [4 h fast (4hF) was used throughout the text considering the negligible differences between 4 h and 6 h fasting] or overnight 16 h fast (16hF, 5:00 pm to 9:00 am). Male mice were mainly used. Similar data were obtained in female mice. All animal experiments were done using protocols approved by the IACUC at Augusta University.
2.2. Hyperinsulinemic-euglycemic clamp with or without intralipid/heparin infusion
Hyperinsulinemic-euglycemic clamps on conscious male Bscl2−/− mice after a 16 h fast were previously reported (Chen et al., 2014). For tissue specific uptake, we injected a bolus (10 μCi) of 2-deoxy-D-[1,-14C] glucose (2-[14C]DG; NEN Life Science Products Inc.) at the end of 2 h hyperinsulinemic-euglycemic clamp for an additional 45 min. Tissues were taken and snap-frozen in liquid nitrogen, and stored at −80 °C for analysis. Glucose uptake in soleus muscle (SM) and gastrocnemius muscle (GM) was calculated from plasma 2-[14C]DG profile fitted with double exponential curve and tissue content of 2-[14C]DG-6-P as previously described (Kraegen, James, Jenkins et al., 1985). Muscle insulin sensitivity after clamp was further analyzed by western blot.
Lipid infusion to increase circulating NEFA followed by hyperinsulinemic-euglycemic clamp was performed in Bscl2−/− mice as previously described (Kim, Shulman and Kahn, 2002). Briefly, at t = −240 min, two groups of overnight (16hF) fasted Bscl2−/− mice were preinfused with saline/heparin or intralipid (20% emulsion, I141 Sigma) combined with heparin (1:3 v/v). A primed-continuous infusion of [3-3H] glucose (10-μCi bolus and 0.1 μCi/ min infusion) was started at t = −120 min. The insulin clamp was begun at t = 0 min with a continuous infusion of human insulin (2.5 mU/kg/min Humulin R; Eli Lilly, Indianapolis, IN). 2-deoxy-D-[1,−14C] glucose was injected at t = 120 min for an additional 45 min. Tissue specific glucose uptake was measured as above. Saline/heparin or lipid/heparin infusion was continued throughout the experiment. Blood glucose levels were monitored with an OneTouch UltraSmart blood glucose monitoring system (Life Scan). Plasma NEFA (Wako) was measured colorimetrically. Insulin levels were determined from samples obtained at t = 0 and 120 min by enzyme-linked immunosorbent assays according to the instructions of the manufacturers (Mercodia). Rates of glucose infusion, glucose production, glucose disposal and glucose uptake in the muscles were compared between the two groups as previously reported (Chen et al., 2014).
2.3. Insulin tolerance test (ITT) and skeletal muscle insulin signaling analysis
ITT was performed in mice fasted for 6 h and then injected intraperitoneally (i.p.) with human insulin (Humulin, Novo Nordisk) at 0.75 U/kg. Blood glucose levels were measured by One-touch Ultra glucose meter before and at 15, 30, 60 and 120 min after injection. Skeletal muscle insulin signaling was performed on mice either fasted for 6 h (9:00 am-3:00 pm) or overnight 16 h (16 h, 5:00 pm to 9:00 am) and i.p. injected with human insulin (Humulin, Novo Nordisk) at 1.0 U/kg. Exactly 15 min later, tissues were excised and immediately snap frozen in liquid nitrogen. Protein extracts from tissues were analyzed by western blot.
2.4. Measurements of muscle metabolites and citrate synthase activity
Intramyocellular triglycerides were extracted and determined using a triglyceride assay kit (ThermoFisher Scientific) and normalized to tissue weights as previously described (Chen et al., 2014). Muscle glycogen was precipitated and quantified using a glucose HK assay (ThermoFisher Scientific) as previously described (Chen et al., 2014). Citrate synthase activity was measured using MitoCheck® Citrate Synthase Activity Assay Kit (Cayman Chemicals) as instructed and normalized to protein.
2.5. Fatty acid and glucose oxidation
Fatty acid oxidation (FAO) assays with soleus muscle homogenates were performed as previously described (Hirschey, Shimazu, Goetzman et al., 2010). Briefly, fresh soleus muscles were dissected and placed in STE buffer (1M sucrose, 10 mM Tris, pH=7.5 and 1 mM EDTA) containing a protease inhibitor and homogenized using a glass douncer (20 loose and 20 tight strokes). 20 μL tissue homogenates were incubated with 380 μL reaction buffer (100 mM sucrose, 10 mM Tris-HCl, 5 mM KH2PO4, 0.2 mM EDTA, 0.3% fatty acid-free BSA, 80 mM KCl, 1 mM MgCl2, 2 mM L-carnitine, 0.1 mM malate, 0.05 mM coenzyme A, and adjust to pH 8.0) with freshly added 1 mM DTT, 2 mM ATP, 300 μM cold BSA-conjugated palmitate and 1 μCi/mL [1-14C] palmitic acid substrate for fatty acid oxidation or 200 μM cold glucose and 0.1 μCi D-[14C(U)]-glucose/reaction for glucose oxidation. After 2.5 h incubation at 37 °C, 200 μL 1 M perchloric acid was injected into the tubes to release the [14C]CO2 which was captured by hydroamine soaked filter paper. The released [14C]CO2 was measured by scintillation counting of the filter paper, while acid-soluble metabolites (ASM) were analyzed by centrifugation and counting of 14C radioactivity in the supernatant. Data were normalized to the total protein contents for SM homogenates.
2.6. Muscle fractionation and membrane localization of glucose transporters
Soleus muscles (≈ 20 mg) were homogenized in bullet blender in Buffer A (20 mM Tris-HCl PH 7.5, 1 mM EDTA, 0.25 mM EGTA and 0.25 M sucrose) with freshly added protease and phosphatase inhibitor cocktails (Sigma). Homogenized samples were first spun at 400× g for 15 min. The supernatant was then ultracentrifuged at 105,000× g for 45 min. The sediment (membrane) fraction was resuspended in 50 μL Buffer A and then mixed with 100 μL Buffer B (Buffer A without sucrose but 2% Triton X-100). Proteins were solubilized by vortexing, quantified by BCA assay, and then used for western blot.
2.7. Immunoblot analysis
Snap frozen muscle tissues were lysed in lysis buffer containing 25 mM Tris-HCl (pH 7.4), 150 mM NaCl, 2 mM EDTA, 1% Triton X-100 and 10% glycerol with freshly added protease and phosphatase inhibitor cocktail (Sigma). The protein concentration was determined by BCA protein assay (Bio-Rad). Same amounts of protein were loaded and immunoblot analyses were carried out according to the standard protocol. Membranes were developed using the ECL chemiluminescence system and imaged by AMERSHAM Imager 600 (GE Healthcare) followed by densitometry analysis using ImageQuantTL (GE healthcare). The following antibodies were used: p-AKT-Ser473 (#4060); AKT (#9272); GLUT4 (#2213); Phospho-GSK3β (Ser9) (#9322); GSK3β (#9832) were from Cell Signaling Technology; ATGL (10006409, Cayman Chemicals); rabbit antibodies against murine PLIN2 and PLIN5 were previously reported (Chen, Chang, Wu et al., 2013); CD36 (18836-1-AP), CPT1β (22170-1-AP) and GAPDH (60004-1-IG) were from Proteintech Inc.; GLUT1 (sc-377228) and PKCϵ (sc-214) were from Santa Cruz.
2.8. Reverse transcription and real time PCR
Total RNA was isolated from tissues with TRIzol (Invitrogen) and reverse-transcribed using MLV-V reverse transcriptase using random primers (Invitrogen). Real-time quantitative RT-PCR was performed on the Stratagene MX3005. Data were normalized to 2 house-keeping genes (Ppia and β-actin) based on Genorm algorithm (medgen.ugent.be/genorm/) and expressed as fold changes relative to wild-type controls.
2.9. Statistical analysis
Quantitative data were presented as means ± SEM. Other than clamp study, in vivo animal experiments were performed on at least two independent cohorts. Differences between groups were examined for statistical significance with 2-tailed Student’s t test. A P value of less than 0.05 was considered statistically significant.
3. Results
3.1. Reduced triglyceride accumulation and increased fatty acid oxidation in skeletal muscle of nonfasted Bscl2−/− mice
In lipodystrophy, the inability to store triglycerides safely in adipocytes results in ectopic deposition of lipids in tissues such as liver (Agarwal and Garg, 2006). Like CGL2 patients, Bscl2−/− mice display severe hepatomegaly associated with steatosis (Chen et al., 2012). Their lean mass is 117% more than wild-type littermates, but it is not known whether hypertrophic muscle accumulates more IMTG in Bscl2−/− mice. We first examined the IMTG contents in oxidative SM, mixed GM and glycolytic extensor digitorum longus muscle (EDL) of fed Bscl2−/− mice. To our surprise, we found the IMTG contents in SM and GM of Bscl2−/− mice were reduced by 75% and 25% respectively as compared to wild-type mice; whereas no difference was found in EDL between two genotypes (Fig. 1A). As SM presented most reduction in IMTG, we further examined the expression of genes involved in lipid storage (Plin2, Plin5), fatty acid β-oxidation (Pparα, Acadl, Acadm, Cpt1α, Cpt1β) and a major TG lipolytic enzyme Atgl in SM. Only Plin2 mRNA level was significantly increased by 2.18 fold in SM of Bscl2−/− mice, while no changes were found in other genes (Fig. 1B). Western blot further confirmed lack of pronounced changes in CD36 (fatty acid uptake) and ATGL at their protein levels in SM of two genotypes. However, the protein expressions of PLIN2, PLIN5 and CPT1β were significantly elevated in SM of fed Bscl2−/− mice as compared to that of wild-type fed Bscl2+/+ mice (Fig. 1C and quantified in Fig. 1D). There were also a significant upregulation of PLIN2 protein and a tendency of higher expression of PLIN5 in GM of Bscl2−/− mice, albeit to a less extent (Fig. 1C and 1D). When analyzing mitochondrial β-oxidation using crude SM homogenates, we found no difference in complete FAO as judged by the release of [14C]-CO2 between Bscl2+/+ and Bscl2−/− mice under fed states (Fig. 1E). Interestingly, Bscl2−/− SM contained a 2.2 fold higher level of acid-soluble metabolites (ASM) (Fig. 1F), suggesting increased incomplete FAO. Despite the elevated FAO rate, there was no difference in mitochondrial biogenesis, since the mRNA expression of Pgclα and Tfam as well as the mitochondrial electron transport complex (ETC) components including Ndufb8 (complex I), Cycs and Cox4a (complex IV) and Atp5a1 (complex V) were comparable between two genotypes (Fig. 1G). Lack of changes in mitochondrial biogenesis was further confirmed by similar citrate synthase activities in SM between fed Bscl2+/+ and Bscl2−/− mice (Fig. 1H). These data suggest oxidative muscle of Bscl2−/− mice is more TG-deficient and associated with upregulation of incomplete FAO under fed states.
Fig. 1. Reduced triglyceride accumulation and increased fatty acid oxidation in oxidative muscle of fed Bscl2−/− mice.
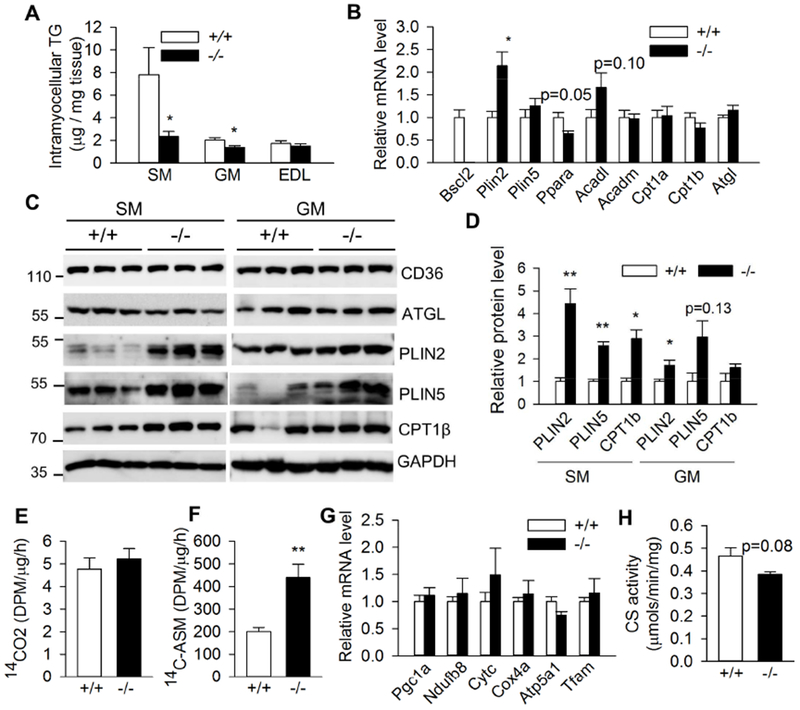
(A) Intramyocellular triglyceride (TG) contents in soleus muscle (SM), gastrocnemius muscle (GM) and extensor digitorum longus muscle (EDL) as normalized to tissue weight (n=6-8/group). (B) mRNA expression of genes involved in lipid droplet, fatty acid oxidation and lipolysis in SM (n=6/group). (C) Western blot and (D) quantification of protein expression in SM and GM (n=3/group). (E) CO2 and (F) acid-soluble metabolites (ASM) production after incubating SM crude mitochondrial fraction with 14C-palmitate (n=4/group). (G) mRNA expression of genes involved in mitochondrial biogenesis and electron transfer complex proteins and (H) citrate synthase activity in SM (n=6/group). 3 months old male Bscl2+/+ (+/+) and Bscl2−/− (−/−) mice under fed states were used in all studies. *: p< 0.05; **: p< 0.005 vs Bscl2+/+ mice.
3.2. Differential glycogen storage in skeletal muscle of lipodystrophic Bscl2−/− mice
Skeletal muscle is a major organ to store glycogen. We next measured glycogen content in various muscle types of nonfasting Bscl2+/+ and Bscl2−/− mice. As indicated in Fig. 2A, we observed significant elevation of glycogen levels in the oxidative SM and glycolytic EDL but not mixed GM of fed Bscl2−/− mice (Fig. 2A). Again, as SM demonstrated more accumulation of glycogen in Bscl2−/− mice, we specifically focused on oxidative SM to dissect the underlying mechanisms. We found the mRNA expression of genes involved in glucose transport (Glut1, Glut4) and glucose oxidation (Pdk4) was not significantly altered, despite a tendency of lower Glut1 mRNA expression in SM of fed Bscl2−/− mice (Fig. 2B). Membrane localization of GLUT1 and GLUT4 (the major muscle glucose transporter) was also comparable in SM of fed Bscl2+/+ and Bscl2−/− mice (Fig. 2C). Moreover, measurement of glucose oxidation capacity in crude SM homogenates did not identify a significant difference between two genotypes, in agreement with lack of a change in Pdk4 expression (Fig. 2D). Glycogen synthase (GS) is a key enzyme in glycogen synthesis. Insulin mediated phosphorylation at the inhibitory Ser9 phosphorylation at GSK3β inactivates its activity, thus leading to dephosphorylation and activation of GS (Friedman and Larner, 1963). Interestingly, we found elevated AKT phosphorylation at Ser473 and its downstream GSK3β inhibitory Ser9 phosphorylation in nonfasting Bscl2−/− SM (Fig. 2E and 2F). Collectively, these data highlight an increased glycogen storage in SM of fed Bscl2−/− mice which could not be attributed to the elevated glucose transport, or the impaired glucose oxidation, rather, a potential activation of GS due to inhibition of GSK3β.
Fig. 2. Differential glycogen deposition in skeletal muscles of fed Bscl2−/− mice.
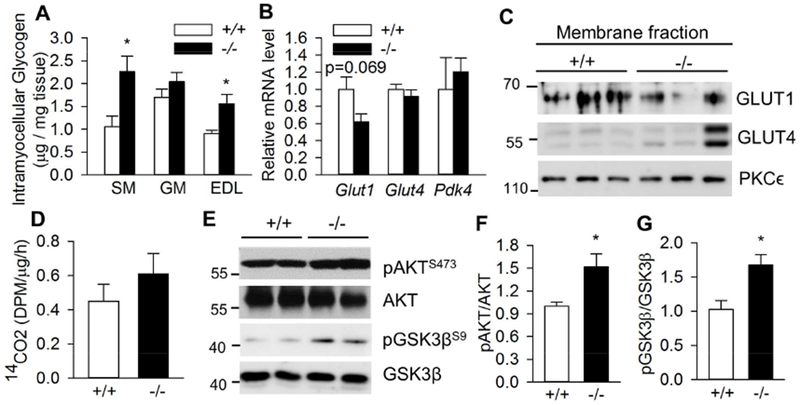
(A) Intramyocellular glycogen content as normalized to tissue weight in soleus muscle (SM), gastrocnemius muscle (GM) and extensor digitorum longus muscle (EDL), n=8/group. (B) RT-PCR analysis of genes involved in glucose transport and metabolism in SM, n=6/group. (C) Targeting of GLUT1 and GLUT4 to membrane in SM. PKCϵ was used as loading control. n=3/group. (D) Glucose oxidation assay by measuring CO2 production after incubating SM crude mitochondrial fraction with 14C-glucose, n=4/group. (E) Phosphorylation of AKT at Ser473 and GSK3β at Ser9 in SM; (F) pAKT/AKT ratio; (G) pGSK3β/GSK3β ratio, n=5/group. All experiments were performed in 13 week old male Bscl2+/+ (+/+) and Bscl2−/− (−/−) mice under fed states. *: p< 0.05.
3.3. Fasting-dependent insulin signaling in skeletal muscle of lipodystrophic Bscl2−/− mice
Previously we have demonstrated a surprising fasting duration-modulated insulin sensitivity in the liver of lipodystrophic Bscl2−/− mice (Chen et al., 2014). However, how skeletal muscle insulin signaling in Bscl2−/− mice responds to fasting is not known. Interestingly, we found basal AKT phosphorylation at Ser473 was enhanced in the SM of Bscl2−/− mice after a short 4 h fast (Fig. 3A). Upon acute insulin injection, both SM and GM in 4h-fasted Bscl2−/− mice displayed impaired insulin-mediated AKT phosphorylation (Fig. 3A-D), in agreement with the whole-body insulin resistance in 4h-fasted Bscl2−/− mice (Chen et al., 2014). However, after a prolonged overnight fasting, whereas no difference at basal AKT phosphorylation was detected, SM in Bscl2−/− mice displayed augmented response to insulin-mediated AKT phosphorylation (Fig. 3A and 3B). Prolonged fasting resulted in similar basal and insulin-mediated AKT phosphorylation in GM of Bscl2+/+ and Bscl2−/− mice (Fig. 3C-3D).
Fig. 3. Fasting-dependent insulin signaling in skeletal muscle of Bscl2−/− mice.
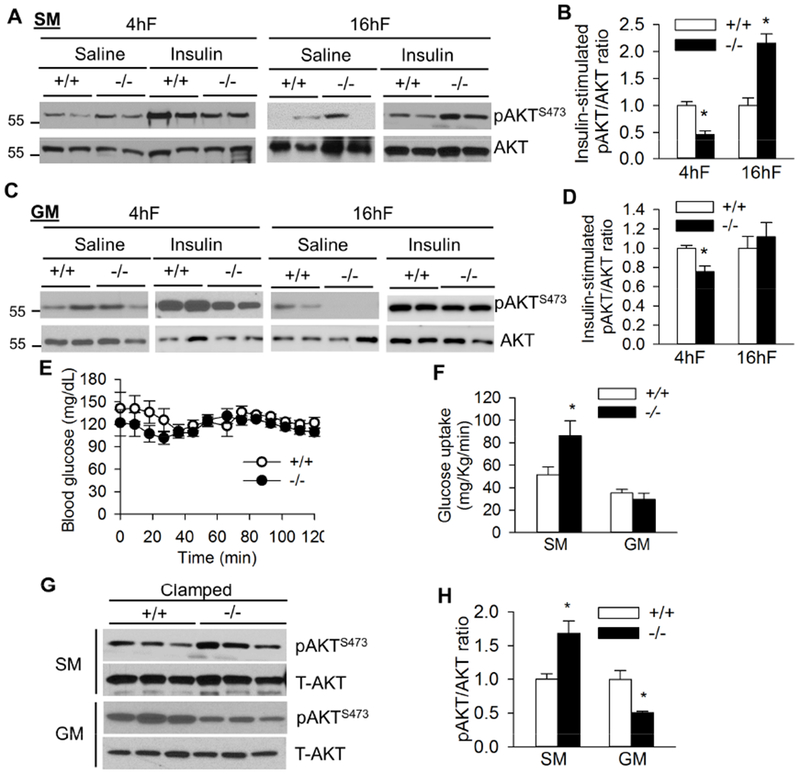
(A) Representative western blot of saline (Sal) and insulin-stimulated AKT Ser473 phosphorylation and (B) quantification of the ratio of insulin-stimulated pAKT/AKT in soleus muscle (SM). (C) Representative western blot of saline (Sal) and insulin-stimulated AKT Ser473 phosphorylation and (D) quantification of the ratio of insulin-stimulated pAKT/AKT in gastrocnemius muscle (GM). 10-13 week old male mice were injected with saline or insulin at 1 unit/kg BW by ip after 4 h fast (4hF) or overnight 16 h fast (16hF). Tissues were harvested after 15 mins. n=4/group. (E) Blood glucose during a 2 h hyperinsulinemic-euglycemic clamp and (F) glucose uptake in soleus muscle (SM) and gastrocnemius muscle (GM) of overnight (16h) fasted Bscl2+/+ (+/+) and Bscl2−/− (−/−) mice after hyperinsulinemic-euglycemic clamp. n=6/group. (G) Insulin mediated AKT Ser473 phosphorylation and (H) ratios of pAKT/AKT in SM and GM under clamp. Three representative animals were shown for each group (n=6 total). *: p< 0.05 vs Bscl2+/+ mice.
Our previous hyperinsulinemic-euglycemic clamp study has identified overnight-fasted Bscl2−/− mice are more insulin sensitive, exhibiting elevated glucose infusion and completely suppressed hepatic glucose production (Chen et al., 2014). Here, we further examined muscle glucose uptake and insulin sensitivity in the same clamped mice. We first confirmed comparable clamped blood glucose levels between the two genotypes (Fig. 3E). Not surprisingly, the glucose uptake rates of SM, but not GM, were greater in clamped Bscl2−/− mice as compared to wild-type mice (Fig. 3F), suggesting a better insulin response in the oxidative muscle of Bscl2−/− mice after a prolonged fast. Insulin-mediated AKT phosphorylation at Ser473 was 1.6-fold elevated in SM of Bscl2−/− mice under clamped conditions (Fig. 3F and quantified in Fig. 3G), in line with improved insulin sensitivity in SM of overnight-fasted Bscl2−/− mice after an acute insulin treatment (Fig. 3A-3B). Despite no change in glucose uptake rate, the overall insulin-mediated AKT phosphorylation in GM of Bscl2−/− mice was slightly downregulated (Fig. 3G-3H). Together, these data suggest prolonged fasting duration accentuates insulin signaling more potently in oxidative SM than mixed GM in Bscl2−/− mice.
3.4. Circulating NEFA regulates muscle insulin sensitivity in Bscl2−/− mice
Factors contributing to the heightened insulin sensitivity in skeletal muscle of overnight-fasted Bscl2−/− mice remain unknown. Plasma NEFA level has direct relevance in regulating muscle FAO and insulin sensitivity (Kim, Wi and Youn, 1996). Previously we have demonstrated extremely low circulating NEFA levels in overnight fasted Bscl2−/− mice as compared to Bscl2+/+ mice (Chen et al., 2012). Next, we first compared the SM mitochondrial FAO capabilities in Bscl2+/+ and Bscl2−/− mice after a prolonged fast. Similar to fed mice (Fig. 1E), we found no difference in complete FAO as judged by the release of [14C]-CO2 using crude SM homogenates from overnight fasted Bscl2+/+ and Bscl2−/− mice (Fig. 4A). However, in contrast to fed mice (Fig. 1F), the level of ASM released by Bscl2−/− SM was ≈25% lower as compared to that of Bscl2+/+ SM (Fig. 4B). This suggests the capacity of incomplete FAO in SM was diminished in response to extremely low circulating NEFA in overnight fasted Bscl2−/− mice.
Fig. 4. Altered oxidative muscle fatty acid oxidation and reversal of insulin sensitivity by intralipid infusion in overnight fasted Bscl2−/− mice.
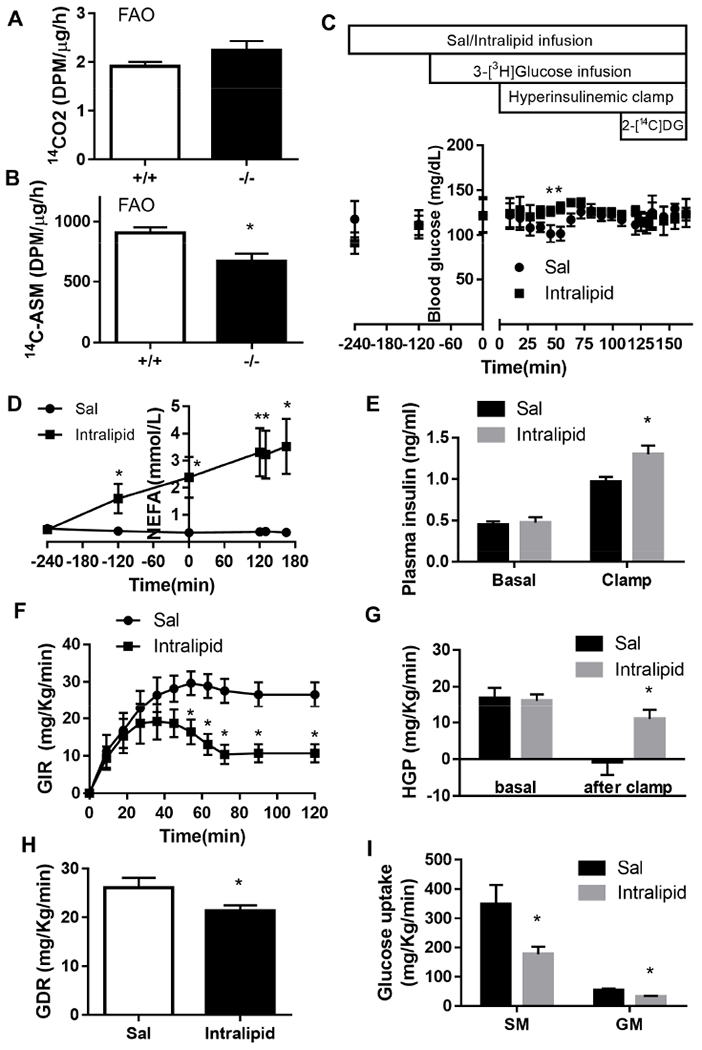
(A) CO2 and (B) acid-soluble metabolites (ASM) production after incubating 14C-palmitate with crude mitochondrial fraction isolated from SM of overnight fasted Bscl2+/+ and Bscl2−/− male mice (n=4/group). (C) A time line of procedures for saline (Sal)/intralipid infusion, basal 3-[3H] glucose infusion, hyperinsulinemic-euglycemic clamp and 2-[14C]DG injection in 13-15 weeks old male Bscl2−/− mice after an overnight (16 h) fast with blood glucose levels indicated at each stage. (D) Plasma NEFA before and during 6 h saline and intralipid infusion. (E) Basal and clamped insulin levels. (F) Glucose infusion rates (GIR) during the 120 min hyperinsulinemic-euglycemic clamp, (G) basal and clamped hepatic glucose production (HGP), (H) glucose disposal rate (GDR) and (H) glucose uptake of SM and GM after clamp. n=6 per genotype. *: p< 0.05 vs saline infused Bscl2−/− mice.
Acute lipid infusion could raise circulating fatty acids and cause insulin resistance in peripheral organs (Boden, Lebed, Schatz et al., 2001). To further test whether the extremely low circulating NEFA enhances muscle insulin sensitivity in Bscl2−/− mice, we performed saline/heparin or intralipid/heparin infusion coupled with hyperinsulinemic-euglycemic clamp in overnight-fasted Bscl2−/− mice. Blood glucose levels were maintained at similar levels in Bscl2−/− mice infused with saline or intralipid before and during the clamp (Fig. 4C). Intralipid infusion significantly raised plasma NEFA levels in Bscl2−/− mice (Fig. 4D). While basal insulin levels were comparable before clamp, steady-state clamped insulin levels in intralipid-infused Bscl2−/− mice were slightly higher as compared to those in saline-infused group. Nevertheless, intralipid infusion significantly decreased whole-body glucose infusion rate as compared to saline infusion in Bscl2−/− mice, suggesting worsened whole-body insulin sensitivity (Fig. 4E). Rates of basal glucose production were not altered among two groups (Fig. 4F). However, hepatic glucose production during clamp was highly suppressed in saline-infused but not intralipid-infused Bscl2−/− mice, suggesting impaired hepatic insulin sensitivity after intralipid infusion (Fig. 4F). Whole-body glucose disposal rates (Fig. 4G) as well as glucose uptake rates in SM and GM (Fig. 4H) were all attenuated in intralipid-infused Bscl2−/− mice, as compared to Bscl2−/− mice with saline infusion. These data emphasize that circulating NEFA level is a critical factor that modulates muscular fatty acid oxidation and insulin sensitivity in lipodystrophic Bscl2−/− mice.
3.5. BSCL2 does not play a cell-autonomous role in regulating muscle TG and glycogen metabolism
BSCL2 is expressed in skeletal muscle, albeit at a lower level compared with white adipose tissue (Chen, Yechoor, Chang et al., 2009). It is, however, not known whether BSCL2 directly mediates metabolic and insulin actions in skeletal muscle. We next generated striated muscle-specific Bscl2-knockout mice (Bscl2Mck−/−) by crossing Bscl2f/f mice with Mck-Cre transgenic mice. Bscl2f/f mice were used as control (Ctrl). There was an about 80% reduction of Bscl2 mRNA in both SM and GM of Bscl2Mck−/− mice (Fig. 5A). These mice were grossly normal with similar body weights (data not shown) and lean masses (Fig. 5B) as their Bscl2f/f counterparts.
Fig. 5. Deletion of BSCL2 in skeletal muscle does not perturb muscle mass, triglyceride and glycogen accumulation as well as insulin resistance.
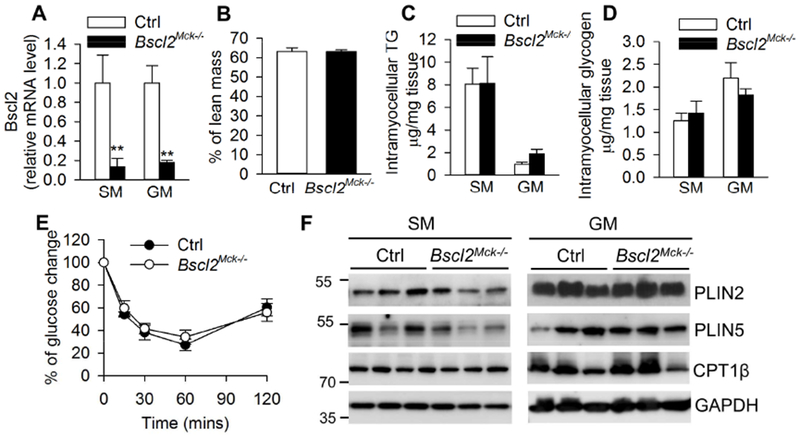
(A) RT-PCR of Bscl2 in soleus muscle (SM) and gastrocnemius muscle (GM); (B) % of lean mass; (C) intramyocellular TG and (D) glycogen contents as normalized to tissue weight; (E) insulin tolerance test; (F) protein expression in SM and GM. All experiments were performed in 4 h fasted 3 months old male Ctrl and Bscl2Mck−/− mice. n=6/group. **: p< 0.005 vs Ctrl.
In contrast with the reduced muscle IMTG contents in global Bscl2−/− mice (Fig. 1A), the IMTG contents in both SM and GM were not significantly different between Ctrl and Bscl2Mck−/− mice (Fig. 5C). The glycogen contents in SM and GM were also comparable between two genotypes (Fig. 5D). Moreover, these mice responded normally to a bolus of insulin injection, suggesting unaltered insulin sensitivity (Fig. 5E). Furthermore, there were no changes in protein expressions of PLIN2, PLIN5 and CPT1β in both SM and GM between two genotypes (Fig. 5F). These data underscore that BSCL2 does not play an autonomous role in directly mediating muscle lipid and glucose metabolism as well as insulin resistance.
4. Discussion
In this study, we for the first time identified adipose atrophy in Bscl2−/− mice did not cause ectopic deposition of fat into muscle, instead, reduced IMTG, elevated incomplete FAO and increased glycogen storage especially in oxidative muscle fibers. The oxidative muscle was insulin resistant after a short fast, but insulin sensitivity was accentuated after an overnight fast. Such changes were largely due to the prolonged circulating NEFA deficiency, as an increase in NEFA via intralipid infusion reduced insulin sensitivity within 6 h in the oxidative muscle of Bscl2−/− mice. These findings provide novel molecular mechanisms underlying skeletal muscle metabolic dysfunction in lipodystrophy.
Ectopic accumulation of fat in liver is commonly seen in patients with lipodystrophy. Lipodystrophic patients are normally associated with muscular hypertrophy. However, clinical data about muscle lipid deposition in lipodystrophic patients are scarce, with only three studies demonstrating either more or less IMTG in muscle biopsies from patients with FPLD or generalized lipodystrophy (Boschmann et al., 2010,Vantyghem et al., 2004,Hayashi et al., 2009). The A-ZIP/F-1 fatless mice contained excessive IMTG (Kim et al., 2000,Kim, Fillmore, Gavrilova et al., 2003). Interestingly, in our Bscl2−/− mice which recapitulate human BSCL2 lipodystrophy, we were not able to identify excess IMTG under both fed (Fig. 1A) and 4h fasted states (data not shown). In contrast, type I oxidative soleus muscle and mixed gastrocnemius muscle displayed reduced IMTG in fed Bscl2−/− mice (Fig. 1A). Such changes are associated with elevated incomplete FAO (as evidenced by increased ASM production) at least in SM of Bscl2−/− mice. These findings are somewhat surprising as increased incomplete FAO in skeletal muscle normally occurs in the context of increased intramyocellular lipid content and contributes to insulin resistance in obesity and type 2 diabetes (Boden et al., 2001). So far, it is not known whether SM of Bscl2−/− mice could more avidly uptake circulating NEFA under fed states which results in mitochondria overload thus higher incomplete FAO despite reduced IMTG. Notably, enhanced incomplete FAO together with lack of ectopic lipid accumulation are also observed in skeletal muscle of patients with FPLD (Boschmann et al., 2010). Thus, differences exist in muscle lipid metabolism in lipodystrophy as compared to obesity and diabetes, of which the underlying mechanisms await further clarification.
PLINs have been identified as important regulators of skeletal muscle lipid metabolism. Skeletal muscle-specific overexpression of PLIN2 and PLIN5 both increases IMTG levels without negatively impacting on insulin sensitivity (Bosma, Hesselink, Sparks et al., 2012,Bosma, Sparks, Hooiveld et al., 2013). In SM and GM of fed Bscl2−/− mice, we identified upregulation of both PLIN2 (at mRNA and protein levels) and PLIN5 (only at protein level) (Fig. 1C-1D) which persisted after a short 4 h fast (data not shown). Strikingly, such upregulation occurs in the presence of reduced IMTG, suggesting a dissociation of PLINs expression with IMTG in BSCL2 lipodystrophy. PLIN2 overexpression lowers, whereas PLIN5 overexpression promotes expression of genes involved in muscle oxidative metabolism (Bosma et al., 2013). Bscl2−/− SM exhibits enhanced oxidative metabolism highlighted by elevated CPT1β protein expression, a key step in the regulation of FAO within muscle (Bonnefont, Djouadi, Prip-Buus et al., 2004). Activation of PPARα is known to mediate PLINs and oxidative gene expression. However, we did not identify transcriptional changes in Pparα, suggesting other post-transcriptional mechanisms. Despite increased FAO, there was no reciprocal downregulation of glucose oxidation in oxidative muscle of Bscl2−/− mice (Fig. 2D). Further work are needed to dissect these paradoxical but interesting findings.
Impaired insulin-stimulated muscle glucose transport and glycogen synthesis are implicated in the pathogenesis of insulin resistance and type 2 diabetes (Shulman, 2004). Interestingly, patients with congenital generalized lipodystrophy have been reported to accumulate more glycogen in skeletal muscle (Afifi, Mire-Salman and Najjar, 1976). This was also the case in lipodystrophic Bscl2−/− mice which accumulated more glycogen in their oxidative SM and glycolytic EDL (Fig. 2A). These changes were observed mainly in hyperinsulinemic Bscl2−/− mice under fed (Fig. 2A) and 4h-fasted conditions (data not shown) (Chen et al., 2012). We postulate hyperinsulinemia causes insulin to “spill over” and act on IGF1-R, leading to elevation of basal AKT and GSK-3β phosphorylation in SM of fed and 4h-fasted Bscl2−/− mice. Inactivation of GSK-3β by phosphorylation at Ser9 is known to result in eIF2B activation and skeletal muscle hypertrophy (Schiaffino and Mammucari, 2011), suggesting a potential mechanism underlying muscle overgrowth in BSCL2 lipodystrophy. Meanwhile, inactivation of GSK3β also causes significantly elevated glycogen synthase (GS) activity and muscle deposition of glycogen (Patel, Doble, MacAulay et al., 2008). Biochemical studies are needed to confirm whether GS activity in skeletal muscle of Bscl2−/− mice is augmented. Despite no difference in glucose transporter expression and membrane targeting, we cannot exclude the possibility that muscle glucose transport rate may be higher due to glucose oversupply in hyperphagic Bscl2−/− mice under fed conditions. Moreover, over-accumulation of glycogen has been shown to cause muscle functional impairment (Testoni, Duran, Garcia-Rocha et al., 2017). Whether it affects muscle performance in Bscl2−/− mice warrants further investigation.
IMTG per se is not a marker for muscle insulin resistance. Accumulation of lipotoxic fatty acid metabolites, such as diacylglycerol (DAG), ceramide and other bioactive lipid molecules are thought to interfere with insulin signal transduction in skeletal muscle (Holland et al., 2007,Yu et al., 2002). Bscl2−/− SM and GM contain less TGs, but they are insulin resistant under short fast, suggesting a clear dissociation of muscle TG content with insulin resistance in lipodystrophic Bscl2−/− mice. While we did not directly examine skeletal muscle DAG and ceramide contents, recent studies suggest muscle accumulation of lipid-derived acylcarnitines (byproducts of incomplete β-oxidation) contributes to the development of insulin resistance (Koves, Ussher, Noland et al., 2008). Enhanced incomplete FAO and accumulation of acylcarnitine metabolites are also observed in insulin resistant patients with FPLD (Boschmann et al., 2010). Interestingly, incomplete FAO was obviously higher in insulin-resistant SM of nonfasting Bscl2−/− mice (Fig. 1F) but notably lower in insulin-sensitive SM of overnight-fasted Bscl2−/− mice (Fig. 4B). Thus, it is highly plausible that incomplete FAO contributes to the development of oxidative muscle insulin resistance in Bscl2−/− mice in spite of reduced IMTG. Detailed muscle lipidomic studies of acylcarnitine metabolites will be of help in supporting this hypothesis.
Before clamp, plasma insulin levels in Bscl2+/+ and Bscl2−/− mice were similar after an overnight fast (Chen et al., 2012). Unfortunately, we did not directly compare the clamped insulin levels between two genotypes in our first hyperinsulinemic-euglycemic clamp study. This renders it hard to interpret whether the enhanced glucose uptake observed in SM of Bscl2−/− mice (Fig. 3F) is due to the elevated insulin signaling per se. Interestingly, we also observed similar whole body glucose disposal in Bscl2+/+ and Bscl2−/− mice (Chen et al., 2014) despite the increased glucose uptake in SM of Bscl2−/− mice (Fig. 3B). The residual white and brown adipose tissue of Bscl2−/− mice exhibited higher glucose uptake rates (data not shown). However, the insulin resistant GM of Bscl2−/− mice displayed a tendency of lower glucose uptake; whereas the glucose uptake rates of other muscle types such as heart, tibialis anterior muscle and EDL were not measured. Given that the glucose uptake rate was presented as per kilogram tissue, the extremely low masses of insulin sensitive adipose tissue and soleus muscle in the face of increased masses of other potentially insulin resistant muscles in Bscl2−/− mice may ultimately result in an insignificant change of whole-body glucose disposal.
Elevated NEFA level in energy excess states such as obesity contributes to peripheral insulin resistance (Lewis, Carpentier, Adeli et al., 2002), whereas reduction in circulating NEFA in response to treatment with insulin sensitizers such as thiazolidinediones (TZDs) (Lebovitz and Banerji, 2001) or weight loss (Viljanen, Iozzo, Borra et al., 2009,Goodpaster, Kelley, Wing et al., 1999) is associated with amelioration of insulin resistance. Our study using the unique Bscl2−/− mice for the first time tested the opposite scenario of the Randle cycle: when circulating NEFA is extremely low, it necessitates glucose uptake to push the organism to improve insulin signaling. Prolonged fasting accentuated insulin signaling in liver (Chen et al., 2014) and SM (Fig. 3). Lipid infusion in humans (Boden and Chen, 1995); and in rats (Kim et al., 1996,Clerk, Rattigan and Clark, 2002) gives rise to insulin resistance in muscle. Similarly, lipid infusion clearly reversed insulin sensitivity of both liver and SM and further worsened insulin resistance of GM in lipodystrophic Bscl2−/− mice (Fig. 4). These data underscore the importance of circulating NEFA level as a key contributor of whole-body insulin resistance in both obesity and lipodystrophy. It also suggests dietary restriction, presumably by lowing circulating NEFA, could prevent muscle insulin resistance in lipodystrophy. Notably, we observed more marked changes in fasting-dependent and lipid-moderated insulin resistance with Type I oxidative muscle fiber, which could be attributed to its intrinsic susceptibility to lipid toxicity (Coen and Goodpaster, 2012).
Upregulations of PLINs and FAO have been demonstrated in BSCL2-deleted differentiating and mature adipocytes (Chen et al., 2012,Zhou, Lei, Benson et al., 2015). This indicates a probably intrinsic role of BSCL2 in regulating FAO in even non-adipocytes such as skeletal muscle. However, further generation of mice with striated muscle-specific deletion of BSCL2 did not support this notion (Fig. 5), suggesting elevations in muscle lipid oxidation in Bscl2−/− mice is probably secondary to lipodystrophy. Exactly how lipodystrophy provokes fatty acid catabolism in muscle remains to be further investigated. These studies likely provide more hints about the adipomuscular axis in leading to metabolic abnormalities.
5. Conclusion
Our study links BSCL2 lipodystrophy to reduced IMTG but excess glycogen in hypertrophic skeletal muscle. We propose that enhanced incomplete FAO in oxidative muscle of Bscl2−/− mice results in muscle insulin resistance, while hyperinsulinemia may trigger excessive muscle glycogen synthesis and growth. Moreover, circulating NEFA level in BSCL2 lipodystrophy is a key determinant of oxidative muscle insulin sensitivity and glucose uptake. These findings provide novel insights into metabolic dysregulation of skeletal muscle in BSCL2 lipodystrophy. ,
Highlights.
Lipodystrophic Bscl2−/− mice display reduced triglyceride accumulation in skeletal muscle.
Fatty acid oxidation in oxidative soleus muscle of fed Bscl2−/− mice is enhanced.
Lipodystrophic Bscl2−/− mice exhibit increased glycogen storage in skeletal muscle.
Prolonged fasting sensitizes insulin sensitivity in oxidative soleus muscle of Bscl2−/− mice.
Intralipid infusion mitigates muscle insulin sensitivity in Bscl2−/− mice after a prolonged fasting.
BSCL2 does not play a cell-autonomous role in skeletal muscle triglyceride and glycogen metabolism
Acknowledgments
Funding
This work was supported by National Heart, Lung and Blood Institute (1R01HL132182-01 to W. C.), the American Heart Association Grant-in-aid (16GRNT30680004 to W.C.), the American Heart Association Career Development Award (18CDA34080244 to H.Z.) and the State Scholarship Fund of China (CSC. No. 201708370007 to H. X.). Mouse Metabolic Phenotyping Core (MMPC) at Baylor College of Medicine was supported by National Institute of diabetes and Digestive and Kidney Diseases (RO1DK114356 & UM1HG006348).
Footnotes
Publisher's Disclaimer: This is a PDF file of an unedited manuscript that has been accepted for publication. As a service to our customers we are providing this early version of the manuscript. The manuscript will undergo copyediting, typesetting, and review of the resulting proof before it is published in its final citable form. Please note that during the production process errors may be discovered which could affect the content, and all legal disclaimers that apply to the journal pertain.
Disclosure: The authors have declared that no conflict of interest exists.
Conflict of Interest
No conflicts of interest are declared by the authors.
References
- [1].Bassel-Duby R and Olson EN, 2006. Signaling pathways in skeletal muscle remodeling, Annu Rev Biochem. 75, 19–37. [DOI] [PubMed] [Google Scholar]
- [2].Shaw CS, Shepherd SO, Wagenmakers AJ, Hansen D, Dendale P and van Loon LJ, 2012. Prolonged exercise training increases intramuscular lipid content and perilipin 2 expression in type I muscle fibers of patients with type 2 diabetes, Am J Physiol Endocrinol Metab. 303, E1158–65. [DOI] [PMC free article] [PubMed] [Google Scholar]
- [3].Shulman GI, 2004. Unraveling the cellular mechanism of insulin resistance in humans: new insights from magnetic resonance spectroscopy, Physiology (Bethesda). 19, 183–90. [DOI] [PubMed] [Google Scholar]
- [4].Holland WL, Brozinick JT, Wang LP, Hawkins ED, Sargent KM, Liu Y, Narra K, Hoehn KL, Knotts TA, Siesky A, Nelson DH, Karathanasis SK, Fontenot GK, Birnbaum MJ and Summers SA, 2007. Inhibition of ceramide synthesis ameliorates glucocorticoid-, saturated-fat-, and obesity-induced insulin resistance, Cell Metab. 5, 167–79. [DOI] [PubMed] [Google Scholar]
- [5].Yu C, Chen Y, Cline GW, Zhang D, Zong H, Wang Y, Bergeron R, Kim JK, Cushman SW, Cooney GJ, Atcheson B, White MF, Kraegen EW and Shulman GI, 2002. Mechanism by which fatty acids inhibit insulin activation of insulin receptor substrate-1 (IRS-1)-associated phosphatidylinositol 3-kinase activity in muscle, J Biol Chem. 277, 50230–6. [DOI] [PubMed] [Google Scholar]
- [6].Kim JK, Gavrilova O, Chen Y, Reitman ML and Shulman GI, 2000. Mechanism of insulin resistance in A-ZIP/F-1 fatless mice, J Biol Chem. 275, 8456–60. [DOI] [PubMed] [Google Scholar]
- [7].Boschmann M, Engeli S, Moro C, Luedtke A, Adams F, Gorzelniak K, Rahn G, Mahler A, Dobberstein K, Kruger A, Schmidt S, Spuler S, Luft FC, Smith SR, Schmidt HH and Jordan J, 2010. LMNA mutations, skeletal muscle lipid metabolism, and insulin resistance, J Clin Endocrinol Metab. 95, 1634–43. [DOI] [PMC free article] [PubMed] [Google Scholar]
- [8].Vantyghem MC, Pigny P, Maurage CA, Rouaix-Emery N, Stojkovic T, Cuisset JM, Millaire A, Lascols O, Vermersch P, Wemeau JL, Capeau J and Vigouroux C, 2004. Patients with familial partial lipodystrophy of the Dunnigan type due to a LMNA R482W mutation show muscular and cardiac abnormalities, J Clin Endocrinol Metab. 89, 5337–46. [DOI] [PubMed] [Google Scholar]
- [9].Hayashi YK, Matsuda C, Ogawa M, Goto K, Tominaga K, Mitsuhashi S, Park YE, Nonaka I, Hino-Fukuyo N, Haginoya K, Sugano H and Nishino I, 2009. Human PTRF mutations cause secondary deficiency of caveolins resulting in muscular dystrophy with generalized lipodystrophy, J Clin Invest. 119, 2623–33. [DOI] [PMC free article] [PubMed] [Google Scholar]
- [10].Berardinelli W, 1954. An undiagnosed endocrinometabolic syndrome: report of 2 cases, J Clin Endocrinol Metab. 14, 193–204. [DOI] [PubMed] [Google Scholar]
- [11].Seip M and Trygstad O, 1996. Generalized lipodystrophy, congenital and acquired (lipoatrophy), Acta Paediatr Suppl. 413, 2–28. [DOI] [PubMed] [Google Scholar]
- [12].Garg A, 2011. Clinical review#: Lipodystrophies: genetic and acquired body fat disorders, J Clin Endocrinol Metab. 96, 3313–25. [DOI] [PMC free article] [PubMed] [Google Scholar]
- [13].Magre J, Delepine M, Khallouf E, Gedde-Dahl T Jr., Van Maldergem L, Sobel E, Papp J, Meier M, Megarbane A, Bachy A, Verloes A, d’Abronzo FH, Seemanova E, Assan R, Baudic N, Bourut C, Czernichow P, Huet F, Grigorescu F, de Kerdanet M, Lacombe D, Labrune P, Lanza M, Loret H, Matsuda F, Navarro J, Nivelon-Chevalier A, Polak M, Robert JJ, Tric P, Tubiana-Rufi N, Vigouroux C, Weissenbach J, Savasta S, Maassen JA, Trygstad O, Bogalho P, Freitas P, Medina JL, Bonnicci F, Joffe BI, Loyson G, Panz VR, Raal FJ, O’Rahilly S, Stephenson T, Kahn CR, Lathrop M and Capeau J, 2001. Identification of the gene altered in Berardinelli-Seip congenital lipodystrophy on chromosome 11q13, Nat Genet. 28, 365–70. [DOI] [PubMed] [Google Scholar]
- [14].Cui X, Wang Y, Tang Y, Liu Y, Zhao L, Deng J, Xu G, Peng X, Ju S, Liu G and Yang H, 2011. Seipin ablation in mice results in severe generalized lipodystrophy, Hum Mol Genet. 20, 3022–30. [DOI] [PubMed] [Google Scholar]
- [15].Chen W, Chang B, Saha P, Hartig SM, Li L, Reddy VT, Yang Y, Yechoor V, Mancini MA and Chan L, 2012. Berardinelli-seip congenital lipodystrophy 2/seipin is a cell-autonomous regulator of lipolysis essential for adipocyte differentiation, Mol Cell Biol. 32, 1099–111. [DOI] [PMC free article] [PubMed] [Google Scholar]
- [16].Prieur X, Dollet L, Takahashi M, Nemani M, Pillot B, Le May C, Mounier C, Takigawa-Imamura H, Zelenika D, Matsuda F, Feve B, Capeau J, Lathrop M, Costet P, Cariou B and Magre J, 2013. Thiazolidinediones partially reverse the metabolic disturbances observed in Bscl2/seipin-deficient mice, Diabetologia. 56, 1813–25. [DOI] [PubMed] [Google Scholar]
- [17].McIlroy GD, Suchacki K, Roelofs AJ, Yang W, Fu Y, Bai B, Wallace RJ, De Bari C, Cawthorn WP, Han W, Delibegovic M and Rochford JJ, 2018. Adipose specific disruption of seipin causes early-onset generalised lipodystrophy and altered fuel utilisation without severe metabolic disease, Mol Metab. 10, 55–65. [DOI] [PMC free article] [PubMed] [Google Scholar]
- [18].Liu L, Jiang Q, Wang X, Zhang Y, Lin RC, Lam SM, Shui G, Zhou L, Li P, Wang Y, Cui X, Gao M, Zhang L, Lv Y, Xu G, Liu G, Zhao D and Yang H, 2014. Adipose-specific knockout of SEIPIN/BSCL2 results in progressive lipodystrophy, Diabetes. 63, 2320–31. [DOI] [PubMed] [Google Scholar]
- [19].Pagac M, Cooper DE, Qi Y, Lukmantara IE, Mak HY, Wu Z, Tian Y, Liu Z, Lei M, Du X, Ferguson C, Kotevski D, Sadowski P, Chen W, Boroda S, Harris TE, Liu G, Parton RG, Huang X, Coleman RA and Yang H, 2016. SEIPIN Regulates Lipid Droplet Expansion and Adipocyte Development by Modulating the Activity of Glycerol-3-phosphate Acyltransferase, Cell Rep. 17, 1546–1559. [DOI] [PMC free article] [PubMed] [Google Scholar]
- [20].Moitra J, Mason MM, Olive M, Krylov D, Gavrilova O, Marcus-Samuels B, Feigenbaum L, Lee E, Aoyama T, Eckhaus M, Reitman ML and Vinson C, 1998. Life without white fat: a transgenic mouse, Genes Dev. 12, 3168–81. [DOI] [PMC free article] [PubMed] [Google Scholar]
- [21].Shimomura I, Hammer RE, Richardson JA, Ikemoto S, Bashmakov Y, Goldstein JL and Brown MS, 1998. Insulin resistance and diabetes mellitus in transgenic mice expressing nuclear SREBP-1c in adipose tissue: model for congenital generalized lipodystrophy, Genes Dev. 12, 3182–94. [DOI] [PMC free article] [PubMed] [Google Scholar]
- [22].Cortes VA, Curtis DE, Sukumaran S, Shao X, Parameswara V, Rashid S, Smith AR, Ren J, Esser V, Hammer RE, Agarwal AK, Horton JD and Garg A, 2009. Molecular mechanisms of hepatic steatosis and insulin resistance in the AGPAT2-deficient mouse model of congenital generalized lipodystrophy, Cell Metab. 9, 165–76. [DOI] [PMC free article] [PubMed] [Google Scholar]
- [23].DeFronzo RA and Tripathy D, 2009. Skeletal muscle insulin resistance is the primary defect in type 2 diabetes, Diabetes Care. 32 Suppl 2, S157–63. [DOI] [PMC free article] [PubMed] [Google Scholar]
- [24].Dohm GL, Tapscott EB, Pories WJ, Dabbs DJ, Flickinger EG, Meelheim D, Fushiki T, Atkinson SM, Elton CW and Caro JF, 1988. An in vitro human muscle preparation suitable for metabolic studies. Decreased insulin stimulation of glucose transport in muscle from morbidly obese and diabetic subjects, J Clin Invest. 82, 486–94. [DOI] [PMC free article] [PubMed] [Google Scholar]
- [25].Chen W, Zhou H, Saha P, Li L and Chan L, 2014. Molecular mechanisms underlying fasting modulated liver insulin sensitivity and metabolism in male lipodystrophic Bscl2/Seipin-deficient mice, Endocrinology. en20141292. [DOI] [PMC free article] [PubMed] [Google Scholar]
- [26].Kraegen EW, James DE, Jenkins AB and Chisholm DJ, 1985. Dose-response curves for in vivo insulin sensitivity in individual tissues in rats, Am J Physiol. 248, E353–62. [DOI] [PubMed] [Google Scholar]
- [27].Kim YB, Shulman GI and Kahn BB, 2002. Fatty acid infusion selectively impairs insulin action on Akt1 and protein kinase C lambda /zeta but not on glycogen synthase kinase-3, J Biol Chem. 277, 32915–22. [DOI] [PubMed] [Google Scholar]
- [28].Hirschey MD, Shimazu T, Goetzman E, Jing E, Schwer B, Lombard DB, Grueter CA, Harris C, Biddinger S, Ilkayeva OR, Stevens RD, Li Y, Saha AK, Ruderman NB, Bain JR, Newgard CB, Farese RV Jr., Alt FW, Kahn CR and Verdin E, 2010. SIRT3 regulates mitochondrial fatty-acid oxidation by reversible enzyme deacetylation, Nature. 464, 121–5. [DOI] [PMC free article] [PubMed] [Google Scholar]
- [29].Chen W, Chang B, Wu X, Li L, Sleeman M and Chan L, 2013. Inactivation of Plin4 downregulates Plin5 and reduces cardiac lipid accumulation in mice, Am J Physiol Endocrinol Metab. 304, E770–9. [DOI] [PMC free article] [PubMed] [Google Scholar]
- [30].Agarwal AK and Garg A, 2006. Genetic basis of lipodystrophies and management of metabolic complications, Annu Rev Med. 57, 297–311. [DOI] [PubMed] [Google Scholar]
- [31].Friedman DL and Larner J, 1963. Studies on Udpg-Alpha-Glucan Transglucosylase. Iii. Interconversion of Two Forms of Muscle Udpg-Alpha-Glucan Transglucosylase by a Phosphorylation-Dephosphorylation Reaction Sequence, Biochemistry. 2, 669–75. [DOI] [PubMed] [Google Scholar]
- [32].Kim JK, Wi JK and Youn JH, 1996. Plasma free fatty acids decrease insulin-stimulated skeletal muscle glucose uptake by suppressing glycolysis in conscious rats, Diabetes. 45, 446–53. [DOI] [PubMed] [Google Scholar]
- [33].Boden G, Lebed B, Schatz M, Homko C and Lemieux S, 2001. Effects of acute changes of plasma free fatty acids on intramyocellular fat content and insulin resistance in healthy subjects, Diabetes. 50, 1612–7. [DOI] [PubMed] [Google Scholar]
- [34].Chen W, Yechoor VK, Chang BH, Li MV, March KL and Chan L, 2009. The Human Lipodystrophy Gene Product BSCL2/Seipin Plays a Key Role in Adipocyte Differentiation, Endocrinology. 150, 4552–61. [DOI] [PMC free article] [PubMed] [Google Scholar]
- [35].Kim JK, Fillmore JJ, Gavrilova O, Chao L, Higashimori T, Choi H, Kim HJ, Yu C, Chen Y, Qu X, Haluzik M, Reitman ML and Shulman GI, 2003. Differential effects of rosiglitazone on skeletal muscle and liver insulin resistance in A-ZIP/F-1 fatless mice, Diabetes. 52, 1311–8. [DOI] [PubMed] [Google Scholar]
- [36].Bosma M, Hesselink MK, Sparks LM, Timmers S, Ferraz MJ, Mattijssen F, van Beurden D, Schaart G, de Baets MH, Verheyen FK, Kersten S and Schrauwen P, 2012. Perilipin 2 improves insulin sensitivity in skeletal muscle despite elevated intramuscular lipid levels, Diabetes. 61, 2679–90. [DOI] [PMC free article] [PubMed] [Google Scholar]
- [37].Bosma M, Sparks LM, Hooiveld GJ, Jorgensen JA, Houten SM, Schrauwen P, Kersten S and Hesselink MK, 2013. Overexpression of PLIN5 in skeletal muscle promotes oxidative gene expression and intramyocellular lipid content without compromising insulin sensitivity, Biochim Biophys Acta. 1831, 844–52. [DOI] [PubMed] [Google Scholar]
- [38].Bonnefont JP, Djouadi F, Prip-Buus C, Gobin S, Munnich A and Bastin J, 2004. Carnitine palmitoyltransferases 1 and 2: biochemical, molecular and medical aspects, Mol Aspects Med. 25, 495–520. [DOI] [PubMed] [Google Scholar]
- [39].Afifi AK, Mire-Salman J and Najjar S, 1976. The myopahtology of congenital generalized lipodystrophy light and electron microscopic observations, Johns Hopkins Med J. 139 SUPPL, 61–8. [PubMed] [Google Scholar]
- [40].Schiaffino S and Mammucari C, 2011. Regulation of skeletal muscle growth by the IGF1-Akt/PKB pathway: insights from genetic models, Skelet Muscle. 1, 4. [DOI] [PMC free article] [PubMed] [Google Scholar]
- [41].Patel S, Doble BW, MacAulay K, Sinclair EM, Drucker DJ and Woodgett JR, 2008. Tissue-specific role of glycogen synthase kinase 3beta in glucose homeostasis and insulin action, Mol Cell Biol. 28, 6314–28. [DOI] [PMC free article] [PubMed] [Google Scholar]
- [42].Testoni G, Duran J, Garcia-Rocha M, Vilaplana F, Serrano AL, Sebastian D, Lopez-Soldado I, Sullivan MA, Slebe F, Vilaseca M, Munoz-Canoves P and Guinovart JJ, 2017. Lack of Glycogenin Causes Glycogen Accumulation and Muscle Function Impairment, Cell Metab. 26, 256–266 e4. [DOI] [PubMed] [Google Scholar]
- [43].Koves TR, Ussher JR, Noland RC, Slentz D, Mosedale M, Ilkayeva O, Bain J, Stevens R, Dyck JR, Newgard CB, Lopaschuk GD and Muoio DM, 2008. Mitochondrial overload and incomplete fatty acid oxidation contribute to skeletal muscle insulin resistance, Cell Metab. 7, 45–56. [DOI] [PubMed] [Google Scholar]
- [44].Lewis GF, Carpentier A, Adeli K and Giacca A, 2002. Disordered fat storage and mobilization in the pathogenesis of insulin resistance and type 2 diabetes, Endocr Rev. 23, 201–29. [DOI] [PubMed] [Google Scholar]
- [45].Lebovitz HE and Banerji MA, 2001. Insulin resistance and its treatment by thiazolidinediones, Recent Prog Horm Res. 56, 265–94. [DOI] [PubMed] [Google Scholar]
- [46].Viljanen AP, Iozzo P, Borra R, Kankaanpaa M, Karmi A, Lautamaki R, Jarvisalo M, Parkkola R, Ronnemaa T, Guiducci L, Lehtimaki T, Raitakari OT, Mari A and Nuutila P, 2009. Effect of weight loss on liver free fatty acid uptake and hepatic insulin resistance, J Clin Endocrinol Metab. 94, 50–5. [DOI] [PubMed] [Google Scholar]
- [47].Goodpaster BH, Kelley DE, Wing RR, Meier A and Thaete FL, 1999. Effects of weight loss on regional fat distribution and insulin sensitivity in obesity, Diabetes. 48, 839–47. [DOI] [PubMed] [Google Scholar]
- [48].Boden G and Chen X, 1995. Effects of fat on glucose uptake and utilization in patients with noninsulin-dependent diabetes, J Clin Invest. 96, 1261–8. [DOI] [PMC free article] [PubMed] [Google Scholar]
- [49].Clerk LH, Rattigan S and Clark MG, 2002. Lipid infusion impairs physiologic insulin-mediated capillary recruitment and muscle glucose uptake in vivo, Diabetes. 51, 1138–45. [DOI] [PubMed] [Google Scholar]
- [50].Coen PM and Goodpaster BH, 2012. Role of intramyocelluar lipids in human health, Trends Endocrinol Metab. 23, 391–8. [DOI] [PMC free article] [PubMed] [Google Scholar]
- [51].Zhou H, Lei X, Benson T, Mintz J, Xu X, Harris RB, Weintraub NL, Wang X and Chen W, 2015. Berardinelli-Seip congenital lipodystrophy 2 regulates adipocyte lipolysis, browning, and energy balance in adult animals, J Lipid Res. 56, 1912–25. [DOI] [PMC free article] [PubMed] [Google Scholar]