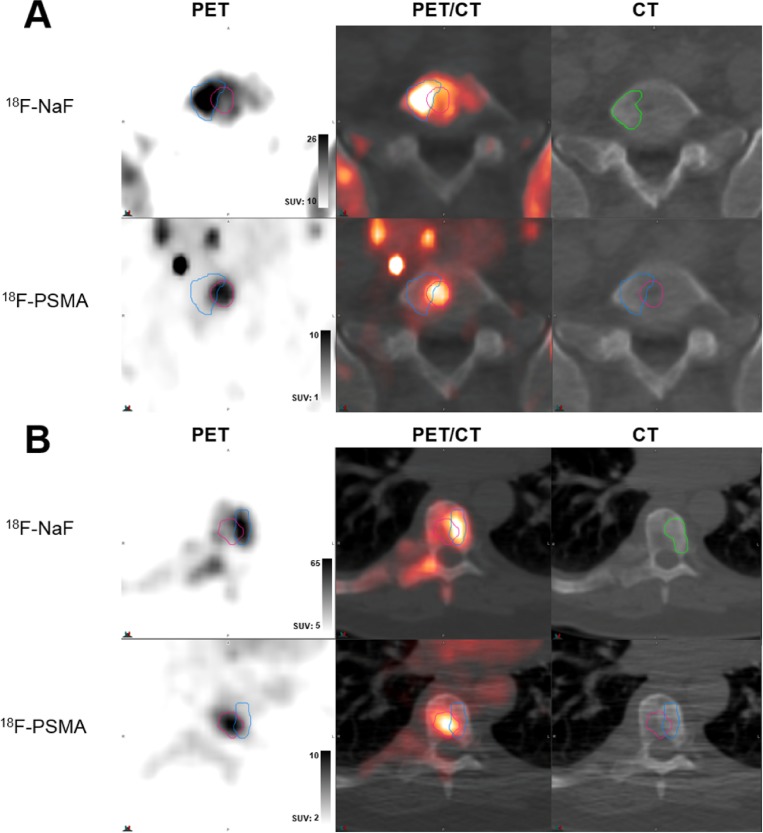
Figure 3. Examples of low volume and spatial uptake concordance.
(A) Lesion in L5 spine of castrate-resistant patient (serum PSA 11.79 ng/ml) demonstrating poor 62.2% volumetric overlap between 18F-NaF uptake (top row, blue contour) and 18F-PSMA (DCFPyL) (bottom row, red contour) uptake, with marked mismatching patterns of high uptake within contours. (B) Lesion in T12 spine of castrate-resistant patient (serum PSA 4379 ng/ml) demonstrating high 30.9% volumetric overlap between 18F-NaF uptake (top row, blue contour) and 18F-PSMA (DCFBC) (bottom row, red contour) uptake, with substantial mismatch in uptake patterns. In both (A) and (B), top row demonstrates PET uptake, PET/CT overlay, and low-dose CT from 18F-NaF scan and bottom row demonstrates PET uptake, PET/CT overlay, and low-dose CT from PSMA scans with registered contour overlay. CT contours shown in green.

