Abstract
Hedgehog (Hh) signaling governs embryogenesis and adult tissue homeostasis in mammals and other multicellular organisms1–3. Whereas deficient Hh signaling leads to birth defects, unrestrained Hh signaling is implicated in human cancers2,4–6. N-terminally palmitoylated Hh releases the repression of Patched to the oncoprotein Smoothened (Smo); however, the mechanism by which Hh recognizes Patched is unclear. Here, we report cryo-EM structures of human Patched-1 alone and in complex with native Sonic Hedgehog (Shh-N) at 3.5-Å and 3.8-Å resolution, respectively. The Patched-1 structure reveals internal two-fold pseudo-symmetry in its transmembrane core featuring a sterol-sensing domain (SSD) and two homologous extracellular domains (ECDs), resembling the architecture of Niemann-Pick C1 protein7 (NPC1). The palmitoylated N-terminus of Shh-N inserts into a cavity between the ECDs and dominates the Ptch1–Shh-N interface, which is distinct from that reported for Shh-N co-receptors8. Notably, our biochemical assays show that Shh-N may employ another interface, which is required for its co-receptor binding, to recruit Ptch1 in the absence of covalently attached palmitate. Our work provides atomic insights into Hh-N recognition by Ptch1, offers a structural basis for cooperative binding of Hh-N to various receptors, and serves as a molecular framework for Hh signaling and its malfunction in disease.
The Hh precursor undergoes autocatalytic processing in the endoplasmic reticulum to release an amino-terminal signaling domain (Hh-N) with cholesterol covalently coupled to its carboxyl terminus. Hedgehog acyltransferase (Hhat) then adds palmitate to the α-amino group of the N-terminal specific cysteine to yield the mature, doubly-lipidated, signaling molecule9,10. Notably, N-terminal palmitoylation is indispensable for Hh signaling: 1) fatty acylated Shh-N is far more active than unacylated Shh-N using differentiation assays and Hh signaling assays11,12,; 2) blocking Hh-N palmitoylation (by mutation of its palmitoylation site) affected embryonic development in both Drosophila and mice10,13; and 3) inhibitors of Hedgehog acyltransferase that prevent the palmitoylation of Shh block Hh signaling14.
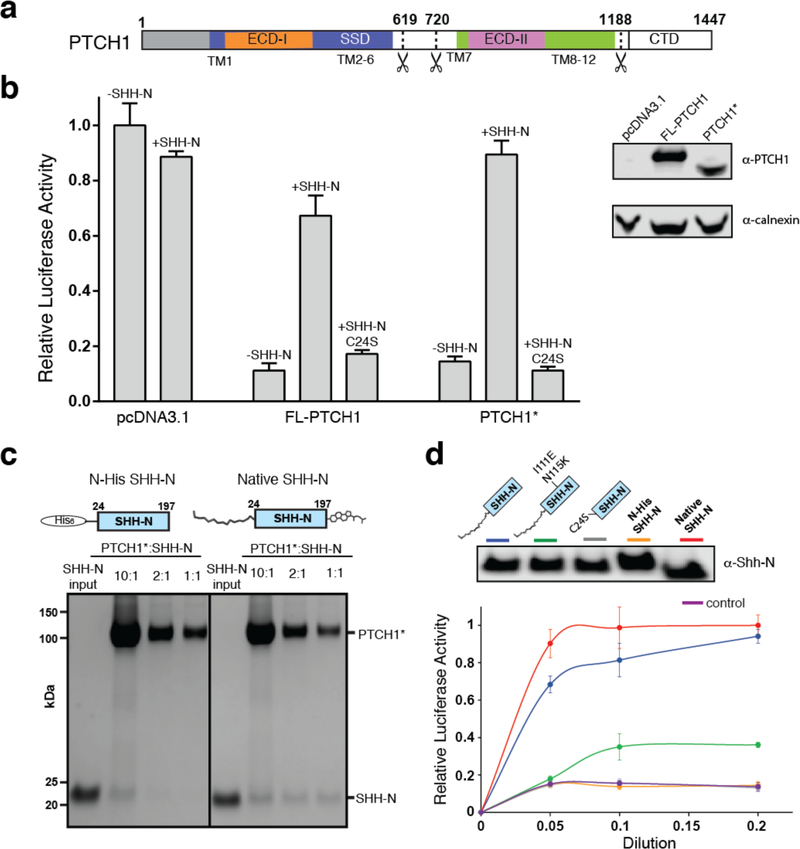
Human Patched-1 (Ptch1), the primary receptor for Hh-N ligands, consists of 1,447 amino acids, including 12 transmembrane helices (TMs) and three ~30kD soluble domains, namely two extracellular domains (ECD-I and ECD-II) that bind Hh-N and one cytoplasmic carboxyl-terminal domain (CTD) (Fig. 1a and Exteneded Data Fig. 1). In addition, TMs 2–6 of Patched are predicted to form a sterol-sensing domain (SSD), which, in other proteins such as NPC1 and HMG-CoA reductase, is involved in cholesterol metabolism and signaling15. Unliganded Ptch inhibits Hh signaling and this repression is released when Hh binds to Patched16. Specifically, after Hh binding, Patched releases its inhibition of Smo, a polytopic membrane receptor that activates the Gli transcription factors to up-regulate Hh target genes2. How Patched inhibits Smo is enigmatic but there are studies showing that Patched may act indirectly by releasing a small molecule to regulate Smo17,18. In support of this model, Patched has a similar transmembrane topology to prokaryotic RND-transporters, which transport ligands across membranes19.
Fig. 1. The engineered human Ptch1 protein binds Shh-N ligand.
a, Primary structure of Ptch1. Residues 619–720 and 1189–1447 were removed in Ptch1*. b, Hh signaling in Ptch1−/− MEFs transfected with Ptch1 or Ptch1* and response to wild-type or mutant Shh-N ligand via luciferase activity. Shh-N in conditioned medium and transiently expressed Ptch1 were detected by western blotting. c, Pull-down assay of his-tagged Shh-N or native Shh-N with Ptch1* at different molar ratios detected by Coomassie-staining. The assay was reproduced three times with the similar results. d, Palmitoylated Shh-N stimulates Hh signaling but unmodified Shh-N does not. Shh-Light II cells were treated with various concentrations of Shh-N varients, and Hh signaling was measured using luciferase activity. Data (panels b and d) are mean ± s.d. (n=3).
Two major gaps remain in our knowledge of the Hh pathway: 1) the molecular details of how Hh recognizes and binds Patched; 2) the mechanism of Smo activation after Hh binds Patched. More importantly, Ptch is a tumor suppressor involved in basal cell carcinoma, medulloblastoma, primitive neuroectodermal tumors5 and mutations of Shh and Ptch can also cause developmental defects3. Smo is a target of antitumor agents20. Since this pathway is associated with human diseases, structural knowledge of Patched and the Patched-Hh complex is not only crucial for elucidating the mechanism of signal transduction, but also for understanding the pathology of mutants, and for development of potential therapeutics for human diseases.
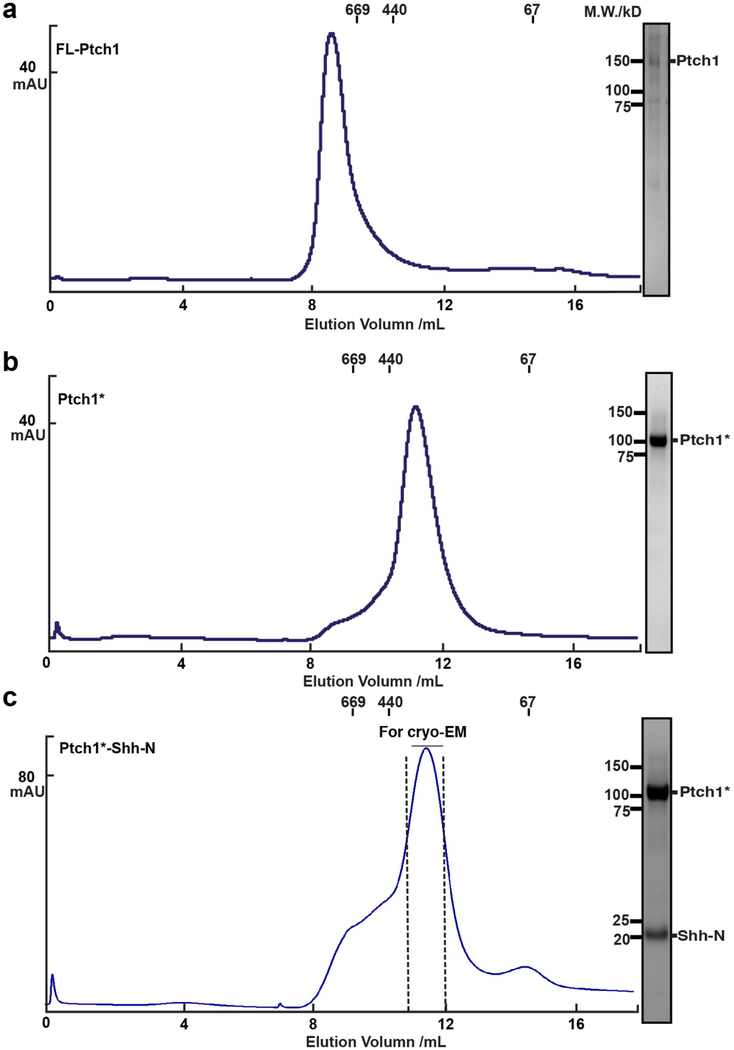
The full-length human Ptch1, expressed with a C-terminal Flag tag in human embryonic kidney HEK-293S cells, is eluted in the void volume during gel filtration (Extended Data Fig. 2a). In order to make the protein amenable to structural studies, we truncated the cytoplasmic loop between TM6 and TM7 and the CTD of Ptch1. Notably, a recent study on Ptch1 revealed that simultaneous deletion of both its TM6-TM7 internal loop and its cytoplasmic domain did not affect Ptch1-dependent repression of Smo activity in Ptch1-deficient MEFs, or normal localization in cilia21. This suggests a structural or mechanistic interaction between the TM6-TM7 internal loop and the CTD, as deletion of the CTD in combination with this loop restores normal activity. This Ptch1 variant (Ptch1*) has better solubility (Extended Data Fig. 2b). To test the function of Ptch1*, either Ptch1* or full-length Ptch1 were transfected to Ptch1-deficient MEFs respectively. Hh reporter assays revealed that, similar to wild type Ptch1, Ptch1* can repress Hh signaling, and that treatment with conditioned medium containing palmitoylated Shh-N without cholesterol modification, but not the C24S palmitoylation site Shh-N mutant, can release this repression (Fig. 1b).
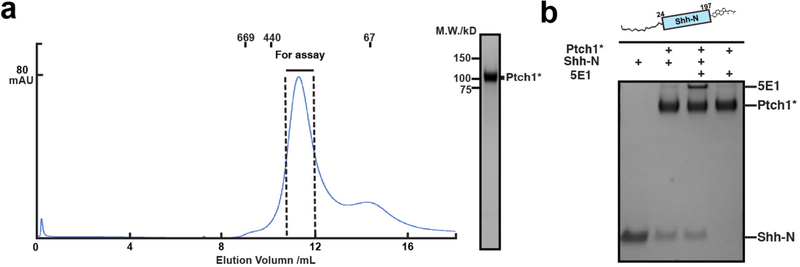
We assembled the Ptch1*–Shh-N complex using unmodified Shh-N with an N-terminal His-tag purified from E. coli, or Shh-N with a C-terminal cholesterol and an N-terminal fatty acid modification purified from HEK-293 cells (termed “native” Shh-N hereafter) (Fig. 1c). The native Shh-N but not unmodified Shh-N formed a stable complex with Ptch1*, with Shh-N being detected at a 1:1 ratio (Fig. 1c). We also measured Hh signaling activity in cells by adding either conditioned media or purified Shh proteins to Shh-Light II cells that carry a Gli reporter plasmid. The results show that palmitoylated Shh-N, but not the C24S Shh-N mutant or N-His tagged Shh-N, can considerably stimulate Hh signaling (Fig. 1d). This suggests that Ptch1* is able to bind the native Shh-N, allowing us to make a physiological complex with purified Ptch1* in vitro (Extended Data Fig. 2c).
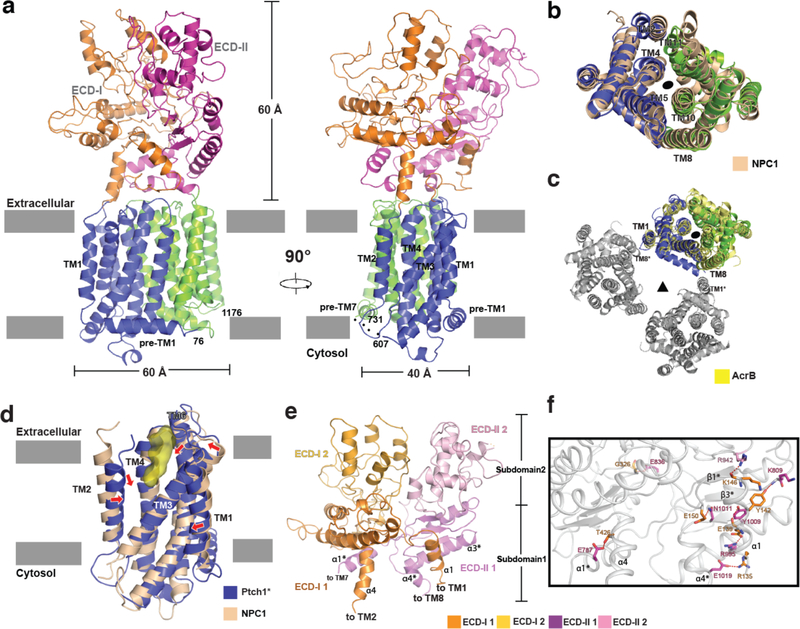
We determined the structure of Ptch1* to 3.5 Å resolution (Fig. 2a, Extended Data Figs. 3, 4 and Table. 1). Ptch1*, a monomer in solution, measures 110 Å by 60 Å by 40 Å (Fig. 2a). The structure exhibits pseudo-symmetry across the 12 TMs and features two homologous ECDs (Fig. 2a). The transmembrane domain of Patched has a similar topology to NPC1 and prokaryotic RND-transporters7,19, one of which is AcrB (Fig. 2b and c). Previous studies suggested that Ptch1 could form oligomers mediated by its CTD22; since this part of the molecule has been removed in our construct, we focus our discussion here on monomeric Ptch1*.
Fig. 2. Overall structure of Ptch1*.
a, Ribbon representation of the structure horizontal to the membrane. Flexible linkers are indicated by dots. b, Structural comparison of transmembrane domains of Ptch1* and NPC1 (pdb code: 5U74) viewed from extracellular side. c, Structural comparison of transmembrane domains of Ptch1* and AcrB trimer (pdb code: 1IWG). One subunit of AcrB is yellow, while the rest are gray. d, SSD comparison of Ptch1* and NPC1 (pdb code: 5U74) in a similar view as the right panel of a. Red arrows indicate shifted helices. Surface representation of the unidentified molecule in yellow. e, Overall structure of ECD-I and ECD-II. f, Interface between ECD-I and ECD-II. Hydrophilic interactions are indicated by dots and residues colored as in panel e.
Table 1.
Cryo-EM data collection, refinement and validation statistics.
| Ptch 1 * (EMDB-7795) (PDB 6P4H) |
Ptch 1 *-Shh-N (EMDB-7796) (PDB 6D4J) |
|
|---|---|---|
| Data collection anti processing | ||
| Magnification | 29000 | 29000 |
| Voltage (kV) | 300 | 300 |
| Electron exposure (e-/Å2) | 80 | 80 |
| Defocus range (µm) | −0.8 to −2.0 | −0.8 to −2.2 |
| Pixel size (Å) | 1.0 | 1.0 |
| Symmetry imposed | Cl | Cl |
| Initial particle images (no.) | 789,118 | 661,119 |
| Final particle images (no.) | 167,840 | 195,051 |
| Map resolution (Å) | 3.48 | 3.80 |
| FSC threshold 0.143 | ||
| Map resolution range (Å) | 3.1–7.0 | 3.5–7.0 |
| Refinement | ||
| Initial model used (PDB code) | 3JD8 | 6D4H |
| Model resolution (Å) | 3.90 | 4.14 |
| FSC threshold 0.5 | ||
| Model resolution range (Å) | 3.90–256 | 4.14–256 |
| Map sharpening B factor (Å2) | −100 | −100 |
| Model composition | ||
| Non-hydrogen atoms | 7318 | 8614 |
| Protein residues | 964 | 1129 |
| Ligands | 8 | 8 |
| B factors (Å2) | ||
| Protein | 127.8 | 184.9 |
| Ligand | 177.2 | 218.2 |
| R.m.s. deviations | ||
| Bond angles (Å) | 0.0069 | 0.0063 |
| Bond angles (°) | 1.1545 | 1.0467 |
| Validation | ||
| Mol Probity score | 2.09 | 2.05 |
| Clashscore | 4.21 | 2.89 |
| Poor rotamers (%) | 3.12 | 3.69 |
| Ramachandran plot | ||
| Favored (%) | 91.2 | 90.2 |
| Allowed (%) | 8.8 | 9.8 |
| Disallowed (%) | 0 | 0 |
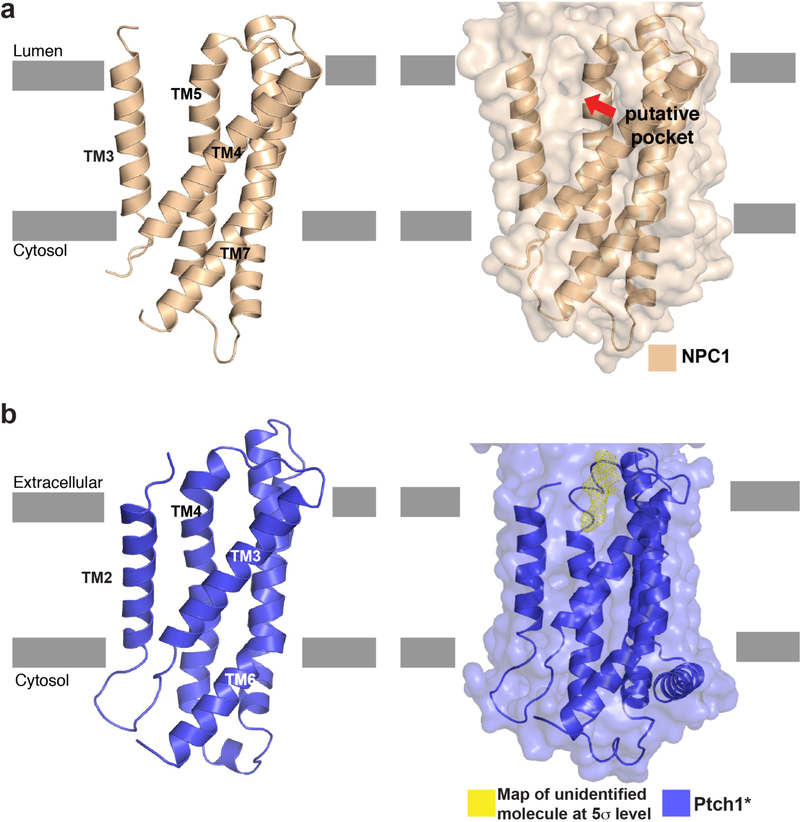
Previous crosslinking studies suggested that the SSD of NPC1 may bind a small ligand23. Our prior work showed that a cavity in the SSD of NPC1 is large enough to accommodate a cholesterol molecule7. A corresponding pocket is observed in the SSD of Ptch1* (Fig. 2d and Extended Data Fig. 5). This hydrophobic pocket opens to the extracellular space and plasma membrane and measures ~20 Å by 10 Å by 10 Å (Fig. 2d). Remarkably, we observed a rod-shaped density in this pocket (Fig. 2d), which is distinct from detergent micelles and other noise based on its local resolution. We speculate that the density might derive from an endogenous sterol derivative or another lipid. Structural comparison of Ptch1* and NPC1 reveals that the transmembrane helices of the N-terminal half of Ptch1* converge more closely than those in NPC1, potentially due to an interaction with this unidentified ligand (Fig. 2d).
ECD-I and ECD-II overlap with each other with an rmsd of 3.8 Å (Cα atoms) and resemble the middle and C-terminal lumenal domains of NPC124. Each ECD consists of two subdomains: subdomain 1 ranges from the cell membrane to the middle of each ECD, with three β-strands and two α-helices providing the major interface between the two ECDs; the subdomains 2 range from the middle to the top of each ECD (Fig. 2e). There are five residues of the swapped ECD-I α1 helix that interact with six residues in ECD-II in addition to several hydrophobic interactions. By contrast, ECD-II α1 (labeled as α1*) forms only one hydrophilic bond with T426 in α4 of ECD-I (Fig. 2f). Moreover, ECD-I contains 70 amino acids more than ECD-II and subdomain 2 of ECD-I contains more loops than that of ECD-II (Extended Data Fig. 1). Together, these features confer a flexible character to ECD-I for ligand binding.
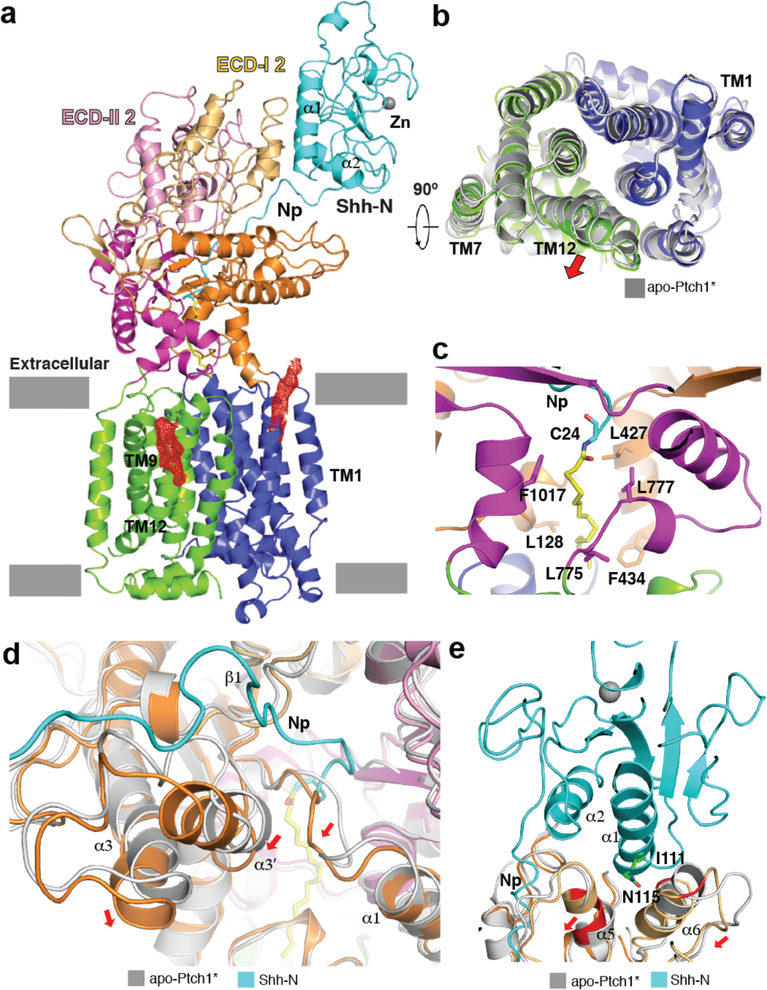
The structure of the Ptch1*–Shh-N complex was determined to 3.8Å resolution (Fig. 3a, Extended Data Figs. 6, 7 and Table 1). The C-terminus of Shh-N residues 187–197, which was also invisible in the Shh-N crystal structure (pdb code: 3M1N), could not be resolved. It supports our cell biological assays that cholesterol modification of Hh-N is not necessary to stimulate the Hh signal (Fig. 1b and d). In addition to the molecule observed in the SSD, there is another endogenous density close to TM12 (Fig 3a). This helix is slightly more tilted than in the apo-structure, potentially employing the guanidine group of Arg1150 to bind the polar head of this putative lipid (Fig. 3b). There is no substantial conformational change between the transmembrane regions of Ptch1* alone and Ptch1* –Shh-N complex (Fig. 3b). This suggests that Shh-N binding may not abolish SSD-mediated substrate binding of Ptch1.
Fig. 3. Structure of Ptch1*–Shh-N complex.
a, Ribbon representation of the structure horizontal to the membrane with Ptch1* colored as in Fig. 2 and Shh-N colored in cyan. An Shh-N bound zinc atom is indicated by a gray sphere. Putative endogenous molecules from the cryo-EM density map are shown at 5σ level in red mesh. b, Structural comparison of the membrane domains of apo-Ptch1* (gray) and Ptch1*–Shh-N (colored). c, The palmitate-binding site. d, Interface between Np of Shh-N and ECD-I compared with apo-Ptch1*. e, Secondary interface between Shh-N and ECD-I subdomain 2 compared with apo-Ptch1*. Red arrows represent structural shifts.
Native Shh-N engages two binding sites on the ECD-I of Ptch1* (Fig. 3a). The primary interface involves the N-terminal peptide of Shh-N (residues 24–38, denoted as “Np”) with fatty acid modification that fits into the space between subdomains 1 of ECD-I and ECD-II (Fig. 3c). Notably, this binding site includes a strong stretch of density that extends beyond the N-terminal Cys24 and that is contiguous with the protein. Mass Sprectrometry (MS) has identified this extension on the Shh-N we used primarily as palmitoylation and to a smaller degree lauryolation and myristoylation, consistent with previous observations25. Based on this MS result, and the shape of the density, we assigned the N-terminal density as a palmitoyl moiety (Fig. 3c and Extended Data Fig. 7e). Compared with the apo-Ptch1* structure, the α3 and α3’ helices as well as their connecting loop in ECD-I are shifted towards the membrane side, providing more space for this insertion (Fig. 3d). The loop connecting α1 and β1 of ECD-I (residues 148–153) undergoes a conformational change allowing palmitate to expand the space between α1 of ECD-I and α4 of ECD-II (Fig. 3d). Hydrophobic residues from ECDs form extensive van der Waals’ interactions with this modification (Fig. 3c). The secondary binding site involves α-helices α1 and α2 of Shh-N, while Ptch1* engages its ECD-I (Fig. 3e). A recent study showed that a short palmitoylated N-terminal fragment (residues 24–45) of Shh-N could partially activate Hh signaling by binding Ptch11. Our work indeed shows that native Shh-N forms a more stable complex with Ptch1* than unpalmitoylated Shh-N (Fig. 1c) and our structure confirms the interaction between the Shh-N palmitate and Ptch1* (Fig. 3c).
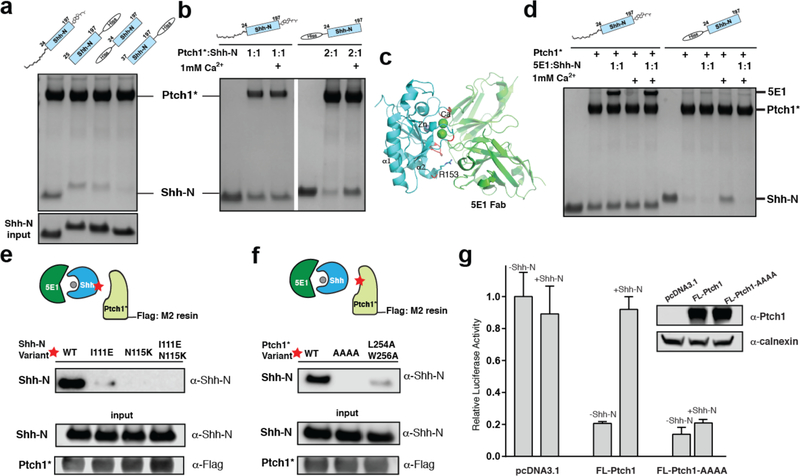
The interface we observed between native Shh-N and Ptch1* was inconsistent with the previously reported interface of Shh-N and Ptch1* that includes the zinc-binding site (Fig. 3a), which is also able to accomdate calcium and putatively binds to Ptch121,26,27. To resolve this contradiction, we purified N-terminal His-tagged Shh-N without the palmitate from E. coli as previously reported26, but our cell-based Hh reporter assays showed that the N-His tagged Shh-N lost almost all Hh signaling activity (Fig. 1d). Compared with native Shh-N, removing the palmitate modification of Shh-N or deleting the N-terminus (residues 24–36) weakened Shh-N binding to Ptch1* (Fig. 4a). Interestingly, binding between the N-His tagged Shh-N and Ptch1* can be enhanced by Ca2+, however, the binding between native Shh-N and Ptch1* can not be affected by Ca2+ (Fig. 4b).
Fig. 4. The palmitoylated N-terminus of Shh-N dominates its interface to Ptch1*.
a, The palmitoylated N-terminus of Shh-N is important for Ptch1* binding. A 2:1 Ptch1*:Shh-N molar ratio was used for assays. b, Calcium facilitates the binding between Ptch1 and N-terminal tagged Shh-N. c, Complex of Shh-N and 5E1 (pdb code: 3MXW), with interaction areas on Shh-N in red. Calcium in the interface are indicated by green balls. d, 5E1 blocks the binding of Ptch1* to His-tagged Shh-N but not to native Shh-N. e, Mutagenesis of the secondary interface of Shh-N. f, Mutagenesis of the interface of Ptch1*. The assays (panels a, b, d, e and f) were reproduced three times with the similar results. g, Repression of Hh signaling by Ptch1-AAAA and its response to Shh-N ligand. Shh-N in conditioned medium was shown in Fig. 1d. Hh activity was measured by luciferase assay and data are mean ± s.d. (n=3). The protein was detected by Coomassie-staining (panel a, b and d) or by western blotting (panels e, f and g).
We further performed Shh-N competition assays with Ptch1* and 5E1, a monoclonal anti-Shh-N antibody of nanomolar binding affinity, which is used for blocking Hh signaling by binding Ptch18 (Fig. 4c). Our structural analysis predicts that 5E1 should not interfere with the palmitate-dominated interface to Ptch1*. To validate this point, we performed a pull-down assay in the presence of 5E1 to determine if it competes with Ptch1* to bind the native Shh-N or N-terminally tagged Shh-N. Shh-N were mixed with 5E1 before incubated with Ptch1* immobilized on Flag-M2 resin. A Ptch1*–Shh-N–5E1 trimeric complex can be eluted and detected on SDS-PAGE, suggesting that binding of 5E1 to the native Shh-N does not block its access to the observed Ptch1* interface. In contrast, 5E1 can successfully compete with N-His tagged Shh-N to bind Ptch1* with or without Ca2+ (Fig. 4d).
To exclude the possibility that detergent may have an undesirable influence in our system, we also reconstituted Ptch1* with amphipols, which serve to stabilize membrane proteins in solution, and repeated the competition assays (Extended Data Fig. 8a). The results showed that, as in the presence of detergents, the Ptch1*–Shh-N–5E1 trimeric complex could also be detected in a detergent-free environment (Extended Data Fig. 8b). Therefore, our data suggests that the palmitoylated N-terminus of Shh-N is an integral part of the native Shh-N-Ptch1* interface, and when its palmitoylated N-terminus is absent, the 5E1-binding interface (including R153 and Ca2+ binding site) may dominate in Ptch1* binding (Fig. 4c).
To further verify the secondary interface, we used unmodified Shh-N without any lipidation or tag at the N-terminus and further blocked the previously reported interface on Shh-N with 5E1. In our binding assays, unmodified Shh-N still binds Ptch1* in the presence of 5E1 that should be blocking the previously reported interface (Fig. 4e). We then introduced mutations on helix α1 of Shh-N (I111E/N115K), which abolished binding to Ptch1* (Fig. 4e). The Hh reporter assays showed that the Shh-N I111E/N115K mutant conditioned medium lost over 70% of activity compared with wild-type Shh-N (Fig. 1d). These data may explain why mutation of I111 or N115 leads to HPE-3, possibly by altering how Ptch1 recognizes Shh-N. We also introduced alanine mutations on the ECD-I (EYLY221–224AAAA shown as “AAAA”, L254A/W256A in Fig. 3e in red) of Ptch1*. The binding assay show that these two mutants have weaker binding to the Shh-N–5E1 complex, further supporting our structural observations (Fig. 4f). The Hh reporter assays also showed that in Ptch−/− MEFs the full-length Ptch1 with “AAAA” mutations can repress the Hh signaling but can not recognize Shh-N in order to release this inhibition (Fig. 4g).
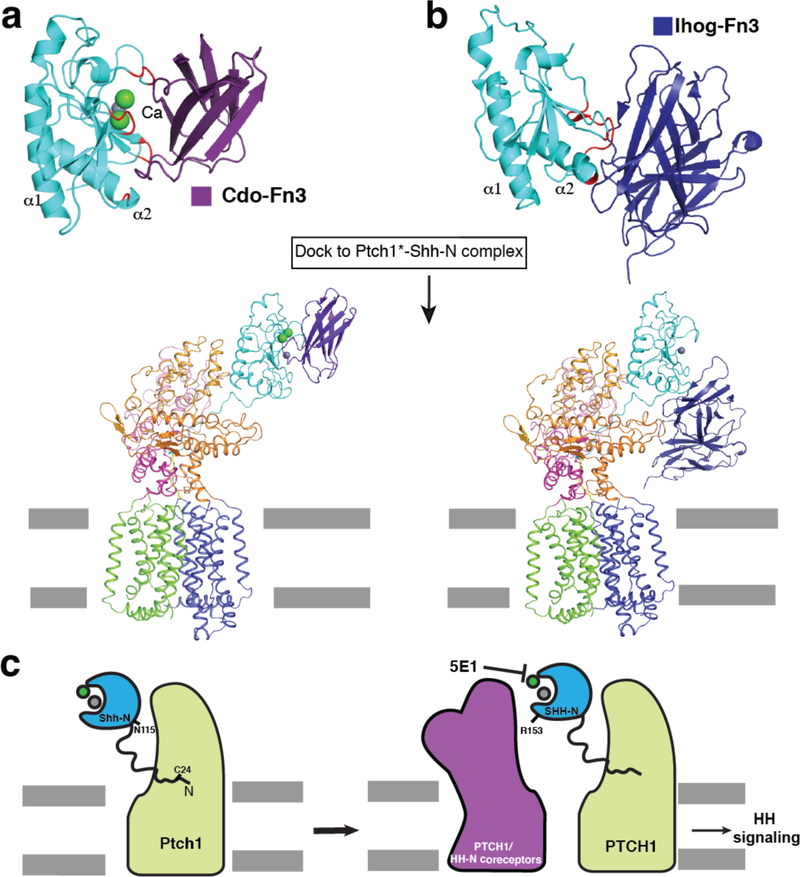
In this manuscript, we report two structures and related structure-guided experiments which together reveal that Ptch1* recognizes native Shh-N by two distinct binding sites. The Ptch*–Shh-N interface that we describe here has important implications of how Shh-N recognizes and interacts with other proteins in various signaling pathways, including Ihog (Interference Hedgehog), Cdo (Cell adhesion molecule-related, down-regulated by oncogenes), Boc (Brother of Cdo), and Hhip (Hedgehog-interacting protein)8. These co-receptors function in the recognition and localization of Hh in various cell types28,29. Previous studies suggested Hh-N could form a complex with Ptch and its co-receptor28,30. Indeed, the Ptch1*–Shh complex structure we determined allows for Shh-N to interact with an additional co-receptor to form multivalent complexes (Fig. 5a and b). This architecture is corroborated by our finding that the interaction of Shh-N with antibody 5E1, which binds the same area of Ptch1 as the Shh-N co-receptors, does not interfere with Ptch*–Shh-N complex formation (Fig. 4d). Here, we propose a Ptch1–Shh-N working model: Shh-N initially recognizes Ptch1 through its palmitoylated N-terminus. Subsequently, Shh-N co-receptors or another Ptch1 may bind Shh-N at a distinct interface to further regulate Hh signaling (Fig. 5c). This model could provide a possible mechanism of how Hh-N co-receptors and Ptch1 orchestrate Hh signaling. The other aspect of Patched signaling, namely, the mechanism for inhibition of Smo, remains poorly understood. Further investigations are required on how the Shh-N ligand affects Patched putative transport activity.
Fig. 5. Putative multivalent complex of Shh-N with Ptch1 and its co-receptors.
a, Complex of Shh-N and Cdo-Fn3 (pdb code: 3D1M) with interaction areas on Shh-N in red. b, Complex of Shh-N and Ihog-Fn3 (pdb code: 2IBG) with interaction areas on Shh-N in red. Hypothetical model of Ptch1*–Shh-N–Cdo complex or Ptch1*–Shh-N-Ihog complex was generated by docking Shh-N-Cdo-Fn3 or Shh-N-Ihog-Fn3 to the Ptch1*– Shh-N structure. c, Model of putative collaboration between Shh-N–Ptch1 and co-receptors or Ptch itself in Hh signaling.
Methods
Protein expression and purification
The constructs of human Patched-1 were cloned into pEG BacMam with a C-terminal Flag-tag. The protein was expressed using baculovirus-mediated transduction of mammalian HEK-293S GnTI cells (ATCC). The cell lines tested negative for mycoplasma contamination. At 48 hours post-infection at 37 °C, cells were disrupted by sonication in buffer A (20 mM Hepes pH 7.5, 150 mM NaCl) with 1 mM PMSF, 10 µg/mL leupeptin. After low-speed centrifugation, the resulting supernatant was incubated in buffer A with 1% (w/v) n-Dodecyl-β-D-maltoside (DDM, Anatrace) for 1 hour at 4 °C. The lysate was centrifuged again and the supernatant was loaded onto an Anti-Flag M2 affinity column (Sigma). After washing twice, the protein was eluted in buffer A with 0.1 mg/ml FLAG peptide, 0.02% DDM, and concentrated. The concentrated protein was purified by Superdex-200 size-exclusion chromatography (GE Healthcare) in buffer B (20 mM Hepes pH 7.5, 150 mM NaCl, and 0.06% (w/v) Digitonin (Sigma)). The peak fractions were collected and concentrated to 5–7 mg/ml for grid preparation. Mass spectrometry (MS) and anti-Flag-tag Western blotting confirmed the identity of the protein. To assemble the Ptch1*–Shh-N complex, native Shh-N (purchased from R&D system, Cat # 8908-SH/CF) was mixed with purified Ptch1* at a 1:1 molar ratio and purified by Superdex-200 size-exclusion chromatography (GE Healthcare) in buffer B. The peak fractions were collected and concentrated to 5–7 mg/ml for grid preparation.
For preparation of detergent-free protein, Ptch1* was purified as above, and then mixed with Amphipol A8–35 (Anatrace) at a 1:3 mass ratio for 4 hours. This mixture was incubated with bio-beads (Bio-rad) overnight before further purification by gel filtration with Buffer A. The mutated and truncated DNA constructs were generated using two-step PCR or Gibson Assembly (NEB).
Three constructs were cloned into the pET21b vector: 1) human Shh-N (residues 24–197) with N-terminal His-tag, 2) human Shh-N (residues 25–197) with C-terminal His-tag and 3) human Shh-N (residues 37–197) with C-terminal His-tag. All of the constructs and Shh-N variants were then transformed into E. coli BL21 (DE3) for expression. The transformed bacteria were grown in LB medium supplemented with ampicillin at 37 °C and induced by 0.2 mM isopropyl β-D-thiogalactopyranoside (IPTG) overnight at 25 °C. The cells were harvested and lysed by sonication in buffer C (20 mM Hepes pH 7.5, 500 mM NaCl) supplemented with 1 mM phenylmethanesulfonyl fluoride (PMSF). The lysate was centrifuged at 18,000 rpm for 30 min and the supernatant was loaded onto a Ni2+-NTA affinity column (Qiagen). After washing 3 times with 20 mM, 40 mM and 80 mM imidazole in buffer C, the protein was eluted in buffer C plus 250 mM imidazole and further purified by gel filtration using Superdex-200 size-exclusion chromatography (GE Healthcare) in buffer C. Peak fractions were collected for pull-down assay.
EM Sample Preparation and Imaging
A freshly purified protein sample was added to Quantifoil R1.2/1.3 400 mesh Au holey carbon grids (Quantifoil), blotted using a Vitrobot Mark IV (FEI), and frozen in liquid ethane. The grids were imaged in a 300 keV Titan Krios (FEI) with a Gatan K2 Summit direct electron detector (Gatan). Data were collected at 1 Å/pixel with a dose rate of 8 electrons per physical pixel per second. Images were recorded for 10 s exposure in 50 subframes to give a total dose of 80 electrons per Å2.
Imaging Processing and 3D reconstruction
Dark subtracted images were first normalized by gain reference that resulted in a pixel size of 1 Å/pixel. Drift correction was performed using the program Unblur31. The contrast transfer function (CTF) was estimated using CTFFIND432. To generate Ptch1* templates for automatic picking, around 2000 particles were manually picked and classified by 2D classification in RELION33. After auto-picking in RELION, the low-quality images and false-positive particles were removed manually. About 790k particles were extracted for subsequent 2D and 3D classification. 3D classification was carried out in RELION for generating the initial model of Patched, using the cryo-EM structure of human NPC1 (EMD-6640) low-pass filtered to 60 Å as the initial model. The Ptch1* model of best class after 3D classification was used as the initial model for the final 3D classification in RELION. The best class, containing ~168k particles, provided a 7.7 Å map after 3D auto-refinement in RELION. Motion correction of all particles was performed using the program alignparts_lmbfgs34. As in a previously published approach35, refinement was performed in FREALIGN36 using this best class as the initial model. The global search was performed once followed by 10–20 rounds of local search without mask. The best class without mask refinement was selected to generate the mask using “relion_mask_create” with 6 Å extensions excluding the micelle. This mask was then used for performing another global search followed by 10–20 rounds of local search with the width of cosine edge in 6 Å and BSC 10 to exclude bad partciles. The final map is estimated to be 3.5 Å using the 0.143 cutoff criteria.
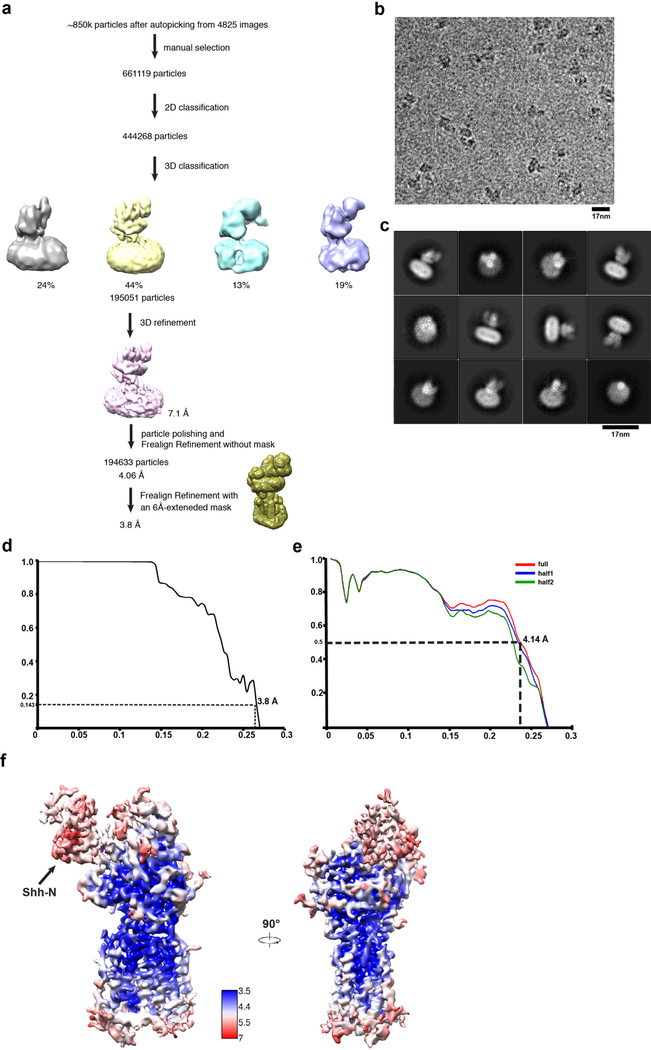
To generate templates of Ptch1*–Shh-N complex for automatic picking, around 5000 particles were manually picked and classified by 2D classification in RELION33. After auto-picking in RELION, the low-quality images and false-positive particles were removed manually. About 661k particles were extracted for subsequent 2D and 3D classification. 3D classification was carried out in RELION using the cryo-EM structure of Ptch1* low-pass filtered to 60 Å as the initial model. The complex model of best class after 3D classification was used as the initial model for the final 3D classification in RELION. The best class, containing 195k particles, provided a 7.1 Å map after 3D auto-refinement in RELION. After motion correction of individual particles, the final refinement was performed in FREALIGN36 using this best class as the initial model. The global search was performed once followed by 10–20 rounds of local search without mask. The best class without mask refinement was selected to generate the mask using “relion_mask_create” with 6 Å extensions excluding the micelle. This mask was then used for performing another global search followed by 10–20 rounds of local search with the width of cosine edge in 6 Å. The final map is estimated to be 3.8 Å using the 0.143 cutoff criteria.
Model Construction
To obtain better side-chain densities for model building, we sharpened the map of Ptch1* using BFACTOR.EXE (author: Nikolaus Grigorieff) with a resolution limit of 3.5 Å and a B-factor value of −100 Å2. The entire model was built de novo in Coot37. The crystal structure of human NPC1 (residues 334–1278, PDB code: 5U74) and the glycosylation sites of the Ptch1* ECDs were used to check the registers of our model. The de novo models of ideal helices were first put into the TM region. Using the bulky size of some large side chains in the cryo-EM map, we assigned a sequence to the initial model. The model was refined in PHENIX.real_space_refine with real-space restraints, including secondary-structure, stereochemical, Ramachandran, and rotamer restrains, to accommodate the bending of helices as well as maintain the stereochemistry of helical structure, and to best fit the model and cryo-EM map. Finally, the two ECDs were added to the model gradually, at the same time as the sequence assignment. The density of residues 1–75 (N-terminal domain), 608–618 and 721–729 (TM6-TM7 linker), 888–901 (in ECD-II) and 1177–1188 (C-terminus) is not resolved nor built. Residues 191–198, 211–263, 379–391, 457–466, 864–887, 902–915 and 955–960 were built with poly-alanine due to limited local resolution. For the complex, we sharpened the map using BFACTOR.EXE with a resolution limit of 3.8 Å and a B-factor value of −100 Å2. The residues 149–153 of Ptch1* were also built with poly-alanine in the complex. Using the EMfit docking program (developed by Dr. Michael G. Rossmann), a single solution was obtained for the orientation of Shh-N in the cryo-EM map. Structures of Shh-N (PDB code: 3M1N) and Ptch1* were docked into our final cryo-EM maps of the complex in Coot37.
Model Refinement and Validation
The models of Ptch1* and its complex with Shh-N were refined in real space using PHENIX38 and also in reciprocal space using Refmac with secondary-structure restraints and stereochemical restraints39,40. Structure factors were calculated from a half-map (working) using the program SFall41. Fourier shell correlations (FSCs) were calculated between the two half maps, the model against the working map, the other (free) half map, and full (sum) map42. Local resolutions were estimated using Blocres43. MolProbity44 was used to validate the geometries of the model. Structure Figures were generated using PyMOL (http://www.pymol.org) and Chimera45.
Pull-Down Assay
The unmodified human Shh-N proteins were expressed and purified from E. coli as described above. The HEK293-derived native human Shh-N protein was purchased from R & D Systems, Inc. (Cat # 8908-SH/CF, see the LC/ESI-MS analysis of this protein at: http://bit.ly/2AohYCG). For the pull-down assay, purified Ptch1* protein was immobilized to 20 μl Anti-Flag M2 resin, which was further incubated with unmodified or native Shh-N for 1 h at 4 °C in 150 μl buffer B. Then the resin was spun down and washed 3 times with buffer B. The protein complex was eluted with 20 μl buffer B supplemented with 0.3 mg/ml FLAG peptide. 15 μl of the elution was loaded on SDS-PAGE for detection. In order to see if 5E1 competes with Ptch1* when binding Shh-N, 5E1 (from Drs. B. Chen and J. Kim, UT southwestern) was added to Shh-N before incubating with the Ptch1*-immobilized Anti-Flag M2 Resin. For the Shh-N–5E1 complex pull down, the Shh-N (E. coli expressed with C-terminal His-tag) was incubated with 5E1 at 1:1 molar ratio, and then the pull-down assays were performed as above. The Shh-N protein and Ptch1* were detected by anti-Shh antibody (sc-365112, Santa Cruz Biotechnology) and anti-Flag antibody (M185, MBL Life Science). For the detergent-free assay, buffer B was replaced by buffer A. Each assay was reproduced at least three times.
Hh Reporter Assays
Human Shh-N (24–197) was constructed into pcDNA3.1 vector with the signal sequence of human calreticulin at the N-terminus as described before11. Secreted Shh-N was produced in HEK293 cells (ATCC) by transient transfection for 72 hours and were collected in DMEM, with 0.5% Fetal Bovine Serum (FBS). Shh Light II cells, a stable cell line expressing firefly luciferase with a 8X-Gli promoter and Renilla luciferase with a constitutive promoter (from Drs. B. Chen and J. Kim), were used to measure Hh pathway activity. Shh Light II cells were treated with the conditioned medium or purified protein diluted in fresh DMEM with 0.5% Newborn Calf Serum for 30 hours. To measure the activity of Ptch1 variants in Hh signaling, the 8X-Gli-Luciferase firefly reporter transgene, a constitutive Renilla luciferase transgene, and a pcDNA3.1 vector encoding Ptch1 variants were transfected to Ptch1−/− MEFs (from Drs. B. Chen and J. Kim) using TransIT reagent (Mirus Bio LLC). After 24 hours, cells were serum-starved in DMEM with 0.5% FBS. 24 hours later, cells were treated with Shh-N conditioned medium for another 24 hours. Firefly and Renilla luciferase were measured using the Dual-Luciferase® Reporter Assay System (Promega). The conditioned medium added was normalized based on Western blotting with anti-Shh antibody. The expression of Ptch1 variants and internal calnexin in MEFs cells were detected by Western blotting with anti-Ptch1 antibody (GeneTex, 83771) and anti-calnexin antibody (Novus, NB100–1965). Each assay was reproduced at least three times and data were analyzed using Excel (Microsoft). Bar graphs were generated by Prism (GraphPad). The cell lines tested negative for mycoplasma contamination.
Data Availability
The 3D cryo-EM density maps of Ptch1* and Ptch1*–Shh-N have been deposited in the Electron Microscopy Data Bank under the accession numbers EMD-7795 and EMD-7796. Atomic coordinates for the atomic model of Ptch1* and Ptch1*–Shh-N complex have been deposited in the Protein Data Bank under the accession numbers 6D4H and 6D4J. All other data is available from the corresponding authors upon reasonable request.
Extended Data
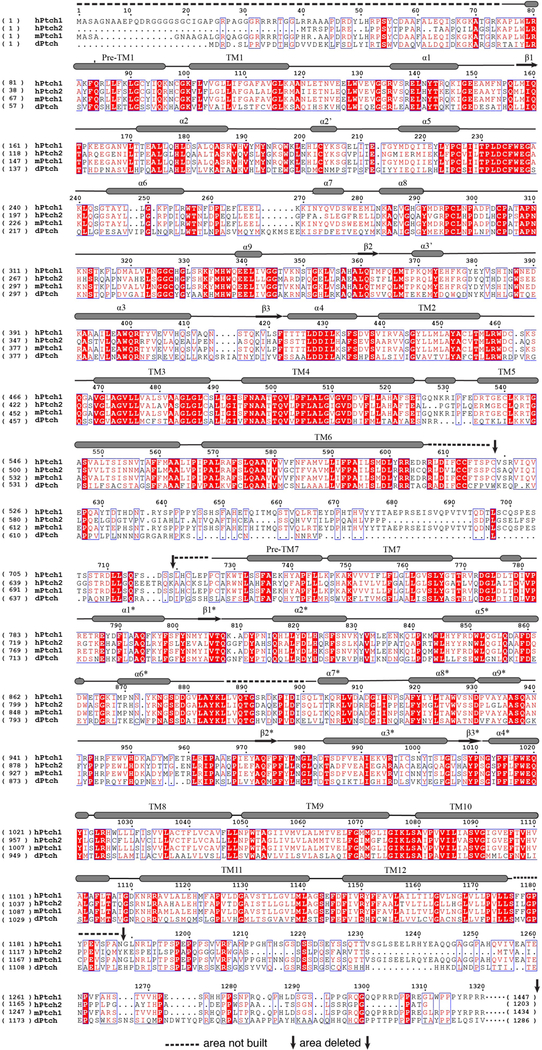
Extended Data Fig. 1. Sequence alignment of human Ptch1 and Ptch2, mouse Ptch1 and Drosophila Ptch.
The residue numbers of hPtch1 are indicated above the protein sequence. The transmembrane helices and secondary structures of ECDs are labeled (structural elements of ECD-II with asterisk). Residues under the dashed lines are excluded from the 3D reconstruction.
Extended Data Fig. 2. Biochemical properties of expressed human Ptch1 proteins.
a, Size-exclusion chromatogram and SDS-PAGE gel of the purified full-length Ptch1. b, Size-exclusion chromatogram and SDS-PAGE gel of the purified Ptch1*. c, Size-exclusion chromatogram and SDS-PAGE gel of the purified Ptch1*–Shh-N complex. Molecular standards indicated on left side of SDS-PAGE gels and above the elution curves. The assays were reproduced at least three times with the similar results.
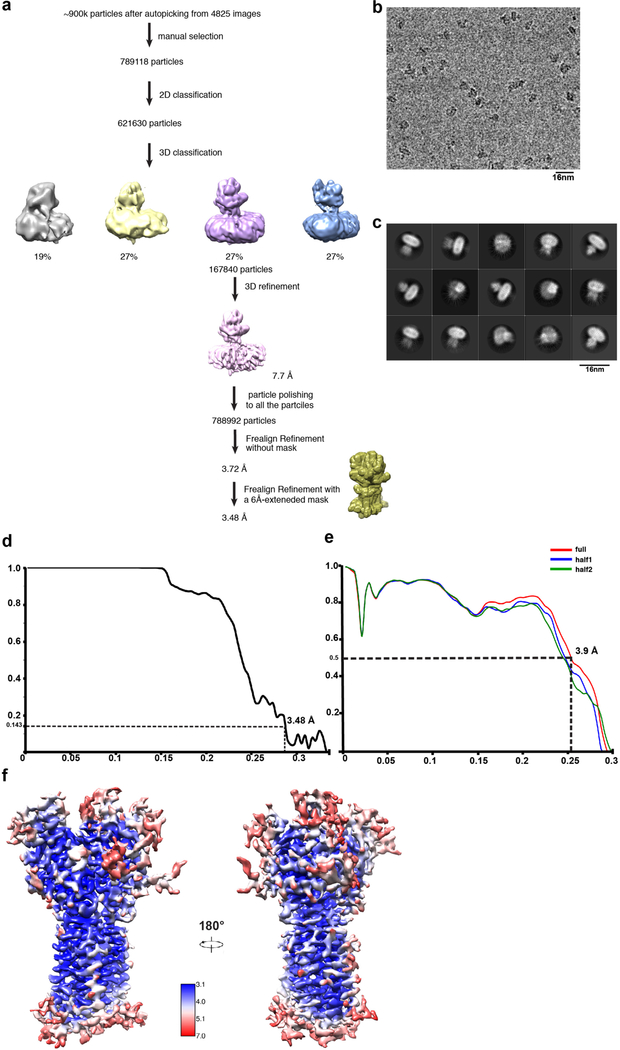
Extended Data Fig. 3. Data processing and model quality assessment of Ptch1*.
a, The data processing work-flow for Ptch1*. b, A representative electron micrograph at defocus −2.0 µm. c, 2D classification. d, Fourier shell correlation (FSC) curve of the structure with FSC as a function of resolution using Frealign output. e, The FSC curves calculated between the refined structure and the half map used for refinement, the other half map, and the full map. f, Density maps of Ptch1* structure colored by local resolution estimation using blocres.
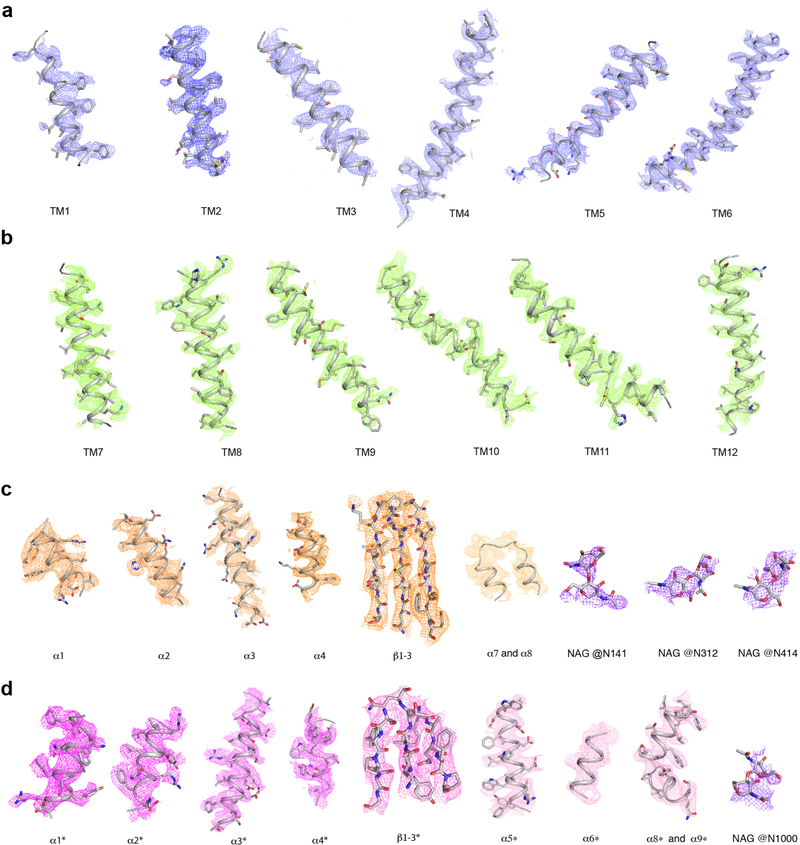
Extended Data Fig. 4. Electron microscopy density of different portions of Ptch1* at 5σ level.
a, TMs 1–6. b, TMs 7–12. c, ECD-I. d, ECD-II. NAG denotes N-Acetylglucosamine.
Extended Data Fig. 5. NPC1 and Patched SSD structural and surface comparison.
a, NPC1-SSD. The putative pocket (indicated by red arrow) in the SSD is created by TMs 3–5. b, Patched-SSD.
Extended Data Fig. 6. Data processing and model quality assessment of Ptch1*–Shh-N.
a, The data processing work-flow for Ptch1*–Shh-N. b, A representative electron micrograph at defocus −2.0 µm. c, 2D classification. d, Fourier shell correlation (FSC) curve of the structure with FSC as a function of resolution using Frealign output. e, The FSC curves calculated between the refined structure and the half map used for refinement, the other half map, and the full map. f, Density maps of Ptch1*–Shh-N structure colored by local resolution estimation using blocres.
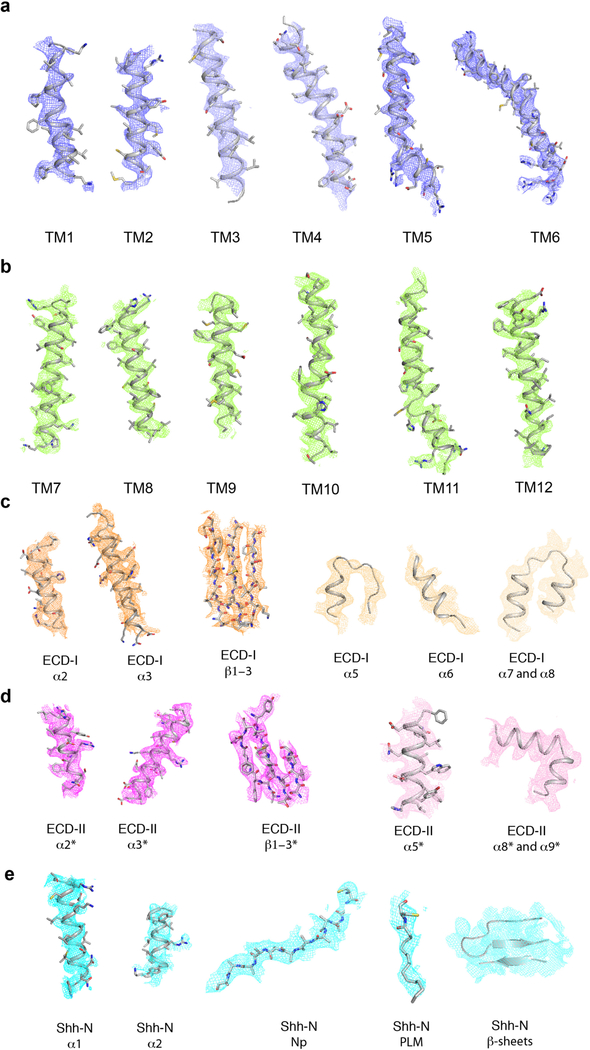
Extended Data Fig. 7. Electron microscopy density of different portions of Ptch1*–Shh-N complex.
a, TMs 1–6 at 5σ level. b, TMs 7–12 at 5σ level. c, Major structural elements of ECD-I at 4.5σ level, d, Major structural elements of ECD-II at 4.5σ level. e, Major structural elements of Shh-N at 4.5σ level; PLM at 3σ level.
Extended Data Fig. 8. Ptch1*–Shh-N binding assay in detergent-free system.
a, Size-exclusion chromatogram and SDS-PAGE gel of the purified Ptch1* with Amphipol A8–35 in buffer A. Molecular standards indicated on left side of SDS-PAGE gels and above the elution curves. b, 5E1 does not compete with the binding of native Shh-N to Ptch1*. 5E1 and Shh-N at a 1:1 molar ratio were incubated with Ptch1*– immobilized Flag-M2 resin; the complex was eluted by Flag-peptide. Protein was detected by Coomassie-staining. The assay was reproduced three times with the similar results.
Acknowledgements
We appreciate support and suggestions from Günter Blobel, and dedicate this manuscript to him. We thank M. Ebrahim and J. Sotiris at the Evelyn Gruss Lipper Cryo-EM Resource Center of the Rockefeller University for assistance with data collection and D. Nicastro and Z. Chen at the UT Southwestern Cryo-EM Facility for facility access and data acquisition; L. Beatty for help with tissue culture; A. Lemoff at the UT Southwestern Proteomics Core for mass spectrometry identification; B. Chen and J. Kim for 5E1 antibody, Shh-light II cells and Ptch1−/− MEFs; M. Brown, E. Debler, J. Goldstein, J. Jiang, D. Rosenbaum and Z. Zhang for discussion. This work was supported by the Endowed Scholars Program in Medical Science of UT Southwestern Medical Center and O’Donnell Junior Faculty Funds (to X.L.), by NIH grant P01 HL020948 (Tissue Culture Core), by the Rockefeller University (to E.C.) and by the National Key Research and Development Program of MOST (Nos 2016YFA0501103 and 2015CB910104 to J.W.). X.L. is the Rita C. and William P. Clements, Jr. Scholar in Biomedical Research of UT Southwestern.
Footnotes
Competing interests The authors declare no competing interests.
References:
- 1.Ingham PW & McMahon AP Hedgehog signaling in animal development: paradigms and principles. Genes & development 15, 3059–3087, doi: 10.1101/gad.938601 (2001). [DOI] [PubMed] [Google Scholar]
- 2.Jiang J & Hui CC Hedgehog signaling in development and cancer. Developmental cell 15, 801–812, doi: 10.1016/j.devcel.2008.11.010 (2008). [DOI] [PMC free article] [PubMed] [Google Scholar]
- 3.Briscoe J & Therond PP The mechanisms of Hedgehog signalling and its roles in development and disease. Nature reviews. Molecular cell biology 14, 416–429, doi: 10.1038/nrm3598 (2013). [DOI] [PubMed] [Google Scholar]
- 4.Hooper JE & Scott MP Communicating with Hedgehogs. Nature reviews. Molecular cell biology 6, 306–317, doi: 10.1038/nrm1622 (2005). [DOI] [PubMed] [Google Scholar]
- 5.Taipale J & Beachy PA The Hedgehog and Wnt signalling pathways in cancer. Nature 411, 349–354, doi: 10.1038/35077219 (2001). [DOI] [PubMed] [Google Scholar]
- 6.Rubin LL & de Sauvage FJ Targeting the Hedgehog pathway in cancer. Nature reviews. Drug discovery 5, 1026–1033, doi: 10.1038/nrd2086 (2006). [DOI] [PubMed] [Google Scholar]
- 7.Li X et al. Structure of human Niemann-Pick C1 protein. Proceedings of the National Academy of Sciences of the United States of America 113, 8212–8217, doi: 10.1073/pnas.1607795113 (2016). [DOI] [PMC free article] [PubMed] [Google Scholar]
- 8.Beachy PA, Hymowitz SG, Lazarus RA, Leahy DJ & Siebold C Interactions between Hedgehog proteins and their binding partners come into view. Genes & development 24, 2001–2012, doi: 10.1101/gad.1951710 (2010). [DOI] [PMC free article] [PubMed] [Google Scholar]
- 9.Pepinsky RB et al. Identification of a palmitic acid-modified form of human Sonic hedgehog. The Journal of biological chemistry 273, 14037–14045 (1998). [DOI] [PubMed] [Google Scholar]
- 10.Chamoun Z et al. Skinny hedgehog, an acyltransferase required for palmitoylation and activity of the hedgehog signal. Science 293, 2080–2084, doi: 10.1126/science.1064437 (2001). [DOI] [PubMed] [Google Scholar]
- 11.Tukachinsky H, Petrov K, Watanabe M & Salic A Mechanism of inhibition of the tumor suppressor Patched by Sonic Hedgehog. Proceedings of the National Academy of Sciences of the United States of America 113, E5866–E5875, doi: 10.1073/pnas.1606719113 (2016). [DOI] [PMC free article] [PubMed] [Google Scholar]
- 12.Williams KP et al. Functional antagonists of sonic hedgehog reveal the importance of the N terminus for activity. Journal of cell science 112 Pt 23), 4405–4414 (1999). [DOI] [PubMed] [Google Scholar]
- 13.Kohtz JD et al. N-terminal fatty-acylation of sonic hedgehog enhances the induction of rodent ventral forebrain neurons. Development 128, 2351–2363 (2001). [DOI] [PubMed] [Google Scholar]
- 14.Petrova E, Rios-Esteves J, Ouerfelli O, Glickman JF & Resh MD Inhibitors of Hedgehog acyltransferase block Sonic Hedgehog signaling. Nature chemical biology 9, 247–249, doi: 10.1038/nchembio.1184 (2013). [DOI] [PMC free article] [PubMed] [Google Scholar]
- 15.Goldstein JL, DeBose-Boyd RA & Brown MS Protein sensors for membrane sterols. Cell 124, 35–46, doi: 10.1016/j.cell.2005.12.022 (2006). [DOI] [PubMed] [Google Scholar]
- 16.Ingham PW, Taylor AM & Nakano Y Role of the Drosophila patched gene in positional signalling. Nature 353, 184–187, doi: 10.1038/353184a0 (1991). [DOI] [PubMed] [Google Scholar]
- 17.Taipale J, Cooper MK, Maiti T & Beachy PA Patched acts catalytically to suppress the activity of Smoothened. Nature 418, 892–897, doi: 10.1038/nature00989 (2002). [DOI] [PubMed] [Google Scholar]
- 18.Ingham PW et al. Patched represses the Hedgehog signalling pathway by promoting modification of the Smoothened protein. Current biology CB 10, 1315–1318 (2000). [DOI] [PubMed] [Google Scholar]
- 19.Gong X et al. Structural insights into the Niemann-Pick C1 (NPC1)-mediated cholesterol transfer and Ebola infection. Cell 165, 1467–1478 (2016). [DOI] [PMC free article] [PubMed] [Google Scholar]
- 20.Sharpe HJ, Wang W, Hannoush RN & de Sauvage FJ Regulation of the oncoprotein Smoothened by small molecules. Nature chemical biology 11, 246–255, doi: 10.1038/nchembio.1776 (2015). [DOI] [PubMed] [Google Scholar]
- 21.Fleet A, Lee JP, Tamachi A, Javeed I & Hamel PA Activities of the Cytoplasmic Domains of Patched-1 Modulate but Are Not Essential for the Regulation of Canonical Hedgehog Signaling. The Journal of biological chemistry 291, 17557–17568, doi: 10.1074/jbc.M116.731745 (2016). [DOI] [PMC free article] [PubMed] [Google Scholar]
- 22.Lu X, Liu S & Kornberg TB The C-terminal tail of the Hedgehog receptor Patched regulates both localization and turnover. Genes & development 20, 2539–2551, doi: 10.1101/gad.1461306 (2006). [DOI] [PMC free article] [PubMed] [Google Scholar]
- 23.Lu F et al. Identification of NPC1 as the target of U18666A, an inhibitor of lysosomal cholesterol export and Ebola infection. eLife 4, doi: 10.7554/eLife.12177 (2015). [DOI] [PMC free article] [PubMed] [Google Scholar]
- 24.Li X et al. 3.3 A structure of Niemann-Pick C1 protein reveals insights into the function of the C-terminal luminal domain in cholesterol transport. Proceedings of the National Academy of Sciences of the United States of America 114, 9116–9121, doi: 10.1073/pnas.1711716114 (2017). [DOI] [PMC free article] [PubMed] [Google Scholar]
- 25.Long J et al. Identification of a family of fatty-acid-speciated sonic hedgehog proteins, whose members display differential biological properties. Cell reports 10, 1280–1287, doi: 10.1016/j.celrep.2015.01.058 (2015). [DOI] [PMC free article] [PubMed] [Google Scholar]
- 26.McLellan JS et al. The mode of Hedgehog binding to Ihog homologues is not conserved across different phyla. Nature 455, 979–983, doi: 10.1038/nature07358 (2008). [DOI] [PMC free article] [PubMed] [Google Scholar]
- 27.Pepinsky RB et al. Mapping sonic hedgehog-receptor interactions by steric interference. The Journal of biological chemistry 275, 10995–11001 (2000). [DOI] [PubMed] [Google Scholar]
- 28.Allen BL et al. Overlapping roles and collective requirement for the coreceptors GAS1, CDO, and BOC in SHH pathway function. Developmental cell 20, 775–787, doi: 10.1016/j.devcel.2011.04.018 (2011). [DOI] [PMC free article] [PubMed] [Google Scholar]
- 29.Yao S, Lum L & Beachy P The ihog cell-surface proteins bind Hedgehog and mediate pathway activation. Cell 125, 343–357, doi: 10.1016/j.cell.2006.02.040 (2006). [DOI] [PubMed] [Google Scholar]
- 30.Izzi L et al. Boc and Gas1 each form distinct Shh receptor complexes with Ptch1 and are required for Shh-mediated cell proliferation. Developmental cell 20, 788–801, doi: 10.1016/j.devcel.2011.04.017 (2011). [DOI] [PMC free article] [PubMed] [Google Scholar]
- 31.Grant T & Grigorieff N Measuring the optimal exposure for single particle cryo-EM using a 2.6 A reconstruction of rotavirus VP6. eLife 4, e06980, doi: 10.7554/eLife.06980 (2015). [DOI] [PMC free article] [PubMed] [Google Scholar]
- 32.Rohou A & Grigorieff N CTFFIND4: Fast and accurate defocus estimation from electron micrographs. Journal of structural biology 192, 216–221, doi: 10.1016/j.jsb.2015.08.008 (2015). [DOI] [PMC free article] [PubMed] [Google Scholar]
- 33.Scheres SH RELION: implementation of a Bayesian approach to cryo-EM structure determination. Journal of structural biology 180, 519–530, doi: 10.1016/j.jsb.2012.09.006 (2012). [DOI] [PMC free article] [PubMed] [Google Scholar]
- 34.Rubinstein JL & Brubaker MA Alignment of cryo-EM movies of individual particles by optimization of image translations. Journal of structural biology 192, 188–195, doi: 10.1016/j.jsb.2015.08.007 (2015). [DOI] [PubMed] [Google Scholar]
- 35.Zhang Z, Liu F & Chen J Conformational Changes of CFTR upon Phosphorylation and ATP Binding. Cell 170, 483–491 e488, doi: 10.1016/j.cell.2017.06.041 (2017). [DOI] [PubMed] [Google Scholar]
- 36.Grigorieff N Frealign: An Exploratory Tool for Single-Particle Cryo-EM. Methods in enzymology 579, 191–226, doi: 10.1016/bs.mie.2016.04.013 (2016). [DOI] [PMC free article] [PubMed] [Google Scholar]
- 37.Emsley P, Lohkamp B, Scott WG & Cowtan K Features and development of Coot. Acta crystallographica. Section D, Biological crystallography 66, 486–501, doi: 10.1107/S0907444910007493 (2010). [DOI] [PMC free article] [PubMed] [Google Scholar]
- 38.Adams PD et al. PHENIX: a comprehensive Python-based system for macromolecular structure solution. Acta crystallographica. Section D, Biological crystallography 66, 213–221, doi: 10.1107/S0907444909052925 (2010). [DOI] [PMC free article] [PubMed] [Google Scholar]
- 39.Murshudov GN, Vagin AA & Dodson EJ Refinement of macromolecular structures by the maximum-likelihood method. Acta crystallographica. Section D, Biological crystallography 53, 240–255, doi: 10.1107/S0907444996012255 (1997). [DOI] [PubMed] [Google Scholar]
- 40.Brown A et al. Tools for macromolecular model building and refinement into electron cryo-microscopy reconstructions. Acta crystallographica. Section D, Biological crystallography 71, 136–153, doi: 10.1107/S1399004714021683 (2015). [DOI] [PMC free article] [PubMed] [Google Scholar]
- 41.Eyck LFT Efficient structure-factor calculation for large molecules by the fast fourier transform. Acta Crystallogr. A 33, 486–492 (1977). [Google Scholar]
- 42.Wang Z et al. An atomic model of brome mosaic virus using direct electron detection and real-space optimization. Nature communications 5, 4808, doi: 10.1038/ncomms5808 (2014). [DOI] [PMC free article] [PubMed] [Google Scholar]
- 43.Heymann JB & Belnap DM Bsoft: image processing and molecular modeling for electron microscopy. Journal of structural biology 157, 3–18, doi: 10.1016/j.jsb.2006.06.006 (2007). [DOI] [PubMed] [Google Scholar]
- 44.Chen VB et al. MolProbity: all-atom structure validation for macromolecular crystallography. Acta crystallographica. Section D, Biological crystallography 66, 12–21, doi: 10.1107/S0907444909042073 (2010). [DOI] [PMC free article] [PubMed] [Google Scholar]
- 45.Pettersen EF et al. UCSF Chimera--a visualization system for exploratory research and analysis. Journal of computational chemistry 25, 1605–1612, doi: 10.1002/jcc.20084 (2004). [DOI] [PubMed] [Google Scholar]
Associated Data
This section collects any data citations, data availability statements, or supplementary materials included in this article.
Data Availability Statement
The 3D cryo-EM density maps of Ptch1* and Ptch1*–Shh-N have been deposited in the Electron Microscopy Data Bank under the accession numbers EMD-7795 and EMD-7796. Atomic coordinates for the atomic model of Ptch1* and Ptch1*–Shh-N complex have been deposited in the Protein Data Bank under the accession numbers 6D4H and 6D4J. All other data is available from the corresponding authors upon reasonable request.


