

Abstract
Rock climbing is a physical activity that not only causes an increase in muscle tension, heart rate and blood pressure, but also results in the elevation of stress hormones including cortisol. It has not been established which of the above mentioned variables serve as the most accurate indicator of rock climbing-induced physical and mental stress. The aim of this study was to evaluate the effect of physical activity, short-term fatigue and mental demand on heart rate (HR), salivary cortisol (C) and blood plasma lactate (LA) concentrations in rock climbers under laboratory conditions. Twelve male and female rock climbers of comparable climbing performance (5a – 6b OS) were recruited. The participants completed two routes of different climbing difficulty (effect of physical demand), repeated a difficult route with a short 5-min recovery period three times (effect of fatigue), and repeated a difficult lead climb (effect of mental demand). Heart rate as well as C and LA concentrations were determined. The results indicated that more difficult climbing routes elicited increases in HR (especially relative values) and LA concentrations, whereas fatigue accumulation had an effect on climbing HR and relative C concentration values. Lead climbing only caused an increase in climbing HR. Based on the results it was concluded that HR was a good indicator of physical and mental stress intensity. Performing the same difficult route three times with a short recovery period in-between turned out to be the most demanding task and resulted in the highest increase of the cortisol concentration. Dynamics of changes in lactate concentrations depend on muscle loading (local muscular effort), lactate clearance and technical/tactical skills of the climber.
Key words: workload intensity, physiological response, rock climbing
Introduction
Determination of the workload is an important element of physical activity analysis. The variables of workload include intensity, volume and duration of recovery periods. The last two are easy to determine, yet evaluation of intensity in rock climbing is quite difficult.
Intensity of effort in rock climbing may increase as a result of greater engagement of upper limbs muscles (increase in % maximal voluntary contraction – %MVC) or greater effort of the whole body (eg., an increase in climbing velocity). However, increases in climbing route difficulty frequently cause redistribution of the workload to smaller muscle groups directly engaged in climbing (an increase in local muscular effort). An example could be grip surface reductions, holding a one-finger-pocket with the distal phalanx places an enormous stress on finger flexors muscles, but is a small effort for the body as a whole. Considering the above, the determination of rock climbing intensity is a difficult task. At present, intensity evaluation is based on subjective assessments of physical effort, which has obvious disadvantages.
Portable heart rate monitors are a popular diagnostic tool used in various types of physical exercise, mainly endurance training, to monitor and control training intensity. The linear relationship between heart rate (HR), oxygen uptake (VO2) and energy expenditure (EE) during submaximal exercise justifies the use of HR for the determination of workload intensity. An optimal HR-based training program not only allows positive adaptation of the body to physical effort (resulting in improvement of sports performance), but also helps prevent negative consequences of excessive physical activity (overtraining) (Achten and Jeukendrup, 2003).
Use of the HR as a climbing intensity indicator continues to raise controversies among researchers. Bernik and Jereb (2007) emphasized that several factors might contribute to the HR increase during climbing. Some of these factors are difficult to measure. Additionally, the workload is quite local and does not cause significant changes in the HR. A number of studies (Booth et al., 1999; Michailov, 2014; Sheel et al., 2003) demonstrated that the linear relationship between HR and VO2 could be disturbed in climbing. The heart rate is disproportionately high to oxygen uptake which is accounted for by 1) sustained isometric contractions that hinder the local blood flow, 2) the muscle metaboreflex, 3) the arms being repeatedly held above the heart level, 4) reliance on both aerobic and anaerobic energy systems (Michailov, 2014). It is therefore difficult to determine energy expenditure based solely on the HR. Despite the above mentioned inadequacies, we decided to review and verify the usefulness of the HR for the determination of climbing intensity.
Studies on rock climbing tend to ignore its mental aspects and treat climbing as a purely physical task (Hodgson et al., 2009). However, climbing is undoubtedly a multidimensional activity that incorporates both physiological and psychological components (Fryer et al., 2012; Magiera et al., 2013). Completion of a climbing route places physical and mental stress and sometimes also social pressure on the climber. Only few authors have attempted to evaluate physical and mental stress inherently associated with rock climbing (Draper et al., 2008; Hodgson et al., 2009; Sherk et al., 2010; Williams et al., 1978). Selye (1974) defined stress as ”the nonspecific response of the body to any demand made upon it”. Although many other definitions have been in use since that time, the Seyle’s definition is still among key founding concepts for the current views on stress (Goldstein and Kopin, 2007). The nonspecific response consists of the stimulation of the autonomic nervous system (ANS) and the hypothalamic-pituitary-adrenal (HPA) axis. ANS activation can be estimated based on the heart rate (HR) and it triggers the release of catecholamines from the adrenal medulla. The ultimate effect of HPA axis activation is the release of cortisol (C) commonly referred to as the major stress hormone (Suay et al., 2012).
Considering the above, we attempted to determine the best variable to objectively measure physical and mental stress induced by rock climbing. The effect of physical demand, short-term fatigue and mental demand on the heart rate (HR), cortisol (C) and lactate (LA) concentrations were evaluated in rock climbers under laboratory conditions.
Methods
Participants
Twelve rock climbers (5 women and 7 men) of comparable climbing performance (5a – 6b OS) and lead climbing skills were recruited. The mean age of the study participants was 23 ± 4.6 years, body mass 63 ± 8.6 kg, body height 171 ± 6.7 cm; they had from 1 to 6 years of climbing experience. The participants received comprehensive information on the study procedures, aims and risks and signed an informed consent form. The study was performed in accordance with the Declaration of Helsinki and was approved by the Institutional Ethics Committee (Nr 10/2014).
Procedures
In an attempt to establish which of the examined variables would prove the best indicator of physical and mental stress, physiological responses of participants to climbing were compared with respect to the handhold depth, safety rope protocol and duration of the recovery period. In order to minimize other external influences, the experimental conditions were precisely determined, ie.,
standardized climbing technique and climbing velocity – repetition of an identical climbing move of 8 s duration;
the same emotional arousal, top roping, during this style of the ascent the climber does not need to attend to the safety rope, thus he/she can concentrate on the physical moves in a secure setting (Draper et al., 2008) (except for the trial testing the effects of change in the safety rope protocol), familiarity with climbing routes and study procedures;
no effect of fatigue – recovery periods > 20 min (except for the trial testing the effects of fatigue);
uniform external environment conditions – the same time of day, similar temperature and humidity in the indoor climbing settings.
Two rows of handholds including jugs (held with the entire hand, 4 fingers, 3 phalanges, Figure 1b) and two-finger pockets (2 fingers and a single distal phalanx, Figure 1a) were fixed on a 7 m high climbing wall with the wall angle set at 95° (Figure 2). On the easy route (ER) the climber used jugs as handholds and jugs and two-finger pockets as footholds. They repeated an identical move with a velocity of 3.8 m/min climbing the entire wall length twice (the descent lasted 16 s, the completion of the whole route 240 s). The difficult route (DR) only differed in that two-finger pockets served as handholds. The majority of climbs were top ropings except for the last one.
Figure 1.
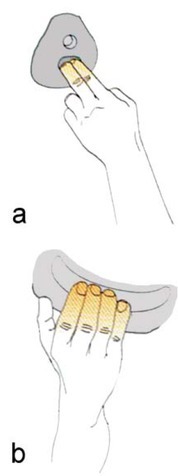
Types of handholds used: a – two-finger pocket (2 fingers, I phalanx), b – jug (4 fingers, III phalanges)
Figure 2.
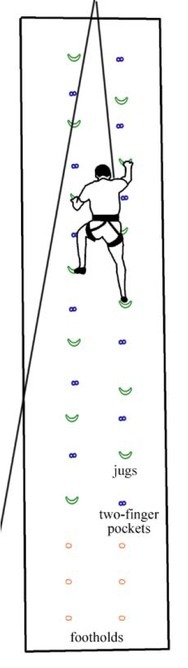
Climbing route (handholds: jugs – Easy Route, two-finger pockets – Difficult Route)
The experiment consisted of 3 phases separated by a recovery period of at least 48 hours:
phase one (P I): getting acquainted with the study procedure including a top rope climb on the easy and difficult routes;
phase two (P II): part 1 - each participant completed two routes of different climbing difficulty (an easy and then a difficult route – effect of greater physical effort) with a >20 min passive recovery period in-between. Part 2 –climbers were asked to complete the difficult route three times with a short 5-min rest period in-between (effect of fatigue);
phase three (P III) – repetition of part 1 of the phase two in order to determine HR measurement reliability (test-retest) and, subsequently, repetition of the difficult route with a change in the safety rope protocol (lead climb – effect of mental demand). Lead climbing has a large impact on somatic anxiety and self-confidence (Draper et al., 2008).
Each phase was preceded by a 10 min warm-up. In phases II and III saliva was sampled after waking up for determination of cortisol concentration (Cmorning) and later on, before the warm-up, saliva and fingertip capillary blood samples were taken to estimate cortisol (Cpre-warm-up) and lactate (LApre-warm-up) concentrations, respectively.
Subsequent evaluation was performed at the following timepoints:
10 min before each climb fingertip capillary blood samples were collected for LA concentration (LApre) with the participants in a sitting position;
between minute 7 and 2 before the climb, the average pre-climb HR (Pre-HRave) was calculated;
2 min before starting the climb, the participants had time to prepare for climbing (putting on shoes, tying into the rope); saliva samples were taken to determine cortisol concentration (Cpre).
during 4 min of climbing the heart rate was measured (CL-HRstart, CL-HRave, CL-HRpeak);
immediately after the descent, saliva (Cpost) and blood (LApost) samples were collected;
15 min after the descent, saliva samples (C15post) were collected again.
Exceptions to the above procedure were as follows:
during P II (three repetitions of the difficult route with two 5 min rest periods in- between) only the HR was monitored;
during P III (easy route part) cortisol and lactate concentrations were not determined, as only accuracy and reliability of the HR measurement during climbing were tested.
HR measurements and analysis
HR measurements were recorded using the Polar V800 heart rate monitor characterized by high quality and measurement reliability (Weippert, 2010). The registered data were subsequently analysed with dedicated software Polar Pro Trainer 5.41 and Polar Flow (Polar Electro Oy, Finland).
The HR was monitored throughout the study. Prior to the climb, the value of the 3-min heart rate registered in the sitting position was analysed and the average heart rate was calculated (Pre-HRave). The HR was also taken immediately before starting the climb (CL-HRstart). During the climb the average climb HR (CL-HRave) and peak climb HR (CL-HRpeak) were determined. Relative HR values were also analysed, ie., ΔHRstart-pre, ΔHRave-pre, ΔHRpeak-pre, ΔHRave-start and ΔHRpeak-start. The HR averaging period was set at 1 s.
Biochemical determinations
Salivary cortisol concentrations (C)
Salivary cortisol is a reliable indicator of serum unbound-cortisol fraction, which helps identify stress levels (Papacosta and Nassis, 2011). Saliva samples were taken in the morning, immediately after waking up under fasting conditions (Cmorning), before the warm-up (Cpre-warm-up), before the climb (Cpre), immediately after the descent (Cpost) and 15 min after the descent (C15post). Differences between post- and pre-climb cortisol levels (ΔC post-pre, ΔC15 post-pre) were analysed. Saliva was collected using special saliva sampling devices (Sali-Tubes 100 SLV-4158; DRG Instruments GmbH, Germany) and stored at -20oC until assay. Salivary cortisol was determined with the Salivary Cortisol ELISA KIT SLV-2930 (DRG Instruments GmbH, Germany).
Blood plasma lactate concentrations (LA)
Fingertip capillary blood lactate levels were determined in 20 μl samples collected before the warm-up (LApre-warm-up), immediately before the climb (LApre) and after the descent (LApost). Previous research revealed a strong relationship between the fingertip and first toe (Freyer et al., 2011) or fingertip and ear lobe capillary blood lactate levels in climbers (Draper et al., 2006). The difference between post- and pre-climb lactate levels was also analysed (ΔLA post-pre). LA concentration was determined using Biosen C-line Clinic (EKF-Diagnostics GmbH, Germany).
Statistical analysis
All analyses were performed using the STATISTICA program, version 12.0 (StatSoft, USA). Results are expressed as mean ± standard deviation. Groups of data (test-retest, easy - difficult route, one climb – three repetitions, top rope climb – lead climb) were compared using the Wilcoxon matched pair test. Differences were considered to be significant at p < 0.05.
Results
The results are presented in Table 1. Due to considerable inter-climber differences in the study variables, relative values are also presented (Table 2) reflecting changes to a given variable during the climb (difference between post- and pre-climb values).
Table 1.
Absolute values of HR and cortisol and lactate concentrations on two separate days (phases II and III) measured before, during and after completion of easy and difficult routes, with long and short recovery and in top rope and lead climbs
| II-ERTR | II-DRTR | II-DR3r | III-ERTR | III-DRTR | III-DRL | |
|---|---|---|---|---|---|---|
| CL-HRpeak (beats/min) | 136 ± 15 | 142 ± 13 b | 148 ± 14 c | 133 ± 9 | 140 ± 11 | 148 ± 12 d |
| CL-HRave (beats/min) | 126 ± 14 | 129 ± 13 | 133 ± 12 | 122 ± 8 a | 129 ± 11 | 136 ± 11 d |
| CL-HRstart (beats/min) | 104 ± 16 | 97 ± 17 b | 92 ± 14 | 91 ± 5 a | 97 ± 12 | 99 ± 16 |
| Pre-HRave (beats/min) | 86 ± 12 | 78 ± 9 b | 76 ± 9 | 83 ± 11 | 80 ± 11 | 80 ± 10 |
| Cpre (ng/ml) | 6.38 ± 2.30 | 5.14 ± 1.60 b | 4.31 ± 0.95 c | 4.82 ± 1.19 | 4.41 ± 0.99 | |
| Cpost (ng/ml) | 6.90 ± 2.05 | 5.68 ± 1.59 b | 5.56 ± 1.91 | 5.33 ± 1.33 | 5.06 ± 1.08 | |
| C15post (ng/ml) | 5.53 ± 1.96 | 4.37 ± 0.90 b | 4.60 ± 1.63 | 4.11 ± 1.04 | 4.35 ± 0.95 | |
| LApre (mmol/l) | 2.18 ± 0.89 | 1.77 ± 0.70 | 1.94 ± 0.97 | 1.83 ± 0.53 | 1.90 ± 0.49 | |
| LApost (mmol/l) | 1.89 ± 0.50 | 2.64 ± 0.78 b | 1.99 ± 0.91 c | 2.43 ± 0.66 | 2.62 ± 0.32 |
Table 2.
Relative values of HR and cortisol and lactate concentrations on two separate days (phases II and III) calculated as differences between post- and pre-climb variables of the easy and difficult routes with long and short recovery, in top rope and lead climbs
| II‐ERTR | II‐DRTR | II‐DR3r | III ‐ERTR | III‐DRTR | III‐DRL | |
|---|---|---|---|---|---|---|
| ΔHRpeak‐pre | 50 ± 12 | 64 ± 14 b | 72 ± 15 c | 50 ± 12 | 60 ± 14 | 67 ± 14 d |
| ΔHRpeak‐start | 32 ± 9 | 46 ± 14 b | 56 ± 16 c | 42 ± 9 a | 43 ± 8 | 49 ± 16 |
| ΔHRave‐pre | 40 ± 11 | 51 ± 12 b | 57 ± 14 c | 30 ± 7 | 32 ± 6 | 37 ± 14 d |
| ΔHRave‐start | 22 ± 9 | 32 ± 11 b | 57 ± 14 c | 38 ± 10 a | 49 ± 12 | 56 ± 11 |
| ΔHRstart‐pre | 18 ± 11 | 19 ± 12 | 16 ± 12 | 8 ± 7 a | 17 ± 12 | 19 ± 12 |
| ΔC15 post‐pre | -0.88 ± 0.79 | -0.89 ± 1.19 | 0.24 ± 0.99 c | -0.30 ± 1.89 | 0.01 ± 0.66 | |
| ΔCpost‐pre | 0.53 ± 0.74 | 0.54 ± 1.03 | 1.24 ± 1.23 c | 0.51 ± 1.06 | 0.65 ± 0.84 | |
| ΔLApost‐pre | -0.29 ± 0.77 | 0.86 ± 0.78 b | 0.05 ± 1.23 | 0.60 ± 0.76 | 0.72 ± 0.62 |
a p <0.05 test-retest (II-ERTR vs III-ERTR, II-DRTR vs III-DRTR)
b p <0.05 increase in route difficulty (II-ERTR vs II-DRTR)
c p <0.05 effect of 5 min recovery periods between three climbs (II-DRTR vs II-DR3r)
d p <0.05 effect of change in safety rope protocol: top rope climb → lead climb (III-DRTR vs III-DRL) ERTR – Easy route – top rope climb; DRTR – Difficult route – top rope climb; DR3r – Difficult route 3 repetitions; DRL – Difficult route – lead climb
Changes in the heart rate, salivary cortisol and blood plasma lactate concentrations on two separate days and under different experimental conditions are presented in Figures 3, 4 and 5, respectively.
Figure 3.
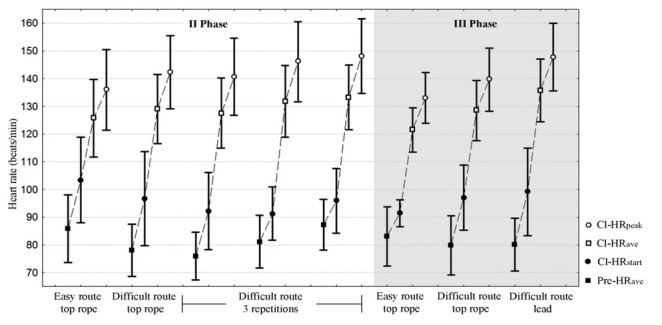
HR changes (Pre-HRave, Cl-HRstart, Cl-HRave, Cl-HRpeak) on two separate days and under different experimental conditions Pre-HRave – 3 min heart rate in the sitting position before the climb, Cl-HRstart – heart rate immediately before starting the climb, Cl-HRave - average climbing heart rate, Cl-HRpeak - peak climbing heart rate
Figure 4.
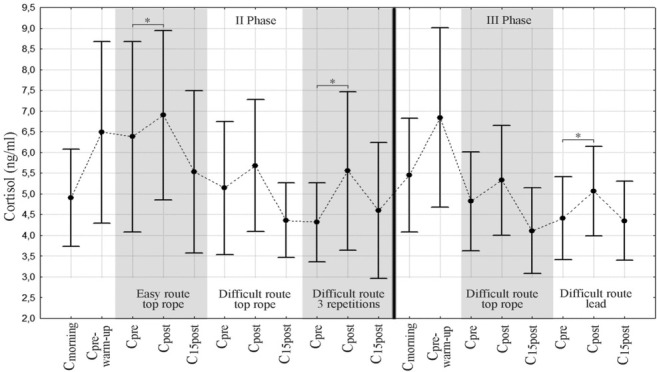
Salivary cortisol concentrations on two measurement days (Note: no cortisol determination during III Phase - Easy Route part)* - statistical significance (p < 0.05) - comparative analysis of pre- and post-climbing cortisol levels Cmorning- cortisol level after waking-up, Cpre-warm-up – cortisol level before the warm-up, Cpre – pre-climbing cortisol level, Cpost - post-climbing cortisol level
Figure 5.
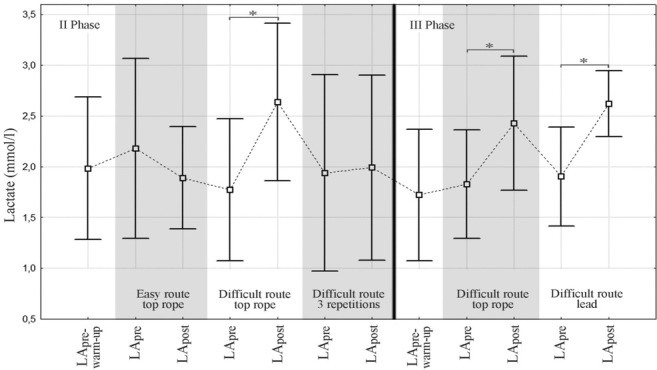
Capillary blood lactate concentrations on two measurement days (Note: no lactate determination during III Phase- Easy Route part)* - statistical significance (p < 0.05) - comparative analysis of pre- and post-climbing lactate levels LApre-warm-up – lactate level before the warm-up, LApre – pre-climbing lactate level, LApost - post-climbing lactate level
Change in route difficulty
The easy and difficult routes only differed in handhold depth (3 vs 1 phalanx and the use of 4 vs 2 fingers). The increase in route difficulty was reflected in the heart rate (CL-HRpeak: ER: 136 vs DR: 142) and all ΔHR values (except for ΔHRstart-pre). Blood lactate concentrations increased after the difficult compared to the easy route (LApost DR: 2.64 vs ER: 1.89) and so did their relative values (LApost-pre). No similar response was observed with respect to CL-HRave, ΔHRstart-pre, LApre and relative cortisol values. The following variables decreased after the difficult route: CL-HRstart, Pre-HRave and all absolute cortisol values.
Effect of fatigue
Cutting the rest period from approximately 30 to 5 min caused a significant difference in the workload. Fatigue accumulation after three repetitions of the difficult route had an effect on CL-HRpeak (DRTR: 142 vs DR3r: 148), ΔHRpeak-pre and ΔHRave-pre and cortisol concentrations (ΔC15 post-pre, ΔC post-pre). CL-HR elevation was caused by an increase in Pre-HRave as measured during each recovery (Figure 3).
The lack of differences in sitting and pre-climbing HR (CL-HRstart, Pre-HRave) and pre-climbing lactate concentrations indicate that the conditions of each trial were comparable (however, not regarding Cpre).
Following three repetitions, lactate concentrations were different than expected, ie., lower than after one climb (1.99 vs 2.64), although no significant difference was found with respect to relative values (ΔLA post-pre).
Change in the safety rope protocol
Lead climb was associated with higher CL-HRave (DRL: 136 vs DRTR: 129) and CL-HRpeak (DRL: 148 vs DRTR: 140); ΔHRpeak-pre and ΔHRave-pre were higher as well. No differences related to change in the safety rope protocol were noted in sitting and pre-climbing HR values (Pre-HRave, CL-HRstart), cortisol and lactate concentrations.
Discussion
Our research indicates that changes in the physical demand, short-term fatigue and mental demand of climbing influence heart rate (HR), cortisol (C) and lactate (LA) concentrations in different ways.
Heart rate
Highly dynamic variations of the HR were observed during the experiment and they ranged from 76 ± 9 (in a sitting position before starting the climb) to 148 ± 14 (during climbing) (Figure 3). The HR measurement was accurate and reliable, which was confirmed during the retest day.
The lifting force on shallow holds becomes reduced (Bourne et al., 2011) while the difficulty of climbing moves increases (Delignières et al., 1993). The same happens when fewer fingers are placed into a pocket. Therefore, one of the aims of this study was to determine whether greater local muscular effort (increase in route difficulty) may modify the response of the whole body.
Bertuzzi et al. (2007) compared the workload of easy (5+), moderate (6c) and difficult (7b) routes. In elite climbers (>7c), HRpeak values on the easy, moderate and difficult route were 162 ± 8, 175 ± 5 and 181 ± 7 beats/min, respectively. Similar differences were observed in earlier studies of Bertuzzi et al. (2004), in which >8b climbers completed 6c, 7c and 8c grade routes. In the study of Burnik and Jareb (2007), maximal heart rates on 4c, 5c and 6b grade routes differed significantly and were 142 ± 22, 156 ± 19 and 163 ± 21 beats/min, respectively. The above researchers concluded that heart rate was not an accurate indicator of climbing intensity. Our results also revealed inter-route differences in CL-HRpeak; however, ΔHR values were lower (ER: 136 ± 15 vs DR: 142 ± 13) indicating a lower physiological demand associated with familiarity with the climbing route and a single move type of the same technical difficulty.
In recent years several research reports have been published regarding training optimization for climbing. Strategies to deal more efficiently with the effects of fatigue during recovery were analysed (Draper et al., 2006; Valenzuela et al., 2015). Draper et al. (2006) compared the effects of a two-minute passive recovery period (rest in a seated position) with active recovery (walking) in a study where each climber completed five climbing trails. The duration of the recovery period was 3.5 min (2 min of the transition phase and 1.5 min of the refocusing phase); the mean heart rates at the start and the end of the recovery period did not differ between active and passive recovery conditions. Differences were found in the transition phase in the HR, LA concentration and perceived exertion of the refocusing phase (in the active recovery the HR was higher while LA concentrations and perceived exertion scores were lower compared to passive recovery). A comparison of the post-climb HR in passive recovery (I climb: 154 ± 21, II: 162 ± 19, III: 165 ± 19, IV: 165 ± 16, V: 171 ± 16) with our data (I: 141 ± 14, II: 146 ± 15, III: 148 ± 14) reveals a gradual HR increase associated with fatigue accumulation in both studies.
The only significant difference between lead and top rope ascents found by Fryer et al. (2012) was in HRpeak (84% vs 78% HRmax, respectively) and ascent time; no significant differences were noted with respect to cortisol and blood lactate concentrations nor preclimb anxiety. The authors suggest that a higher HR during lead climbing might be a consequence of longer time spent in isometric contraction while clipping the safety rope - not required in top rope climbing. The key conclusion was that advanced rock climbers did not find lead climbing to be more stressful than top rope climbing. Our climbers had less experience, ie., they were level 2 (intermediate) according to Draper et al. grading (2011). This might have caused considerable inter-climber variability as confirmed by other studies. Draper et al. (2010) compared different climbing styles in nine intermediate climbers and concluded that a lead climb elicited greater physiological and psychological responses compared to top roping. The mean difference in HRpeak and average HR between a lead climb and top rope climb was 10 beats/min (175 vs 165) and 8 beats/min (159 vs 151), respectively, which, however, did not reach the level of statistical significance. The differences observed in our study were similar, yet statistically significant. These contradictory results might possibly be accounted for by the fact that, in the Draper et al.’s study (2010), top rope climbing took half the time of the lead climb (87 ± 22 vs 193 ± 30 s); it is generally acknowledged that increases in climbing velocity result in HR elevation. Hardy and Huchinson (2007) also compared the body’s response to effort associated with different climbing. Leading the route at the climber`s limit elicited a higher integrated HR than top-roping the same route (154 ± 11 vs 138 ± 10 beats/min). The difference was also significant during a climb of two grades below the climber’s leading limit (138 ± 13 vs 130 ± 12). It should be noted though that these differences were mainly associated with a learning effect and anxiety and not climbing styles (the lead climb was completed without previous knowledge of the route, whereas top-roping was a repetition climb).
Cortisol
Stress or anticipation of a stressful experience causes the sympathetic nervous system and hypothalamic-pituitary-adrenal axis activation and resultant cortisol release (Suay et al., 2012). Physical exercise elicits considerable changes in salivary cortisol concentration when exercise exceeds the intensity of 60% of VO2max or lasts at least 20 - 30 min (Papacosta and Nassis, 2011). Cortisol levels increase within 10 min and reach a maximum at the 10th-30th min after stress cessation (Suay et al., 2012).
Figure 4 shows that the cortisol level continued to increase from morning to pre-warm-up levels and then decreased during the day, which is consistent with the circadian rhythm of this hormone (highest levels in the morning showing a gradual decrease throughout the day). This diurnal cortisol pattern was disturbed by the climbing effort. The climbing tasks increased cortisol levels. The highest relative salivary cortisol increase was noted immediately after three climbing route repetitions and amounted to approximately 1.3 ng/ml.
It seems relevant to compare our results to those of other researches. Hodgson et al. (2009) examined the effects of three different safety rope protocols (lead, lead and top rope and top rope climb) on plasma cortisol levels. The climbing conditions were designed to invoke high, moderate and low physical and psychological demand. A slight increase (approximately + 4 ng/ml) in the cortisol concentration occurred under the most stressful conditions, lead and top rope did not elicit any changes, while the highest decrease (approximately - 23 ng/ml) was found in response to top roping. In a study previously referred to, Fryer et al. (2012) compared plasma cortisol concentrations after top rope and lead climbs. Peak concentrations (approximately 140 ug/dl) were noted at the 15th min postclimb; however, the increase did not differ significantly compared to pretest values and did not depend on the safety rope protocol. Sherk et al. (2010) analysed cortisol, testosterone and growth hormone responses to continuous vertical climbing until exhaustion (mean climbing time 24.9 ± 1.9 min, mean HRpeak 93.5 ± 1% HRmax). The relative cortisol increase was 17.3 ± 10.9% from pre-climbing to immediately post-climbing and 20.8 ± 9.6% from pre-climbing to 15 min after climbing. However, due to the large variability in the climbers’ response, the increases in cortisol concentrations were not significant (Sherk et al., 2010).
The dynamics of cortisol changes were different in our study – although salivary cortisol concentrations rose during each trial, no differences were found between safety rope protocols. An increase in relative cortisol values was only observed in the trial testing the effects of fatigue – the stress evoked by three repetitions of a difficult route with a short 5 min recovery period turned out to be 2.5 times greater than the stress associated with one completion of the same route. The highest cortisol levels were noted immediately after the descent and not, as expected, 15 min later. The statistically significant differences found in our study may be accounted for by a paradoxical fact that salivary cortisol concentrations reflect, but are not identical to free serum levels of this hormone. Percentage changes in salivary cortisol tend to be greater compared to serum cortisol (Papacosta and Nassis, 2011).
Our results regarding salivary cortisol concentrations are more comparable to those obtained in other sport disciplines, eg., downhill mountain biking. In the study of Sperlich et al. (2012) the levels of salivary cortisol before the qualifying heat and championship race were 8.3 ± 2.9 and 9.4 ± 4.1 ng/ml, respectively; a 1.9-fold elevation was found compared to baseline values indicating pre-start mental stress. No differences were noted with respect to pre- and post-exercise values (measurements were taken for 190 s including 130 s at 90-100% HRmax). The maximum cortisol level in our climbers was ≤ 7.0 ng/ml, ie., within normal range (1.2 – 14.7 ng/ml, Salivary Cortisol ELISA SLV-2930; DRG Instruments GmbH, Germany). It should be emphasized though that physical and mental stress during our study was obviously lower than under competitive conditions.
Lactate
Blood plasma lactate concentration was the third variable used to quantify physical and mental stress in rock climbers. Lactate is accumulated in skeletal muscle when exercise intensity is above the anaerobic threshold resulting in a decrease in intramuscular pH because of the dissociation of H2O into H+ and OH2 to maintain electroneutrality (Lindinger et al., 2005). Lactate removal can be improved both by stimulating its oxidation by the previously working muscles or by increasing the blood flow to other parts of the organism and enhancing its oxidation by hitherto-inactive muscles or other organs such as the liver (Gladden, 2004).
Blood lactate concentration after rock climbing is lower compared to lactate concentration values reached following other activities such as cycling (Sheel et al., 2003), because of the smaller muscle mass exercised. During treadwall climbing until exhaustion, the maximum blood lactate concentrations reached 10.2 - 11.1 mmol/l (Booth et al., 1999; España-Romero, 2009), ie., much higher levels than those usually observed on climbing routes (< 6.8 mmol/l) (Michailov, 2014). LA concentrations revealed in our study were even lower; the highest was 2.64 ± 0.78 mmol/l. LA concentration increased during one completion of the difficult route during Phases II and III (the mean increase was approximately 0.7 mmol/l). No increase after three repetitions of the same route and a slight decrease (non-significant) were observed after completing the easy route (Figure 5). These last two conditions may indicate the predominance of the aerobic energy metabolism, which does not result in a plasma blood LA concentration increase, but can even lead to its reduction. Bertuzzi et al. (2007) did not confirm the hypothesized relationship between the LA concentration’s increase and route difficulty. They compared energy system contributions on easy, moderate and difficult routes. In elite climbers, no statistically significant differences were found in LA concentrations determined after the completion of the above mentioned routes (LA - 5+: 2.4 ± 0.9, LA - 6c: 3.7 ± 0.8, LA - 7b: 3.9 ± 1.8). The authors concluded that the main energy systems required during indoor rock climbing were the aerobic and anaerobic alactic systems (Bertuzzi et al., 2007). The contribution of the anaerobic lactic system with an increase of blood LA concentration was only 15% and did not depend on the training status, route difficulty or aerobic/anaerobic capacity of the climbers. However, other researchers observed that grip strength began to decrease and blood LA to increase when the wall angle exceeded vertical (LA at 91 degrees: 4.9 ± 1.6; 96 degrees: 5.1 ± 1.3; 102 degrees: 5.9 ± 1.2) (Watts and Drobish, 1998). At angles > 90 degrees, local muscular effort becomes increased possibly resulting in LA elevation which is consistent with our results.
Earlier studies on the effect of safety rope protocols on the body responses revealed that blood LA differed depending on the climber’s grade. Intermediate climbers exhibited differences in LA concentrations immediately after (LALEAD: 3.1 ± 0.6 vs LATOP ROPE: 2.5 ± 0.9) and 15 min after the climb (LALEAD: 1.2 ± 0.4 vs LATOP ROPE: 0.8 ± 0.4) (Draper et al., 2010). No such difference was found in advanced performers (LALEAD: 5.2 ± 1.3 vs LATOP ROPE: 4.8 ± 1.1) (Fryer et al., 2012). Despite low climbing performance of our participants, no statistically significant difference was found in LA levels following two different climbing styles (DRTR: 2.43 ± 0.66 vs DRL: 2.62 ± 0.32) which can be explained by preset climbing velocity (that varied strongly in the above mentioned studies) and comparable activation of lactate-generating anabolic processes.
Conclusions
At present, climbing instructors and climbers do not have any tools to objectively evaluate physical and mental stress associated with climbing. Although the scope of our investigations was not broad, we tried to fill in this gap. Three variables were analysed (HR, C and LA), the magnitude of which differed before, during and after climbing.
Our results revealed the HR was the variable that proved most sensitive to physical and mental stress. The climbing HR reliably reflected climbing intensity as confirmed by the applied test/retest method. An increase in the local workload, a determinant of climbing route difficulty, resulted in a HR increase. Furthermore, HRpeak seemed a better indicator of physical and mental stress intensity than HRave and this is due to the fact that average values depend on baseline measurements and slight latency of heart rate response to an increase in muscle work. The HR is also affected by an increase in fatigue during climb repetitions after short recovery time.
Earlier studies indicated that top rope climbing was usually faster and more dynamic than lead climb during which longer time is spent in isometric contractions while clipping the safety rope to preplaced anchors. Climbing experience also turned out of considerable importance; beginners find lead climbing more difficult than top roping. In our study, the effect of climbing velocity was limited; we found higher heart rates during lead climb indicating greater mental demand in less experienced climbers.
Cortisol was another study variable. Three repetitions of the difficult route (the biggest load on the body – the highest stress) with a short recovery period in-between caused a marked increase in post-climbing cortisol concentrations. Although the study procedure did not exceed 3 hours a day, the circadian rhythm of cortisol secretion had its effects. Post-climbing salivary cortisol was the highest immediately after the descent and not, as expected, 15 minutes later.
The dynamics of changes in lactate concentrations depended on muscle loading (local load caused a LA increase in small forearm muscles) and the aerobic metabolism (greater capacity for this type of metabolism might result in an increase of lactate clearance – as in three repetitions of the climbing route). Our results seem to indicate that technical/tactical skills of the climber (and their effect on climbing velocity) may affect lactate production to a greater extent than a change in the safety rope protocol.
References
- Achten J, Jeukendrup AE. Heart Rate Monitoring. Applications and Limitations. Sports Med. 2003;33(7):517–538. doi: 10.2165/00007256-200333070-00004. [DOI] [PubMed] [Google Scholar]
- Bertuzzi RC, Franchini E, Kiss MA. Heart Rate and handgrip acute adjustments during the practice of the indoor rock climbing. Revista Mackenzie de Educacao Fisica w Esporte. 2004;3(3):99–106. [Google Scholar]
- Bertuzzi RC, Franchini E, Kokubun E, Kiss MA. Energy system contributions in indoor rock climbing. Eur J Appl Physiol. 2007;101(3):293–300. doi: 10.1007/s00421-007-0501-0. [DOI] [PubMed] [Google Scholar]
- Booth J, Marino F, Hill Ch, Gwinn T. Energy cost of sport climbing in elite performers. Br J Sports Med. 1999;33:14–18. doi: 10.1136/bjsm.33.1.14. [DOI] [PMC free article] [PubMed] [Google Scholar]
- Bourne R, Halaki M, Vanwanseele B, Clarke J. Measuring lifting forces in rock climbing: effect of hold size and fingertip structure. J Appl Biomech. 2011;27(1):40–46. doi: 10.1123/jab.27.1.40. [DOI] [PubMed] [Google Scholar]
- Burnik S, Jereb B. Heart rate as an indicator of sport climbing intensity. Acta Univ. Palacki. Olomuc. 2007;37(1):63–66. [Google Scholar]
- Delignières D, Famose JP, Thépaut-Mathieu Ch, Fleurance PA. Psychophysical study of difficulty rating in rock climbing. Int J Sport Psychol. 1993;24:404–416. [Google Scholar]
- Draper N, Bird E, Coleman I, Hodgson ChI. Effects of active recovery on lactate concentration, heart rate and RPE in climbing. J Sports Sci Med. 2006;5(1):97–105. [PMC free article] [PubMed] [Google Scholar]
- Draper N, Brent S, Hale B, Coleman I. The influence of sampling site and assay method on lactate concentration in response to rock climbing. Eur J Appl Physiol. 2006;98(4):363. doi: 10.1007/s00421-006-0289-3. [DOI] [PubMed] [Google Scholar]
- Draper N, Couceiro Canalejo J, Fryer S, Dickson T, Winter D, Ellis G, Hamlin M, Shearman J, North Ch. Reporting climbing grades and grouping categories for rock climbing. Isokinet Exerc Sci. 2011;19:273–280. [Google Scholar]
- Draper N, Jones GA, Fryer S, Hodgson ChI, Blackwell G. Physiological and psychological responses to lead and top rope climbing for intermediate rock climbers. Eur J Sport Sci. 2010;10(1):13–20. [Google Scholar]
- Draper N, Jones GA, Fryer S, Hodgson ChI, Blackwell G. Effect of an on-sight lead on the physiological and psychological responses to rock climbing. J Sports Sci Med. 2008;7(4):492–8. [PMC free article] [PubMed] [Google Scholar]
- España-Romero V, Ortega Porcel FB, Artero EG, Jiménez-Pavón D, Gutiérrez Sainz A, Castillo Garzón MJ, Ruiz JR. Climbing time to exhaustion is a determinant of climbing performance in high-level sport climbers. Eur J Appl Physiol. 2009;107(5):517–525. doi: 10.1007/s00421-009-1155-x. [DOI] [PubMed] [Google Scholar]
- Fryer S, Draper N, Dickson T, Blackwell G, Winter D, Ellis G. Comparison of Lactate Sampling Sites for Rock Climbing. Int J Sports Med. 2011;32(6):428. doi: 10.1055/s-0031-1271712. [DOI] [PubMed] [Google Scholar]
- Fryer S, Dickson T, Draper N, Blackwell G, Hillier S. A psychophysiological comparison of on-sight lead and top rope ascents in advanced rock climbers. Scand J Med Sci Sports. 2012;23(5):645–650. doi: 10.1111/j.1600-0838.2011.01432.x. [DOI] [PubMed] [Google Scholar]
- Gladden LB. Lactate metabolism: a new paradigm for the third millennium. Goldstein DS, Kopin IJ. Evolution of concepts of stress. J Physiol. Stress. 2004;2007;55810(1)(2):5–30. 109–120. doi: 10.1113/jphysiol.2003.058701. [DOI] [PMC free article] [PubMed] [Google Scholar]
- Goldstein DS, Kopin IJ. Evolution of concepts of stress. Stress. 2007;10(2):109–120. doi: 10.1080/10253890701288935. [DOI] [PubMed] [Google Scholar]
- Hardy L, Hutchinson A. Effects of performance anxiety on effort and performance in rock climbing: a test of processing efficiency theory. Anxiety Stress Coping. 2007;20(2):147–161. doi: 10.1080/10615800701217035. [DOI] [PubMed] [Google Scholar]
- Hodgson CI, Draper N, McMorris T, Jones G, Fryer S, Coleman I. Perceived anxiety and plasma cortisol concentrations following rock climbing with differing safety rope protocols. Br J Sports Med. 2009;4:531–535. doi: 10.1136/bjsm.2007.046011. [DOI] [PubMed] [Google Scholar]
- Lindinger MI, Kowalchuk JM, Heigenhauser GJF. Applying physicochemical principles to skeletal muscle acidbase status. Am J Physiol Regul Integr Comp Physiol. 2005;289(3):891–894. doi: 10.1152/ajpregu.00225.2005. [DOI] [PubMed] [Google Scholar]
- Magiera A, Roczniok R, Maszczyk A, Czuba M, Kantyka J, Kurek P. The structure of performance of a sport rock climber. J Hum Kinet. 2013;36:107–117. doi: 10.2478/hukin-2013-0011. [DOI] [PMC free article] [PubMed] [Google Scholar]
- Michailov ML. Workload characteristic, performance limiting factors and methods for strength and endurance training in rock climbing. Med Sport. 2014;18(3):97–106. [Google Scholar]
- Papacosta E, Nassis GP. Saliva as a tool for monitoring steroid, peptide and immune markers in sport and exercise science. J Sci Med Sport. 2011;14(5):424–434. doi: 10.1016/j.jsams.2011.03.004. [DOI] [PubMed] [Google Scholar]
- Selye H. Stress without distress. New York: New American Library; 1974. [Google Scholar]
- Sheel AW, Seddon N, Knight A, McKenzie DC, Warburton DE. Physiological responses to indoor rock-climbing and their relationship to maximal cycle ergometry. Med Sci Sports Exerc. 2003;35(7):1225–1231. doi: 10.1249/01.MSS.0000074443.17247.05. [DOI] [PubMed] [Google Scholar]
- Sherk VD, Sherk KA, Kim SJ, Young KC, Bemben DA. Hormone responses to a continuous bout of rock climbing in men. Eur J Appl Physiol. 2010;111:1–7. doi: 10.1007/s00421-010-1685-2. [DOI] [PubMed] [Google Scholar]
- Sperlich B, Achtzehn S, Buhr M, Zinner Ch, Zelle S, Holmberg HCh. Salivary Cortisol, Heart Rate, and Blood Lactate Responses During Elite Downhill Mountain Bike Racing. Int J Sports Physiol Perform. 2012;7:47–52. doi: 10.1123/ijspp.7.1.47. [DOI] [PubMed] [Google Scholar]
- Suay F, Salvador A. Cortisol. Ehrlenspiel F, Strahler K. Psychoneuroendocrinology of sport and exercise. Foundations, markers, trends. Routledge, Abingdon: 2012. [Google Scholar]
- Valenzuela PL, de la Villa P, Ferragut C. Effect of Two Types of Active Recovery on Fatigue and Climbing Performance. J Sports Sci Med. 2015;14(4):769–775. [PMC free article] [PubMed] [Google Scholar]
- Watts PB, Drobish KM. Physiological responses to simulated rock climbing at different angles. Med Sci Sports Exerc. 1998;30:1118–1122. doi: 10.1097/00005768-199807000-00015. [DOI] [PubMed] [Google Scholar]
- Weippert M, Kumar M, Kreuzfeld S, Arndt D, Rieger A, Stoll R. Comparison of three mobile devices for measuring R–R intervals and heart rate variability: Polar S810i, Suunto t6 and an ambulatory ECG system. Eur J Appl Physiol. 2010;109:779–786. doi: 10.1007/s00421-010-1415-9. [DOI] [PubMed] [Google Scholar]
- Williams ES, Taggart P, Carruthers M. Rock climbing: observations on heart rate and plasma catecholamine concentrations and the influence of oxprenolol. Br J Sports Med. 1978;12:125. doi: 10.1136/bjsm.12.3.125. [DOI] [PMC free article] [PubMed] [Google Scholar]