Abstract
Dysregulation of DNA methylation has been identified as an epigenetic biomarker for numerous cancer types. Gene-specific identification techniques relying on methylation-specific PCR (MSP) require a lengthy manual benchtop process that is susceptible to human-error and contamination. This MSP assay requires a series of discrete sample processing steps including genomic DNA extraction, bisulfite conversion and readout via PCR. In this work, we present a streamlined assay platform utilizing droplet magnetofluidic principles for integration of all sample processing steps required to obtain quantitative MSP signal from raw biological samples. We present a streamlined protocol for solid-phase extraction and bisulfite conversion of genomic DNA, which minimizes reagent use and simplifies the sample preparation protocol for implementation on a compact assay platform. Furthermore, we present a thermally robust assay chip that enables DNA extraction, bisulfite conversion and quantitative PCR from biological samples on a single device. Technical improvements to facilitate DNA extraction and PCR on a single chip in addition to chip performance characterization data are presented.
Keywords: Methylation, Epigenetics, Methylation-specific PCR, Lab-on-chip, Magnetofluidics, qPCR, Biomarkers
1. Introduction
DNA methylation is a fundamental epigenetic mechanism for regulation of gene expression (Bird 1985). Loss of expression caused by CpG hypermethylation in the promoter region for specific genes is prevalent among many forms of cancer (Das and Singal 2004; Donninger et al. 2007; Ehrlich 2002; Merlo et al. 1995). In addition to this expression-linked methylation events, as the disease progresses, hypomethylation of non-coding regions and non-pathway related genes can occur (Kalari and Pfeifer 2010). This close correlation between the methylation status and the progression of the disease has led to significant interest in methylation as a biomarker for cancer prediction, diagnosis and prognosis (Baylin and Herman 2000; Herman et al. 1994; Herman and Baylin 2003).
Genomic analysis of CpG methylation requires a pretreatment of sample DNA via chemical modification process known as bisulfite conversion (Derks et al. 2004; Fraga and Esteller 2002; Frommer et al. 1992). In addition to forming the basis for most genomic assays targeting CpG methylation, bisulfite conversion serves as an essential step in Methylation Specific PCR (MSP), which is currently the most sensitive method for the detection of methylation within a specific sequence (Derks et al. 2004; Herman et al. 1996). This assay can amplify low-copy numbers through PCR and identify their presence based on this amplification process (Herman et al. 1996). In order to enable MSP to be performed on genomic DNA, the DNA has to be modified by a bisulfite conversion method (Frommer et al. 1992). In this process, unmethylated cytosine is converted to uracil, while methylated cytosine (methyl-cytosine) is preserved intact. After the conversion, the uracil is complementary to adenine while methyl-cytosine is complementary to guanine. This allows for distinct PCR primers to be designed for each methylation status and consequently identify them based on either amplification or lack thereof.
The typical workflow for MSP sample preparation requires discrete steps for DNA isolation, bisulfite conversion and real-time PCR (also known as quantitative PCR, or qPCR). Additionally, every stage requires the use of specialized lab equipment and transfer across these machines. Previous efforts to streamline the MSP process have focused on developing microfluidic modules to perform some of the steps required in MSP, such as DNA isolation (Zhang et al. 2010), bisulfite conversion (Stark et al. 2016) and PCR (Ramalingam et al. 2009). However, these designs have not addressed a full sample-to-answer solution due to the complexity involved in merging all necessary steps into a single platform.
To this end, we pursued a twofold approach to integrate discrete steps in MSP into a single process. From the perspective of a microfluidic device, each buffer exchange step represents an additional step in the chip, requiring additional reagents and actuation time for implementation. As such, developing a streamlined assay protocol with a desired performance characteristic is the preferred approach prior to implementing assays on a device. We have previously developed Methylation-on-Beads (MOB), which is a protocol based on magnetic particle-based DNA extraction in order to integrate DNA isolation, bisulfite conversion and MSP into a single, streamlined process (Bailey et al. 2010; Keeley et al. 2013).
Secondly, we developed a novel microfluidic approach based on magnetic particle actuation to facilitate integration of multi-step assays, called droplet magnetofluidics (Park et al. 2011; Shin et al. 2017; Zhang and Wang 2013). We previously implemented the bisulfite conversion protocol on a miniaturized device based on the principle of droplet magnetofluidics, in which fluidic actuation is entirely replaced by a series of magnetic particle extraction steps (Stark et al. 2016). While the device was capable of processing samples for bisulfite conversion, additional provisions were required to achieve a greater level of integration with other steps involved in an MSP assay, including DNA extraction, thermal cycling and real-time detection on the same device.
In this work, we demonstrate the use of a droplet magnetofluidic chip to perform a combined and simplified protocol for DNA isolation and bisulfite conversion and identify the methylation status by MSP. The integration of DNA isolation, bisulfite conversion and MSP is facilitated by a combination of innovations on the assay protocol and device fabrication. By leveraging the existing high-salt conditions in the bisulfite conversion buffer, we developed a single-step chemical lysis process in place of two discrete steps, thereby reducing the overall assay time and device dimensions. Additionally, we present improvements to the fabrication process of the device that mitigate heat-induced distortion and further improve upon the device’s reliability and reproducibility. The resulting device represents the first example of an integrated microfluidic device demonstrating quantitative MSP assay from a crude biosample.
2. Materials and methods
2.1. MSP assay chip and detection system design
The assay chip is fabricated by plasma bonding (45 s at 40 W) the PDMS onto a glass slide. For the initial dimensional and temperature stability experiments, we tested three glass slides with different thickness: 0.1 mm (Ted Pella 260,462 No. 1, 75 × 50 mm), a 0.2 mm (Ted Pella 260,450 No. 2, 76 × 83 mm), and 1 mm (Ted Pella 26,005 75 × 50 mm). For all subsequent experiments, we used the 0.2 mm thick glass. Following the plasma bonding, the chip is baked for 30 min and then exposed a second time to plasma oxidation (10 min at 85 W). This is done to enrich the surface with silanol, which forms from the oxidized silicon ions from the PDMS, creating a lower porosity and rough contact area for the Teflon coating. The Teflon coating is applied by dissolving Teflon AF 1600 at 1% w/w ratio in HFE-7100 fluid, applying a thin coat to the chip surface by pipetting and then evaporating the solvent at 80 °C for 30 min.
We designed a det ection setup consisting of a standalone fluorometer (Qiagen ESELog) mounted on a support unit on top of the chip. This instrument contains an LED emitting at 470 nm and a photodiode detector with a 520 nm bandpass filter. This combination is optimized for FAM fluorophores which are used in all qPCR experiments in this work. The fluorometer sits in direct contact with a 0.1 mm thick glass slide (VWR 48366–045, No.1 18 mm × 18 mm) on the top of the PDMS chip. The confocal fluorescence detector is aligned above each PCR droplet to a position where the maximal fluorescence level is obtained.
2.2. DNA isolation and bisulfite conversion
To begin the process, we preload a droplet of each buffer into the microfluidic methylation analysis chip. For the first position (Fig. 1a, first droplet from left) we place a droplet containing a mix 1 μl of cells with 23 μl of Lightning Conversion reagent (Zymo) and 1 μl of Proteinase K (NEB P8107S). This reagent is referred to as the Bisulfite Lysis reagent. The cells used were PC3 for methylation positive cells and DKO (DNMT knockout cells) for methylation negative cells. The second position contains 105 μl of M-Binding buffer. The third, fifth and sixth positions contain 20 μl of M-Wash Buffer. The seventh (last) position contains either 20 μl of M-elution buffer for transfer of bisulfite converted DNA (bstDNA) for external PCR or 25 μl of PCR mix, as detailed in the next section. Once the sample and reagents are loaded, the chip is placed on the thermal unit and first incubated at 55 °C for 1 h followed by 98 °C incubation for 8 min, incubation at 70 °C for 1 h and finally cooling to 4 °C for 10 min.
Fig. 1.
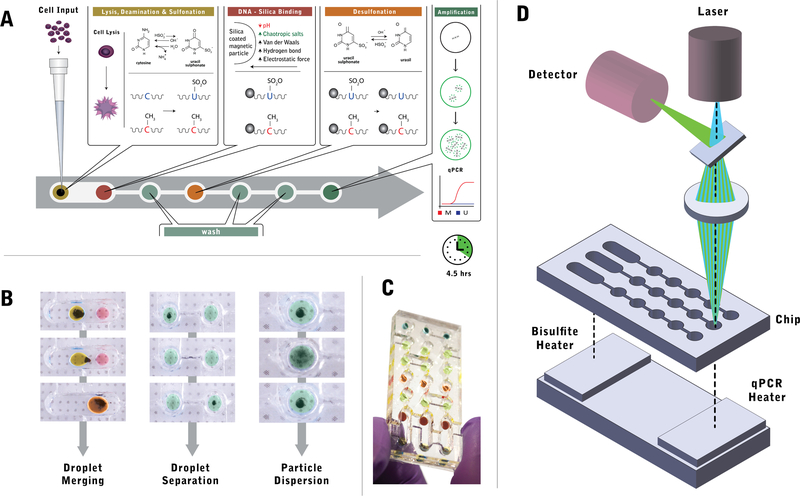
Overview of the droplet magnetofluidic platform for fully integrated methylation analysis. a Quantitative MSP assay protocol on chip. A liquid suspension of human cells is directly loaded into the first chamber, where it is merged with a droplet containing magnetic particles and bisulfite conversion reagent for cell lysis and bisulfite conversion. The droplet is subsequently merged with a second reagent droplet to facilitate DNA binding on magnetic particles. Subsequent steps involve desulphonation and DNA elution, which are each preceded by a series of wash reagents to ensure minimal carryover of upstream buffers and other contaminants. Upon elution into the PCR reagent in the last well, methylation marker quantification is performed directly on chip via quantitative PCR. The entire process is completed in 4.5 h. b Droplet operations on chip. Magnetofluidic control enables three operations: droplet merging, droplet separation and particle dispersion. Droplet merging facilitates additive operations by taking advantage of the operating regime where capillary force on an actuated magnetic particle is less than the magnetic force on the particles. Droplet separation utilizes a sieve structure on the chip to maximize capillary force, thereby facilitating dissociation of the magnetic particle from the reagent droplet. Particle dispersion is achieved when magnetic field is removed from the chip, resulting in the release of particle plug into a dispersed plume. c Photograph of the assembled chip containing aqueous droplets mixed with food dye for visualization. d The MSP chip operates in tandem with a thermal control unit, consisting of two heating blocks for bisulfite conversion and thermal cycling. The chip interfaces on its top surface with a fluorometer, which acquires real-time signal from the droplets during PCR
The sample is mixed with 105 μl M-binding buffer (Zymo) by merging the droplets (Fig. 1b). The DNA-containing beads are then transferred to the next well containing 40 μl M-Wa sh buffer. The DNA is transferred to the next well containing 20 μl L-desulphonation buffer, and the beads are incubated there for 15 min at room temperature. The beads are subsequently transferred to the next well containing 40 μl M-Wash buffer and after a few seconds, transferred to the next well also containing 40 μl M-wash buffer. After a 30 s incubation, the beads are transferred to the final well containing the elution buffer or the PCR mix and heated to 95 °C for 5 min. The beads are then transferred back to the previous well, before the contents of the final well are either transferred for off-chip analysis or analyzed directly via on-chip qPCR.
2.3. Methylation-specific PCR
We designed an MSP assay to detect methylation status and implemented it on chip by mixing the reagents and adding them to the final well. The final buffer consists of a PCR mix containing 16.7 mM ammonium sulfate, 67 mM TRIS (pH 8.8), 6.7 magnesium chloride, 10 mM mercaptoethanol, 200 nM forward primers, 200 nM reverse primers, 200 μM dNTPs, 100 nM hybridization probe (FAM labeled) and 1 unit of Platinum Taq polymerase (Invitrogen 10,966). For assay protocol characterization, the extracted sample is analyzed via qPCR on a commercial thermal cycling instrument (BioRad CFX96) with automated cycle threshold (CT) determination for quantitative information. For on-chip qPCR, the chip is mounted on a heating unit under a confocal fluorescence detector (Qiagen ESELog) during the thermal cycling program (Fig. 1d). The PCR cycling program consists of 1 min at 95 °C followed by 40 cycles of 30 s at 95 °C (denaturing step), 30 s at 60 °C (annealing step) and 30 s at 72 °C (extension step). The detector is calibrated to excite the FAM fluorophore and receive the fluorescence signal. The thermal cycling is protected from ambient light to minimize background noise.
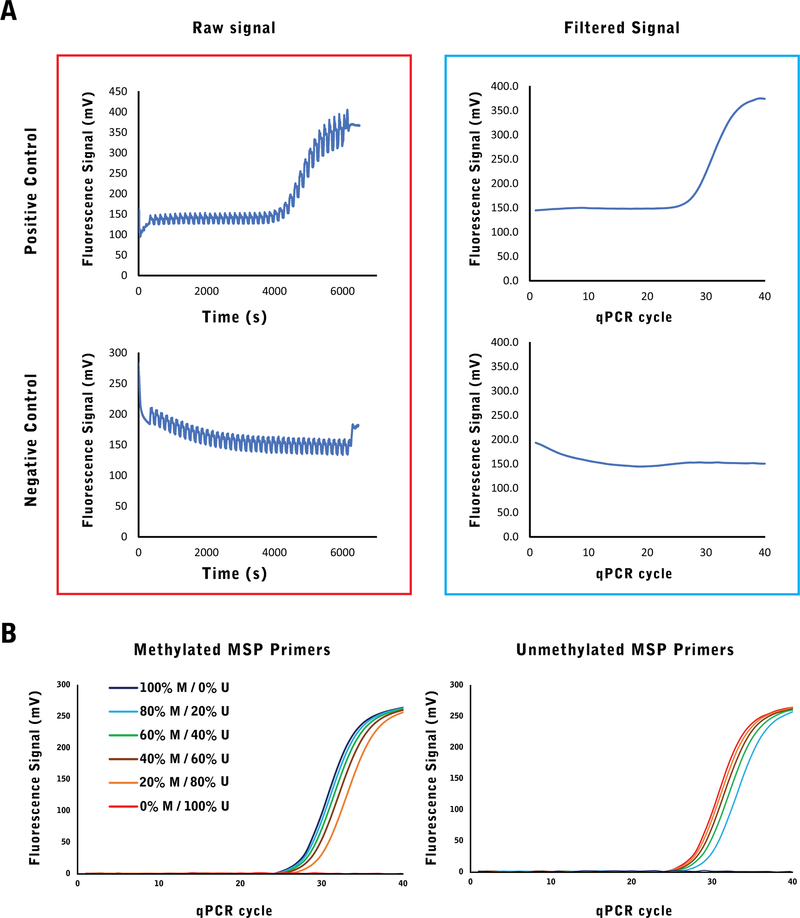
The signal from the detector (Fig. 5a) is filtered after acquisition by identifying the local peaks in fluorescence within 150 s windows (length of a full cycle). The fluorescence reaches its maximum at the annealing stage (60 °C), decreases at the extension step (72 °C) and reaches its minimum at the denaturing step (95 °C). We isolated 10 data points around the midpoint (±5 s) of the annealing step per cycle and used the average value to represent the fluorescence for the cycle. We determined the baseline by finding the minimum fluorescence in the run and subtracting it from all fluorescence values. Once the data was represented as fluorescence as a function of cycle number, the threshold was set at +25% baseline fluorescence, resulting in a CT determination threshold of 200 mV for the detector.
Fig. 5.
a The raw signal from the detector, captured at 1 s intervals reflects both the exponential fluorescence increase resulting from qPCR and the periodic fluctuations due to temperature change in each cycle (left). The periodic fluctuations can then be normalized to create a qPCR signal as a function of qPCR cycles (right). b The methylated PC3 cells were combined with unmethylated DKO cells at different ratios and measured using RASSF1A methylated and unmethylated PCR reactions. The reduction in quantity of its target results in the exponential fluorescence signal being delayed to later PCR cycles. In a homogeneous population of targets (either fully methylated or fully unmethylated), PCR amplification will not occur for the absent population and no exponential signal will be observed
In order to verify the specificity of the product after PCR cycling, the sample is transferred into a gel (2% agarose, 1X GelStar staining in TE Buffer) for electrophoresis. The gel is run for 45 min at 160 V. After this, the gel is imaged under UV light to confirm the intended product size of 103 bp.
3. Results
3.1. Vertical integration of MSP assay on a magnetofluidic assay chip
The microfluidic chip and base integrate every step of the process for methylation detection from cells. The chip itself contains all the necessary reagents within a lane of wells connected by channels (Fig. 1a). The DNA is bound onto magnetic particles (Fig. 1b) which can be used to move entire droplets and merge them (droplet merging), transport DNA across different droplets (droplet separation) and can resuspend in the droplet quickly upon removal of the magnet (particle dispersion). The chip contains three identical and parallel lanes which can perform the assay on distinct samples simultaneously (Fig. 1c). On the instrument side, below the chip sits a thermal control unit consisting of two heating blocks (Fig. 1d) to facilitate heating of the reagents for lysis and bisulfite conversion at the initial step and PCR thermal cycling at the final step. On top of the chip, a fluorometer containing a laser source and a wavelength-specific detector is aligned with the final well for qPCR detection. With the ability to incorporate thermal control and optical detection into a magnetofluidic assay chip, the platform is capable of recreating all steps involved in a quantitative MSP assay including DNA purification, thermal incubation and cycling, and fluorescent detection.
3.2. Streamlined methylation-on-beads (MOB) protocol
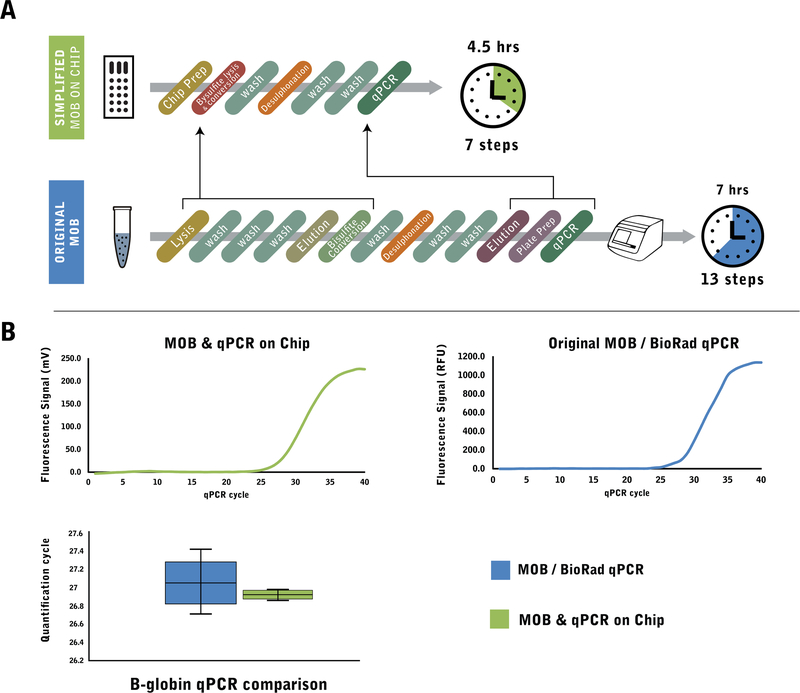
In order to develop a self-contained microfluidic assay chip while minimizing the footprint of the chip containing the reagents, we developed a streamlined protocol of the MOB assay. This streamlined protocol combined the lysis, washing and bisulfite conversion steps onto a single reagent (Fig. 2a), reducing the total number of buffer exchange steps, and therefore reagent wells, from 13 to 7. As a less critical, but beneficial improvement, the total processing time was reduced from 7 to 4.5 h. Importantly, the real-time PCR performance was comparable to the original benchtop MOB process (Fig. 2b) and the variability across identical samples was reduced.
Fig. 2.
a The original Methylation-on-Beads protocol (MOB) for benchtop MSP assay is a multi-step process requiring 13 steps for sample processing and qPCR. In the streamlined MOB protocol for chip-based MSP assay, DNA extraction and bisulfite conversion was combined into a single-step process utilizing the bisulfite conversion reagent for direct cell lysis. A droplet magnetofluidic chip replaces multiple buffer exchange steps with a simple magnetic particle transfer between reagent droplets, further simplifying the assay protocol. Additionally, by coupling the chip with a qPCR detection system, the need for DNA elution and qPCR plate preparation is eliminated, condensing the entire MSP assay to 7 steps which can be perormed in 4.5 h b Comparison of qPCR results between chip-based streamlined MOB and the original benchtop MOB. Despite the reduction in processing steps and time, the chip process can produce qPCR results comparable to the benchtop process and a qPCR machine (BioRad CFX96). The sample variability is also reduced in the chip process
3.3. Device stability
Droplet magnetofluidic devices feature microliter-scale reagent reservoirs and millimeter-scale extrusions for magnetic particle transfers. Generating such features using soft lithography-based processes such as PDMS casting and glass bonding has the advantage of a rapid turnaround time and accessibility, but also faces structural challenges when the design consists of a substantial volume of PDMS. In our system, the use of mineral oil triggered substantial swelling of the PDMS layer and triggered dimensional warping. Device warping leads to loss of contact between the chip and the heating surface, reducing the reproducibility of thermal cycling parameters on chip. We focused our improvements in design on two parameters, the dimensional stability of the device and the thermal stability throughout the duration of the entire assay. For characterization purpose, we established 4 h as a conservative estimate for the device to perform the entire MOB protocol and complete 40 cycles of amplification.
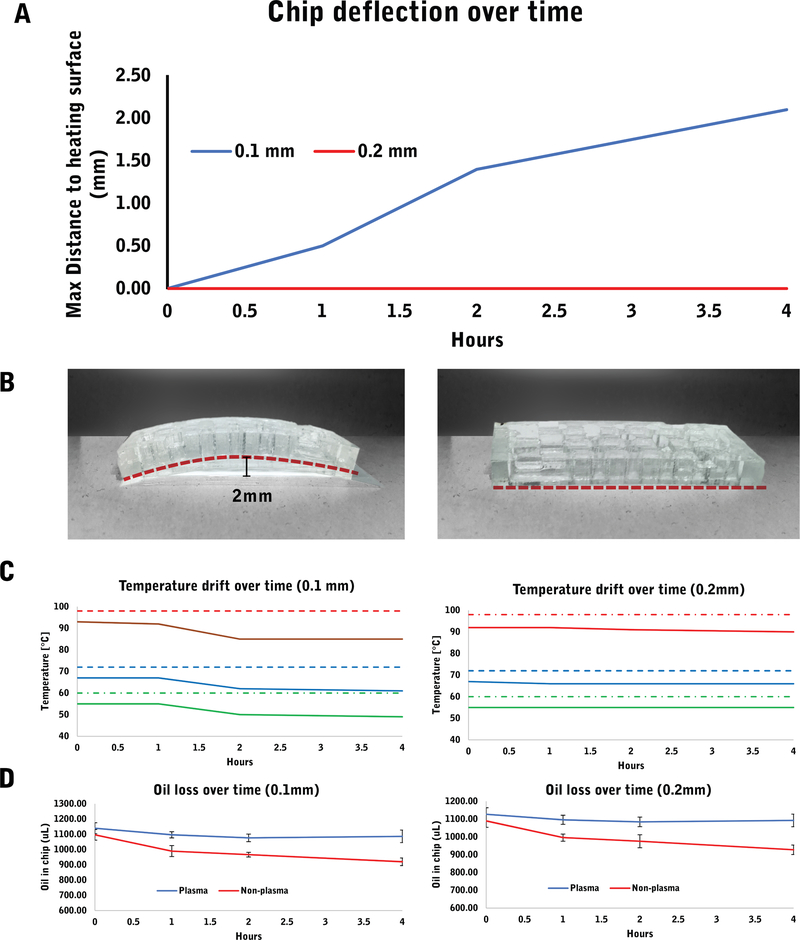
In order to improve the dimensional stability, we reinforced the weakest structural point, in this case, the glass slide. By increasing the thickness from 0.1 mm to 0.2 mm, the effects of warping were reduced to an undetectable level (Fig. 3a, b). We found most of the warping within 2 h of heating and continued into the 4th hour mark. While cracking due to excessive warping occurred in approximately 30–50% of the 0.1 mm chips, we observed none in the 0.2 mm chips. The resulting dimensionally-stable chip provided a uniform platform for all required heating steps at reproducible temperature points (Fig. 3c). The oil absorption into the PDMS layer is also reduced significantly after the plasma oxidation treatment (Fig. 3d).
Fig. 3.
a We identified an arc-like structure (b) resulting from the deflection of the chip and measured it in terms of the distance between the top of the arc and the heating surface (maximum distance between the two surfaces). The deflection resulted in a temperature drift within the deflected chip which we measured at 3 different temperature points – 98C, 72C and 60C. We selected these values based on the typical temperature used in 3-step PCR. d The plasma treatment of the PDMS surface resulted in minimized oil loss regardless of glass thickness. The reduction in oil absorption into the PDMS prevents its contribution to the warping problem
3.4. DNA extraction and conversion recovery
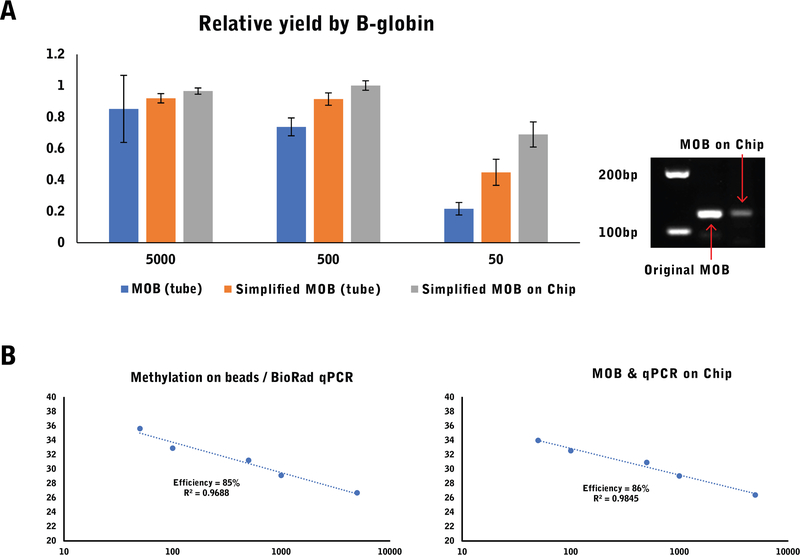
In order to reduce the number of reagents and processing steps on the device, we developed a streamlined MOB protocol utilizing the bisulfite conversion buffer as a chemical lysis reagent. Implementing such a protocol obviates all lysis and wash steps involved with DNA extraction, which substantially simplifies device implementation. We initially tested our new protocol in tube format to allow for direct comparison to the standard MOB protocol. We found both methods to be comparably effective at lysing cells and bisulfite converting as shown in Fig. 2b, despite the new protocol requiring fewer steps and shorter processing time. The reduction in steps resulted in a small advantage in recovery at low cellular concentration, as reflected by the 2-cycle improvement in the new protocol over the standard MOB protocol.
We subsequently implemented the streamlined MOB protocol in order to process PC3 cells on the chip. The bstDNA was eluted from the chip and was retrieved for a side-to-side comparison with the standard MOB process using a quantitative MSP assay on the BioRad CFX96 instrument (Fig. 4). We found comparable performance between both processes, with a slight advantage in threshold cycle (CT) value when using the chip.
Fig. 4.
a The process was compared between the original benchtop MOB process, the new reduced protocol in a benchtop process and the reduced protocol directly implemented on chip. The reduction in steps and sample transfers results in a higher yield in small sample sizes. b The quality of the PCR product was verified by gel-electrophoresis and compared between the benchtop and the chip process. c The dynamic range and efficiency was compared between the discrete benchtop process of MOB followed by amplification in a BioRad CFX96 machine and a direct sample preparation and detection on chip
3.5. Methylation assessment
The objective of bisulfite conversion is to enable the determination of methylation status of cytosine. This is achieved by a set of two PCR reactions. The selective MSP amplification (Fig. 5) highlights the ability of this system to distinguish between the methylated cells and the unmethylated cells based on amplification via PCR as reflected by the increase in fluorescence. Successful amplification results in an increased endpoint fluorescence, and the cycle at which it increases above the baseline (threshold for this example is set at 200 mV) is used to measure the initial quantity of target DNA. By extrapolating the cycle data based on the small fluorescence fluctuations during each cycle, the fluorescence data was plotted as a function of PCR cycles and enabled calculation of CT values in a method analogous to commercial qPCR instruments. In order to ensure that our signal was due to specific amplification, the PCR product was further verified by gel electrophoresis (Fig. 4b), where the expected amplicon size is only present for the methylated cells, and not for the unmethylated cells.
4. Discussion
In this work, we demonstrated a fully integrated device for DNA extraction and quantitative methylation assessment from biological samples within a single chip. We took a two-pronged approach of streamlining the assay protocol and refining the device manufacturing process to enable implementation of a complex multi-step assay on a single device. The motivation for developing such integrated platform for methylation assessment is reflected in the time-efficiency and process containment enabled by process integration and parallelization. Once the chip is primed with reagents, only magnetic actuation is required for assay progression. This approach not only streamlines and simplifies the whole process, but also reduces assay variability caused by pipetting error and cross-contamination between samples.
As part of our assay protocol optimization, we developed and demonstrated a streamlined MOB protocol with comparable performance and a substantial gain in the simplicity of the assay protocol. The streamlined protocol can also be implemented for benchtop use, but its use on a microfluidic platform has the synergistic effect of both shortening the assay duration while also simplifying the chip implementation. The MSP chip highlights the strength of droplet magnetofluidic approach to assay integration from the operator’s perspective, since multiple laborious buffer-exchange steps are replaced by a simple magnetic actuation. The use of a streamlined MOB protocol further enhances this strength with a substantial reduction to the number of magnetic actuation steps.
During the development of this chip, we also identified potential improvement to conventional PDMS-based fabrication processes to minimize oil permeation. The use of plasma oxidation on the PDMS surface greatly reduced the absorption of mineral oil into the PDMS layer. This process can be beneficial to other PDMS chips which rely on mineral oil as a carrier phase for aqueous reagents stored as sessile droplets, particularly when extended exposure times and heating are involved. In addition, we characterized the use of different thicknesses of bonding substrate as a way to overcome the distortion commonly found in PDMS devices that use mineral oil. In this particular device with a large PDMS layer exposed to the oil, the effect was highly pronounced and clearly differentiated as a function of substrate thickness. Our documented findings clearly outline some of the unique challenges of PDMS prototyping and could be studied for the benefit of others who may consider designing devices of similar material composition.
Droplet magnetofluidic implementation of the MSP assay also enables parallel processing of samples and targets. In methylation research, typically multiple genes and multiple samples are to be analyzed and compared against each other. This chip allows for either aliquots of the same sample to be processed and tested for different targets, different samples to be tested for the same targets, or altogether different samples to be tested for different targets on a single chip. Due to the modular, lane-based design of the assay chip, the chip may be scaled up to include additional lanes as appropriate for any methylation marker panel of interest. Beyond research applications, this format can be expanded upon and used as part of an on-site diagnostics platform for identified methylation targets.
Acknowledgements
The authors would also like to thank funding sources from National Institutes of Health (R21CA186809, UG3CA211457, U01CA200499).
References
- Bailey VJ, Zhang Y, Keeley BP, Yin C, Pelosky KL, Brock MV, Baylin SB, Herman JG, Wang T-H, Clin. Chem 56, 1022 (2010) [DOI] [PMC free article] [PubMed] [Google Scholar]
- Baylin SB, Herman JG, Trends Genet 16, 168 (2000) [DOI] [PubMed] [Google Scholar]
- Bird AP, Nature 321, 209 (1985) [DOI] [PubMed] [Google Scholar]
- Das PM, Singal R, J. Clin. Oncol 22, 4632 (2004) [DOI] [PubMed] [Google Scholar]
- Derks S, Lentjes MHFM, Hellebrekers DMEI, de Bruïne AP, Herman JG, van Engeland M, Cell. Oncol 26, 291 (2004) [DOI] [PMC free article] [PubMed] [Google Scholar]
- Donninger H, Vos MD, Clark GJ, J. Cell Sci 120, 3163 (2007) [DOI] [PubMed] [Google Scholar]
- Ehrlich M, Oncogene 21, 5400 (2002) [DOI] [PubMed] [Google Scholar]
- Fraga MF, Esteller M, BioTechniques 33, 632 (2002) [DOI] [PubMed] [Google Scholar]
- Frommer M, McDonald LE, Millar DS, Collis CM, Watt F, Grigg GW, Molloy PL, Paul CL, Proc. Natl. Acad. Sci. U. S. A 89, 1827 (1992) [DOI] [PMC free article] [PubMed] [Google Scholar]
- Herman JG, Baylin SB, N. Engl. J. Med 349, 2042 (2003) [DOI] [PubMed] [Google Scholar]
- Herman JG, Latif F, Weng Y, Lerman MI, Zbar B, Liu S, Samid D, Duan DS, Gnarra JR, Linehan WM, Proc. Natl. Acad. Sci. U. S. A 91, 9700 (1994) [DOI] [PMC free article] [PubMed] [Google Scholar]
- Herman JG, Graff JR, Myohanen S, Nelkin BD, Baylin SB, Myöhänen S, Nelkin BD, Baylin SB, Proc. Natl. Acad. Sci. U. S. A 93, 9821 (1996) [DOI] [PMC free article] [PubMed] [Google Scholar]
- Kalari S and Pfeifer GP, Identification of Driver and Passenger DNA Methylation in Cancer by Epigenomic Analysis (2010) [DOI] [PMC free article] [PubMed]
- Keeley BP, Stark A, Pisanic TR, Kwak R, Zhang Y, Wrangle J, Baylin SB, Herman JG, Ahuja N, Brock MV, Wang T-HH, Pisanic TR II, Kwak R, Zhang Y, Wrangle J, Baylin SB, Herman JG, Ahuja N, Brock MV, Wang T-HH, Clin. Chim. Acta 425, 169 (2013) [DOI] [PMC free article] [PubMed] [Google Scholar]
- Merlo A, Herman JG, Mao L, Lee DJ, Gabrielson E, Burger PC, Baylin SB, Sidransky D, Nat. Med 1, 686 (1995) [DOI] [PubMed] [Google Scholar]
- Park S, Zhang Y, Wang T-H, Yang S, Lab Chip 11, 2893 (2011) [DOI] [PubMed] [Google Scholar]
- Ramalingam N, Liu H-B, Dai C-C, Jiang Y, Wang H, Wang Q, Hui KM, Gong H-Q, Biomed. Microdevices 11, 1007 (2009) [DOI] [PubMed] [Google Scholar]
- Shin DJ, Athamanolap P, Chen L, Hardick J, Lewis M, Hsieh YH, Rothman RE, Gaydos CA, Wang TH, Sci. Rep 7, 4495 (2017) [DOI] [PMC free article] [PubMed] [Google Scholar]
- Stark A, Shin DJ, Pisanic TR II, Hsieh K, Wang T-H, Biomed. Microdevices 18, 1 (2016) [DOI] [PMC free article] [PubMed] [Google Scholar]
- Zhang Y, Wang T-H, Adv. Mater 25, 2903 (2013) [DOI] [PMC free article] [PubMed] [Google Scholar]
- Zhang Y, Park S, Yang S, Wang T-HH, Biomed. Microdevices 12, 1043 (2010) [DOI] [PubMed] [Google Scholar]


