Abstract
Brain atlases are commonly utilized in neuroimaging studies. However, most brain atlases are fuzzy and lack structural details, especially in the cortical regions. This is mainly caused by the image averaging process involved in atlas construction, which often smoothes out high‐frequency contents that capture fine anatomical details. Brain atlas construction for neonatal images is even more challenging due to insufficient spatial resolution and low tissue contrast. In this paper, we propose a novel framework for detail‐preserving construction of population‐representative atlases. Our approach combines spatial and frequency information to better preserve image details. This is achieved by performing atlas construction in the space‐frequency domain given by wavelet transform. In particular, sparse patch‐based atlas construction is performed in all frequency subbands, and the results are combined to give a final atlas. For enhancing anatomical details, tissue probability maps are also used to guide atlas construction. Experimental results show that our approach can produce atlases with greater structural details than existing atlases. Hum Brain Mapp 37:2133–2150, 2016. © 2016 Wiley Periodicals, Inc.
Keywords: brain atlas, neonate, sparse representation, frequency decomposition, image registration, MRI template, neonatal brain, wavelet transform, pediatrics
Abbreviations
- GM
Gray matter
- TSE
Turbo spin‐echo
- WM
White matter
INTRODUCTION
Brain atlases are spatial representations of anatomical structures and allow brain analysis to be performed in a standardized space. They are widely used for neuroscience studies, disease diagnosis, and pedagogical purposes.
Two types of atlases are widely used [Cabezas et al., 2011; Evans et al., 2012]: single‐subject atlases [Aljabar et al., 2009; Talairach and Tournoux 1988; Tzourio‐Mazoyer et al., 2002; Wang et al., 2013], and population‐average atlases [Evans et al., 2012; Fonov et al., 2011; Kuklisova‐Murgasova et al., 2011; Mazziotta et al., 2001; Serag et al., 2011; Shi et al., 2011a, 2011b]. Single‐subject atlases are sharp with good structural definition and are effective for guiding non‐linear image structural alignment [Wu et al., 2011]. These atlases, however, often lead to bias, and are insufficient in representing the anatomical variability of the entire population. In comparison, population‐average atlases are designed to capture the anatomical variability of multiple subjects. The construction of a population‐averaged atlas commonly involves registering a population of images to a common space and then fusing these registered images into a final atlas. Due to considerable inter‐subject anatomical variability, fine brain structures are often smoothed out during atlas construction. While this problem can be partially mitigated by improving spatial registration, minor structural differences still remain, leading to blurred atlases after averaging. Since blurred atlases hardly represent any real brain structures, many studies have attempted to remedy this problem [Fonov et al., 2011; Luo et al., 2014; Oishi et al., 2011; Schuh et al., 2015; Serag et al., 2012; Shi et al., 2011a, 2011b; Wu et al., 2011].
The majority of previous studies have been focused on improving image registration. It is commonly recognized that reducing structural misalignment among individuals is essential in preserving fine structures. For example, Yeo et al. [2008] proposed to jointly register the intensity image and the segmentation label maps for improving accuracy in both registration and segmentation. Zhang et al. [2014] proposed an atlas generation method by gradually moving the initial template (i.e., a randomly selected subject image) to the common space by updating the template iteratively. Kuklisova‐Murgasova et al. [2011] constructed atlases for preterm babies by affine registration, which was further extended in Schuh et al., [2015] by using group‐wise parametric diffeomorphic registration. Oishi et al. [2011] proposed to combine affine and non‐linear registrations for hierarchically building an infant brain atlas. Fonov et al. [2011] proposed a non‐linear unbiased registration framework based on the ICBM atlas data [Mazziotta et a., 2001], and further proposed to hierarchically refine the average atlas using a multi‐scale non‐linear registration strategy. By using adaptive kernel regression and group‐wise registration, Serag et al. [2012] constructed a spatiotemporal atlas of the developing brain. Luo et al. [2014] used both intensity and sulci landmark information in the group‐wise registration for constructing a toddler atlas. All these methods, however, fuse the images by simple averaging, thus often resulting in blurred atlases.
For more effective image fusion, Artaechvarria et al. [2009] proposed a local weighted voting method for improving brain tissue segmentation accuracy. Instead of using global weights to fuse candidate segmentations, the local fusion weights are determined voxel‐wise according to local estimation of segmentation performance. In Wang et al.'s work [2013], the weighted voting is optimized by minimizing the total expectation of labeling error. The pairwise dependency between atlases is explicitly modeled as the joint probability of two atlases making a segmentation error at a voxel. More recently, Wu et al. [2014] developed a multi‐scale label fusion method to propagate label information from multiple atlases to the target image in a patch‐by‐patch manner with sparsity constraint. Shi et al. [2014] utilized a sparse representation technique for patch‐based fusion of similar brain structures that occur in the local neighborhood of each voxel. The limitation of this approach is that there is no explicit attempt to preserve high‐frequency contents for improving anatomical details.
For constructing detail‐preserving population‐average atlases, it is essential to consider both global brain structures and fine local anatomical details during image fusion [Zhang et al., 2015]. Wavelet transform provides a pyramidal decomposition of images, encoding coarse and fine image contents in different frequency subbands. For example, Wei et al. [2015] proposed to use Daubichies wavelet basis to bring out detailed information from motion‐corrupted diffusion‐weighted images of the human heart. By optimally fusing low‐resolution and high‐resolution image components in the frequency domain, Singh et al. [2014] proposed to apply wavelet transform for detail‐enhanced image super‐resolution.
In this paper, we propose a novel space‐frequency image fusion approach for constructing neonatal brain atlases with rich details. To achieve this goal, we employ information in both frequency and spatial domains given by the wavelet transform for atlas construction. Each brain image is decomposed into multiple scales and orientations using wavelet transform so that the fine anatomical structures can be preserved more effectively in the frequency subbands. The atlas is constructed in the spatial domain using a patch‐based mechanism. For each image patch, we fuse local neighborhood information by group‐sparse construction. In addition, we supervise the construction process by anatomical priors in the form of tissue probability maps. Then we apply our method to construct a brain atlas from neonatal MR images, which often suffer from low spatial resolution and tissue contrast. Experimental results show that the proposed method can generate atlases with greater anatomical details, compared with the existing state‐of‐the‐art neonatal atlases.
METHOD
Overview
The overall pipeline of the proposed method is shown in Figure 1. First, intensity images of all subjects are aligned to a common space using group‐wise registration to generate a mean intensity image. The resulting deformations are used to generate the corresponding tissue probability maps (Fig. 1a,b). Then, wavelet transform is used to decompose both the aligned individual images and the mean image (Fig. 1c). In each frequency subband, we construct a subband atlas using patch‐by‐patch sparse construction, guided by the tissue probability maps (Fig. 1d–e). For spatial consistency, immediate neighbors are group‐constrained during sparse estimation (Fig. 1f,g). Finally, the subband atlases are combined to form a final atlas (Fig. 1h).
Figure 1.
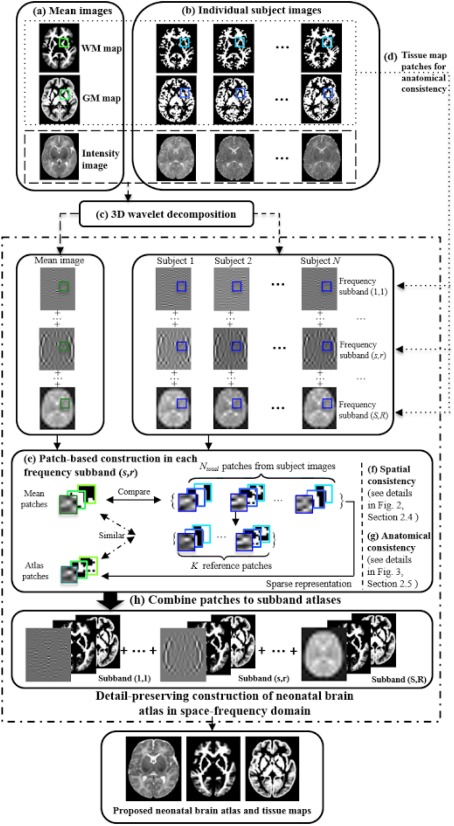
Flow chart of the proposed atlas construction framework. (a) Mean images in common space are generated from (b) the individual images using group‐wise registration. (c) Wavelet decomposition of images into frequency subbands. (d) Atlas construction in each frequency subband guided by GM and WM tissue maps. (e) Patch‐based sparse construction in each frequency subband. (f) Neighboring patches are group‐constrained for spatial consistency (see details in Fig. 2, “Consistency in Spatial Domain” Section). (g) Anatomically‐constrained patch based construction (see details in Fig. 3, “Anatomical Consistency” Section). (h) Generation of subband atlases. The subband atlases are combined to build the final atlas. [Color figure can be viewed in the online issue, which is available at http://wileyonlinelibrary.com.]
Image Preprocessing
All 73 images were preprocessed with a standard pipeline using the iBEAT software package (https://www.nitrc.org/projects/ibeat/). Briefly, it includes the following major steps: (1) rigid alignment of each T2 image to its T1 image and further resampling to be of 1 × 1 × 1 mm3 using FLIRT in FSL [Smith et al., 2004]; (2) skull stripping by a learning‐based method [Shi et al., 2012] and further removal of cerebellum and brain stem by registration with an atlas [Shen and Davatzikos, 2002]; (3) correction of intensity inhomogeneity by N3 [Sled et al., 1998]; (4) tissue segmentation by an infant‐dedicated method [Wang et al., 2012], based on the complementary multimodal information from T1 and T2 images, for reducing structural ambiguities in tissue segmentation due to low image contrast. We use a publicly available group‐wise registration method [Wu et al., 2012] to align all images to a common space (http://www.nitrc.org/projects/glirt), giving a set of registered images , which are averaged to form a mean image .
Frequency Domain Sparse Representation
We combine subband atlases generated from different frequency subbands for detail‐preserving atlas construction. We first perform pyramidal decomposition using 3D wavelet on all images:
| (1) |
where scale denotes that the image has been down‐sampled times. For each scale , images are further decomposed into orientation subband . For each scale , we fixed , and the corresponding orientation subbands in 3D are denoted as ‘LLL’, ‘HLL’, ‘LHL’, ‘HHL’, ‘LLH’, ‘HLH’, ‘LHH’, and ‘HHH’ filters, where ‘L’ indicates low‐pass filtering and ‘H’ indicates high‐pass filtering. denotes the wavelet basis of subband and denotes the wavelet coefficients in subband The wavelet coefficients of subband of all images are denoted as .
Atlas construction is performed in a patch‐by‐patch manner. We consider a local cubic patch centered at location in the mean image . The patch is represented as a vector of length , where is the patch size in each dimension. We sparsely refine the mean patch using a dictionary, formed by including all patches at the same location in all training images, i.e., thereby generating the constructed detail‐preserved atlas patch To compensate for possible registration error, we enrich the dictionary by including patches from neighboring locations, i.e., 26 locations immediately adjacent to . Therefore, from all aligned images, we will have a total of patches in the dictionary, i.e., . We use this dictionary to construct the refined atlas patch by estimating a sparse coefficient vector , with each element denoting the weight of the contribution of a patch in the dictionary.
To further enhance robustness, we constrain the constructed atlas patch to be similar to the appearance of a small set of ( ) neighboring patches from that are most correlated with . The construction problem can now be formulated as
| (2) |
where is a non‐negative parameter controlling the influence of the regularization term. Here, the first term measures the discrepancy between observations and the constructed atlas patch and the second term is for L 1‐regularization on the coefficients in . Considering that the dictionary and the observations share the same basis , we can combine Eq. (1) and Eq. (2) for a wavelet representation version of the problem:
| (3) |
where is a vector consisting of the wavelet coefficients of , and is a matrix containing the wavelet coefficients of the patches in dictionary . Finally, the atlas is constructed as
| (4) |
Consistency in Spatial Domain
As illustrated in Figure 2, to promote local consistency, multi‐task LASSO [Tibshirani, 1996] is used for spatial regularization in the space‐frequency domain for all neighboring atlas patches, indexed as , simultaneously.
Figure 2.
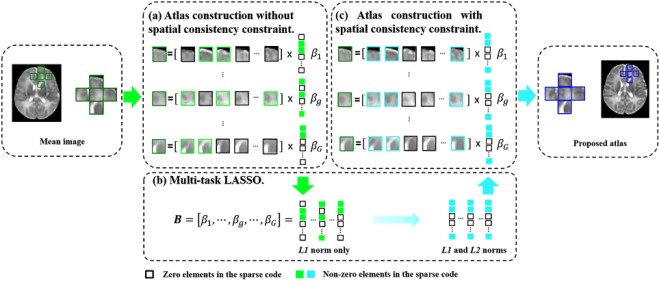
Neighboring patches are group‐constrained for spatial consistency. (a) Without constraint, neighboring patches are represented independently; (b) Multi‐task LASSO combines L 2 and L 1‐norm to impose similar representations for the neighboring patches. (c) Using spatial consistency constraint, neighboring atlas patches are generated with greater spatial consistency. [Color figure can be viewed in the online issue, which is available at http://wileyonlinelibrary.com.]
We denote the dictionary, training patch, and sparse coefficient vector for the g‐th neighbor respectively as , and . For simplicity, we let , which can also be written in the form of row vectors: , where is the m‐th row in the matrix . Then, we reformulate Eq. (2) using multi‐task LASSO:
| (5) |
where . The first term is a multi‐task sum‐of‐squares term for all neighboring atlas patches. The second term is for multi‐task regularization using a combination of L 2 and L 1‐norm. L 2‐norm penalization is imposed on each row of matrix (i.e., ) to enforce similarity of neighboring patches. L 1‐norm penalization is imposed to ensure representation sparsity. This combined penalization ensures that neighboring patches have similar sparse coefficients. The multi‐task LASSO in Eq. (5) can be solved efficiently by using the algorithm described in Liu et al. [2009].
Anatomical Consistency
To avoid anatomical inconsistency between subbands, we propose to supervise the construction in each wavelet subband by integrating intensity with anatomical features.
White matter (WM) and gray matter (GM) are the two main constituents of the brain [Damasio, 1995]. We use WM and GM probability maps to guide the atlas construction in distinct frequency subbands. As shown in Figure 3, for a local cubic patch , centered at location in the intensity image component , there are two corresponding cubic patches, represented as and respectively, at the same location of the WM and GM maps. Then, we combine the three patches into a single vector , which consists of features (i.e., voxels). By doing so, the atlas construction processes in the respective frequency subbands are restricted by the common tissue features, thus the anatomical consistency between scales and orientations is ensured for atlas construction. Conversely, the intensity image components on different frequency subbands also contribute to building clearer tissue maps, each with a unique emphasis of distinct structures. Finally, we obtain the tissue probability maps associated with the final combined intensity atlas by summation of the tissue maps built in each subband.
Figure 3.
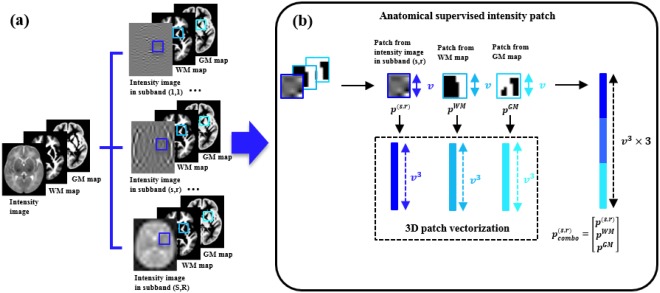
(a) Atlas construction in each frequency subband is guided by WM and GM tissue maps; (b) Local cubic patch from subband intensity image, WM map and GM map are vectorized and combined into a single vector. Thus the atlas construction processes in the respective frequency subbands are restricted by common tissue features. [Color figure can be viewed in the online issue, which is available at http://wileyonlinelibrary.com.]
EXPERIMENTAL RESULTS
Dataset
In this study, we use neonatal brain scans to demonstrate the performance of the proposed atlas construction method. Specifically, 73 healthy neonatal subjects (42 males/31 females) were used in this study. The data come from a large prospective study of early brain development in UNC [Gilmore et al., 2012]. MR images of the subjects were scanned at postnatal age of 24 ± 10 (9‐55) days using a Siemens head‐only 3T scanner. T2‐weighted images were obtained with 70 axial slices using a turbo spin‐echo (TSE) sequence for a resolution of 1.25×1.25×1.95 mm3. All 73 images were resampled to have an isotropic resolution of 1×1×1 mm3, bias corrected, skull stripped, and tissue segmented.
Implementation Details
There are several parameters in the proposed method: the number of reference patches , the multi‐task Lasso regularization parameter , the patch size , and the basis of wavelet transformation . We run our algorithm with different values of these parameters, and assessed the constructed atlases by means of signal energy variations across frequency subbands. The signal energy is computed for each of the 24 wavelet subbands (including three scales, and eight orientations for each scale) for each atlas image. The image energy of each frequency subband is defined as the L 2‐norm of wavelet coefficients in the subband. High‐frequency subbands capture fine image details, and low frequency subbands capture global image details. We can therefore assess the composition of images by observing the signal energy variations across each frequency subband. As shown in Figure 4, by varying parameters, the signal energy of atlases varies as well. We determined the parameter values by those providing the highest signal energy on each frequency subband for the final atlas construction. Therefore, we fixed and across each subband based on the energy distributions illustrated in Figure 4(a,b). In Figure 4(c), the energy distributions show variations on different scale levels; for fine image components (Scale 1 and 2), smaller patch sizes and outperformed other settings. While for coarse image components (Scale 3), we fixed . We used ‘coiflets 4’ as the wavelet basis for image decomposition, considering the charts in Figure 4(d). Besides, the number of neighboring atlas patches is set to , where 6 is the number of immediate neighbors for a cubic patch.
Figure 4.
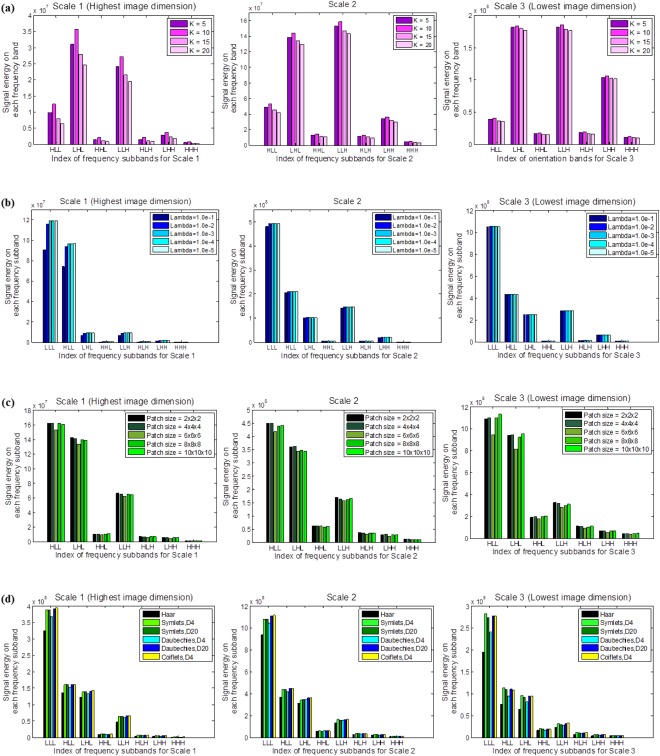
Image energy distributions across orientations and scales associated with (a) the number of reference patches , (b) multi‐task Lasso regularization parameter , (c) the construction patch size , and (d) wavelet basis . Higher signal energy values in frequency subband indicate better preservation of image components. [Color figure can be viewed in the online issue, which is available at http://wileyonlinelibrary.com.]
Significances of Frequency Domain, Space Domain, and Anatomical Constraint for Atlas Construction
We propose to use information jointly from the frequency and space domains, as well as anatomical feature maps, to construct the neonatal brain atlas. Each of these components contributes to the final atlas construction, as explained and demonstrated below.
Frequency Domain
Wavelet decomposition provides multi‐resolution views of the brain images for better preservation of anatomical structures in atlas construction.
Difference in image composition
Figure 5 denotes an example of the essential difference for constructing the atlas without/with frequency domain decomposition. As shown in Figure 5a–c, three patches from the same location of the average atlas and the atlases constructed with/without frequency domain decomposition are decomposed into frequency subbands. Similarly, patches from the related locations of subject images are used to build the subband dictionary . Figure 5d–f further show how these dictionary patches contribute to the atlases constructed using different methods. For the average atlas (shown in (d)), all the patches share an equal weight, which is equal to the reciprocal of the number of subjects. Thus all information in the subject images is included into the average atlas. The common global structures are preserved, while various details are blurred. As shown in Figure 5b, the global brain structures are enhanced in the patch‐based atlas construction without frequency subband decomposition. Patches from the respective subjects are combined with unequal weights, even though weights on different subbands are kept the same (Fig. 5e). These weights are estimated in the original image domain, where the energy of the low frequency subband (subband “LLL” on Scale 3, denoting global structure) dominates over 94% of the total image energy. Thus, minor brain structures remain blurred. Figure 5f demonstrates that, in the proposed atlas, the compositions of patches on each subband are different. Global structures are enhanced in the lower frequency subbands, and also detailed structures are enhanced in higher frequency subbands. Therefore, the proposed method is robust and is detail‐preserving.
Figure 5.
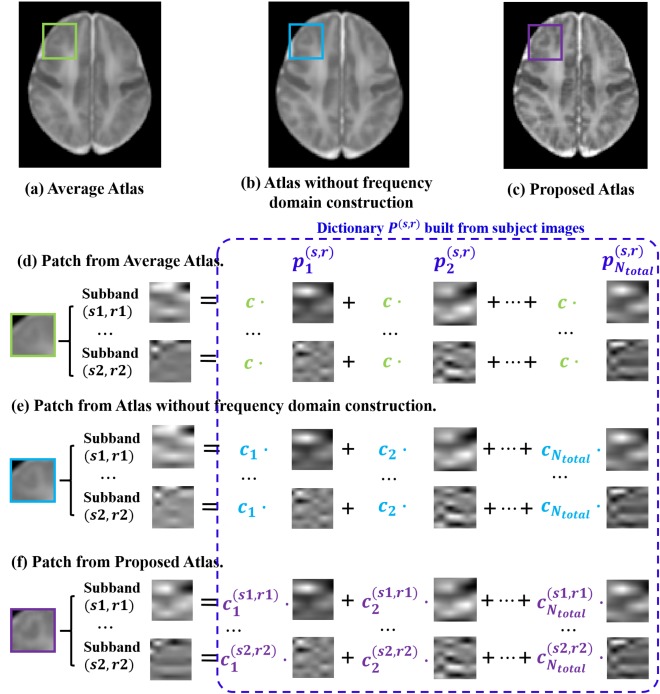
(a) Average atlas. (b) Atlas built without frequency domain decomposition. (c) Proposed atlas built with frequency domain construction. (d) An example patch from the average atlas, along with its frequency subband composition examples. For the average atlas, dictionary elements are combined with equal weights. (e) Similar composition example for the patch from the atlas built without frequency domain decomposition. Dictionary elements from respective subjects are combined with unequal weights, although weights on different subbands remain the same. (f) For building the proposed atlas, dictionary elements for different subjects and different subbands are combined with different contributions. See text for details. The patches shown here are enlarged for illustration purpose. [Color figure can be viewed in the online issue, which is available at http://wileyonlinelibrary.com.]
Comparison of image components
Figure 6 shows visual evaluation of image components. Each atlas is displayed with four main image components. The “low frequency component” indicates the image component captured by the “LLL” filter on Scale 3. Similarly, the “high‐frequency components” of scale 1, 2, and 3 are the components extracted by all the seven high pass filters on each scale level. By comparing the components of different frequency bands, we observe that the randomly selected single subject image (top row in Fig. 6) has more structures and higher intensity contrast in high‐frequency domain than the average atlas (second row in Fig. 6). This suggests that the image averaging process acts as a low pass filter, which smoothes out high‐frequency components during the averaging process. Thus, by performing construction in the space‐frequency domain given by wavelet transform, the quality of the atlas is better (bottom row in Fig. 6) than that given by construction only in the spatial domain (third row in Fig. 6).
Figure 6.
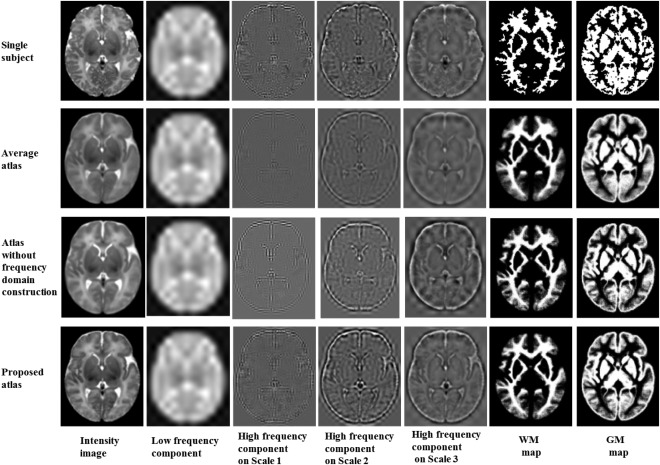
Image components of a single‐subject image (top row), the average atlas (second row), the atlas built without frequency domain construction (third row), and the proposed atlas (bottom row). In columns 2–5 are the four key components of the respective intensity image (in column 1). The image component of the constructed atlas is comparable to the single subject atlas. The right two columns show tissue maps of the three atlases.
Since different frequency subbands comprise different image components, the sharpness of the atlases can be illustrated from the signal energy value of high‐frequency subbands. We thus assess structural sharpness by means of the image energy variation across all frequency subbands. We employ the individual images used for our atlas construction as a reference of single‐subject atlases. The energy of each frequency subband is defined as the L 2‐norm of wavelet coefficients in that subband. The average energy is computed for each of the 24 wavelet subbands (including three scales, and eight orientations for each scale) of the 73 subject images. We then compare signal energy between the single‐subject atlas, the simple average atlas, and the proposed atlas. Figure 7 shows the energy distributions for different scale levels and orientations. For the atlas created with simple averaging (bright yellow bars), and the atlas built without frequency domain construction (light green bars), the energy loss is significant in the high‐frequency subbands (e.g., from subband “HLL” to “HHH” in Scale 1), compared with the single‐subject atlas (blue bars) and the atlas created using the proposed method (dark green bars). The energy loss can also be observed in the higher frequency subbands (e.g., subband “HHH”) of Scale 2 and Scale 3. The proposed atlas mitigates the energy loss problem. This illustrates that the proposed atlas preserves additional anatomical details from individual images and is hence more representative of the population.
Figure 7.

Image energy distributions across orientations and scales, for the individual images, the average atlas, and the proposed atlas. Higher energy values in high‐frequency subbands represent better preservation of anatomical details. It is illustrated that the proposed atlas (dark green bars) preserves more details from single‐subject atlases (by considering blue bars as standard), comparing with the average atlas (i.e., light green bars). [Color figure can be viewed in the online issue, which is available at http://wileyonlinelibrary.com.]
Comparison of constructed atlases
As illustrated in Figure 8, the intensity atlas and tissue maps in the top two rows are given by the proposed framework without wavelet decomposition. Compared with the proposed atlas in the bottom two rows, many anatomical details are not preserved. This is because the atlas construction process in the original image domain is dominated by low frequency components.
Figure 8.
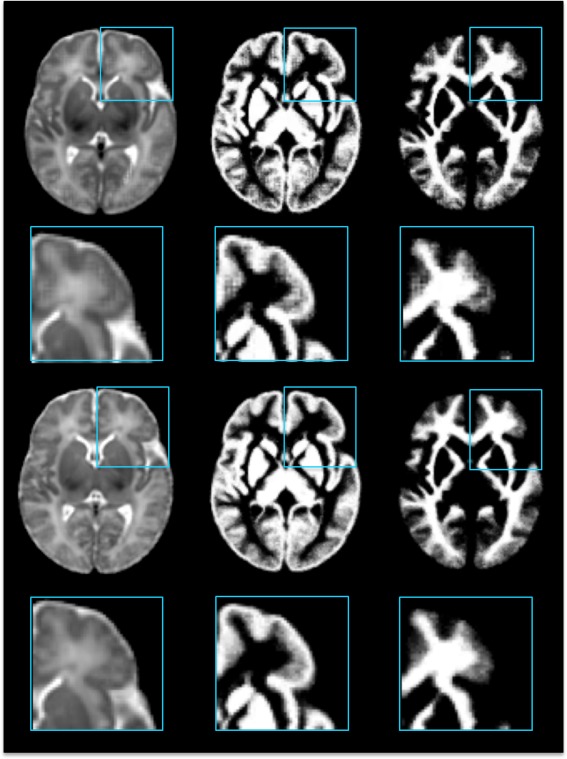
Atlas construction without/with frequency domain construction. The top two rows show the intensity atlas and the probability tissue maps constructed from the original image domain. The bottom two rows show the atlases given by the proposed method. [Color figure can be viewed in the online issue, which is available at http://wileyonlinelibrary.com.]
Comparison of atlas‐guided image normalizations
The advantage of the population‐average atlases is the representativeness. We evaluate the neonatal population‐average atlases without/with frequency domain construction in terms of how well they can spatially normalize the test populations of neonatal images. In this assessment, we use three test datasets that cover the high‐to‐low image resolution. These datasets are independent of the subjects used for atlas construction. The test dataset 1 is the high‐resolution dataset. It includes eight neonatal images, scanned at postnatal 14 to 58 days on a 3T Siemens scanner [Shi et al., 2011a, 2011b]. T2 images were obtained with 87 axial slices at a resolution of 1.00×1.00×1.30 mm3. The test dataset 2 is the normal resolution test set, which includes 15 neonatal images, scanned at 37‐41 gestational weeks using a Siemens 3T scanner. T2‐weighted images were obtained with 70 axial slices for a resolution of 1.25×1.25×1.95 mm3. The test dataset 3 is the low‐resolution dataset, which was derived from the healthy neonatal subjects of the online public National Database for Autism Research (NDAR, http://ndar.nih.gov/) [Hall et al., 2012]. It contains totally 12 selected low‐resolution subjects, which are scanned at postnatal age of 8 to 21 days on a 1.5T scanner. T2 images were obtained with 39 axial slices at a resolution of 0.98×0.98×3.00 mm3. Similar image preprocessing was performed to three datasets, including bias correction, skull stripping, and tissue segmentation. All test images are aligned to the atlases without/with frequency domain construction by first using affine registration [Jenkinson et al., 2002] and then non‐linear deformable registration with Diffeomorphic Demons [Vercauteren et al., 2009], respectively.
The effectiveness of atlas‐guided normalization is confirmed by the averaged normalized GM maps of test images in Figure 9. Gray matter is distributed at the surfaces of the cerebral hemispheres (cerebral cortex) and the cerebellum (cerebellar cortex), as well as the deep cerebrum and brainstem [Sowell et al., 2001]. Thus, more precise registration of cerebral cortex leads to more accurate GM maps. Figure 9 compares the average GM maps generated by atlas‐guided normalizations, using (left column) the average atlas, (middle column) the atlas constructed without frequency‐domain construction, and (right column) the proposed atlas as references, respectively. The GM map in the right column, which is normalized using the proposed atlas, shows clearer cortical structures than the maps in other two columns. This is because the proposed atlas provides an improved detail‐preserved template, thus is able to guide registration more precisely in the cerebral cortex region.
Figure 9.
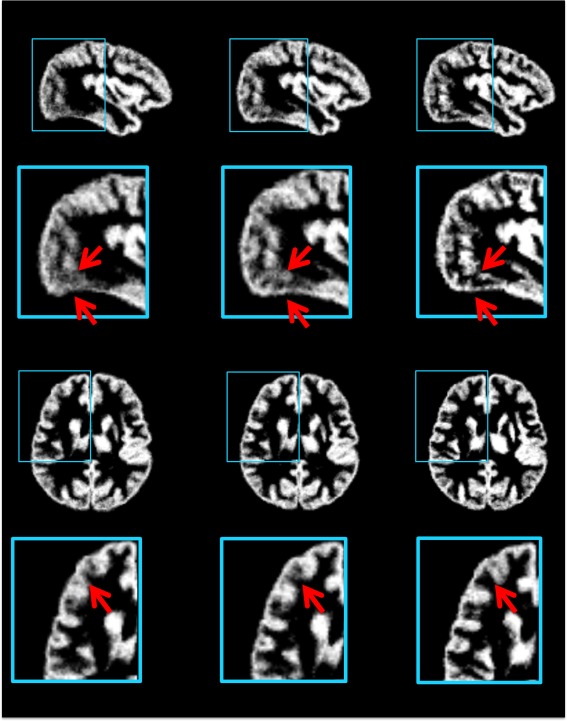
GM maps generated by averaging the GM maps of normalized test images. The normalization was performed using (left column) the average atlas, (middle column) the atlases constructed without frequency‐domain construction, and (right column) the proposed atlas as references, respectively. The average GM map in the right column shows more detailed cortical structures, compared to the other two GM maps. [Color figure can be viewed in the online issue, which is available at http://wileyonlinelibrary.com.]
For each atlas and each normalized test dataset, we first use all aligned segmentation images to get a mean segmentation image by voxel‐wise majority voting. We then compare this mean segmentation image with each of the aligned images to assess the normalization consistency associated with the given atlas. In particular, after warping to the atlas space, the segmentation images of all individuals are presented as probability maps , where represents the number of warped test images. Each voxel in denotes the possibility of each tissue label . The label map of the mean segmentation is computed as:
| (6) |
The aligned individual segmentation images are then compared with this mean segmentation image by computing the Dice Ratio: , . DR ranges from 0 (for totally disjoint segmentations) to 1 (for identical segmentations). The structural agreement is calculated in pair of each aligned image and the voted mean segmentation image, which denotes the ability of each atlas for guiding test images into a common space. Statistical analysis results are shown in Figure 10. As can be observed that the proposed atlas outperforms other atlases in GM, WM, and CSF alignment, for all the three test datasets.
Figure 10.
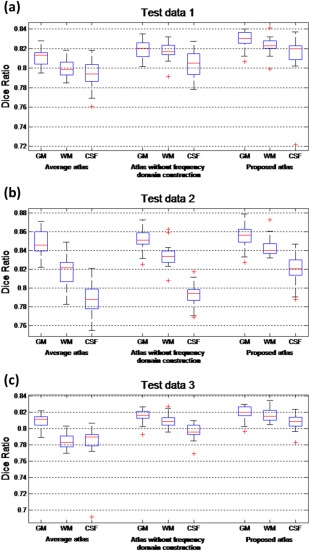
Box plots of Dice ratios using the average atlas, the atlas built without frequency domain construction, and the proposed atlas for image normalization, respectively. (a) Box plots of Dice ratios for high‐resolution test images; (b) Box plots of Dice ratios for normal‐resolution test images; (c) Box plots of Dice ratios for low‐resolution test images. Red lines in the boxes mark the medians. The boxes extend to the lower and upper quartiles (i.e., 25% and 75%). Whiskers extend to the minimum and maximum values in one‐and‐a‐half interquartile range. Outliers beyond this range are marked by red crosses “+”. [Color figure can be viewed in the online issue, which is available at http://wileyonlinelibrary.com.]
Spatial Domain
Neighboring patches are group‐constrained for spatially consistent atlas construction. With similar sparse representations for neighboring patches, the consistency of the related subject patches is propagated to the constructed atlas. For more convinced comparison, we constructed the atlases and tissue maps in Figure 11 without any overlap between patches, so that the enforcement of spatial consistency only relies on the group‐constrained strategy described in “Consistency in Spatial Domain” Section. As shown in the top two rows of Figure 11, without spatial consistency constraint, the atlas suffers from blocking artifacts. The bottom two rows of Figure 11 show that, with group‐sparse constraint, consistency is maintained.
Figure 11.
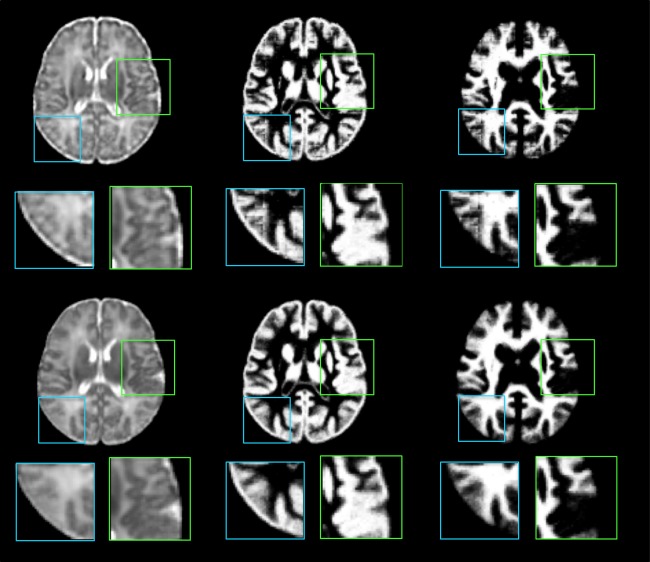
Atlas construction without/with spatial consistency constraint. In the top two rows, the atlas and the tissue maps are constructed patch‐by‐patch independently. In the bottom two rows, the neighboring patches are group‐constrained. [Color figure can be viewed in the online issue, which is available at http://wileyonlinelibrary.com.]
Anatomical Consistency
Figure 12 shows the atlases constructed without/with anatomical constraint. Comparing the two axial slices and the close‐up views, the atlas constructed using anatomical features gives greater contrast.
Figure 12.
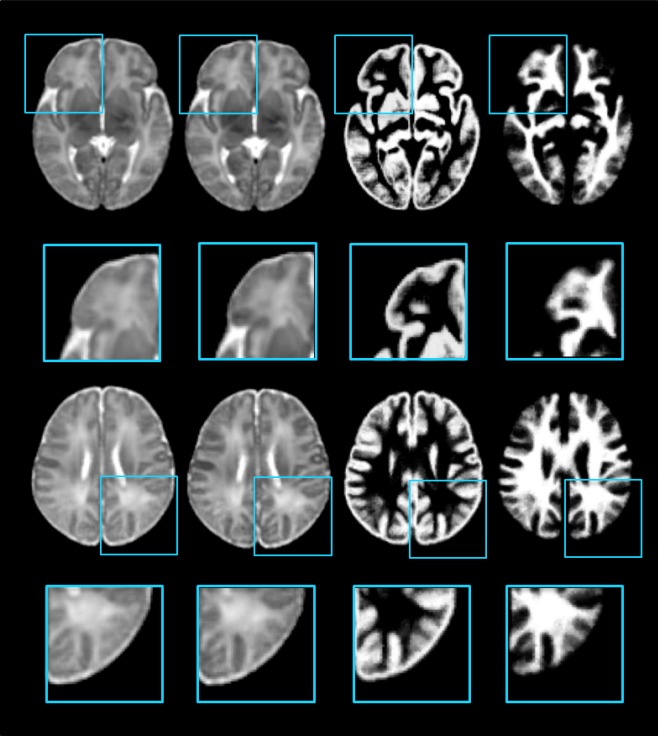
Comparison of the atlas constructions without/with anatomical supervision. In the left column, the atlas is constructed simply with the intensity images. And for the right three columns, for emphasizing the anatomical significance, the atlas and probability maps are constructed jointly. [Color figure can be viewed in the online issue, which is available at http://wileyonlinelibrary.com.]
Atlas Construction Using 73 Subjects
Figure 13(a–f) show six representative axial slices of the neonatal brain atlas constructed by the proposed method. Despite the large number of subjects (73) used for atlas construction, the atlas still contains clear structural details especially in the cortical regions.
Figure 13.
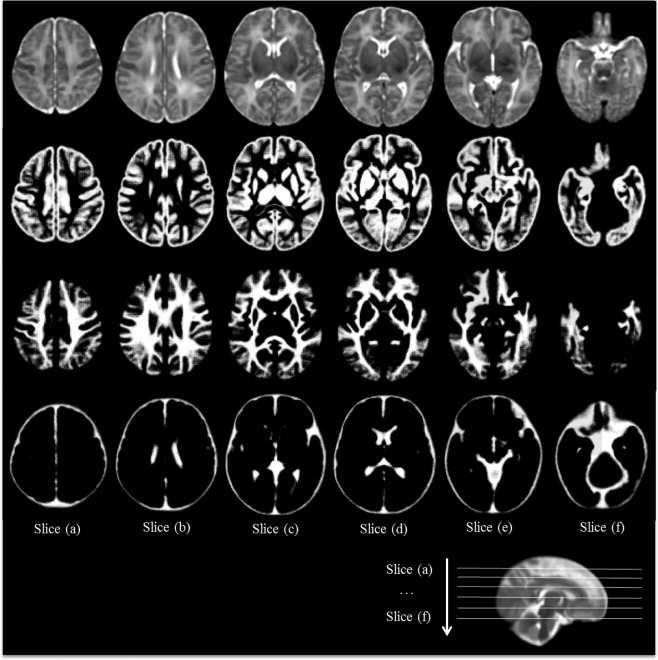
Construction of the neonatal atlas from 73 subjects using the proposed method. From top to bottom are the intensity atlas and three tissue (GM, WM, CSF) probability maps.
Comparison With State‐of‐the‐Art Neonatal Population‐Average Atlases
Four state‐of‐the‐art neonatal population‐average atlases are included for visual inspection. Atlas‐A: The atlas created by Kuklisova‐Murgasova et al. [2011], longitudinally for each week between week 28.6 to week 47.7 using 142 neonatal subjects. And we select their atlas of 41 weeks. Atlas‐B: The atlas constructed by Oishi et al. [2011] using 25 brain images from neonates of 0–4 days of age. Atlas‐C: The 41‐th week atlas built by Serag et al. [2012] involving 204 premature neonates between 26.7 and 44.3 gestational weeks. Atlas‐D: The neonatal atlas created by Shi et al. [2014], involving neonatal brain images scanned at postnatal ages of 9‐55 days. An atlas created by simply averaging the 73 neonatal images is also included for comparison. One can easily observe from Figure 14 that the atlas generated by the proposed method provides the clearest structural details. Note that, Atlas‐A, Atlas‐B, and Atlas‐C were constructed with datasets different from ours and thus may have different appearance from our atlas.
Figure 14.
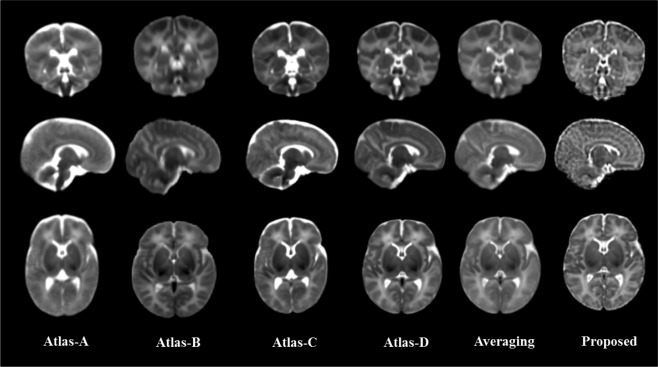
Comparison of neonatal atlases constructed by Kuklisova‐Murgasova et al. (Atlas‐A, 2010), Oishi et al. (Atlas‐B, 2011), Serag et al. (Atlas‐C, 2012), Shi et al. (Atlas‐D, 2014), simple averaging (Averaging), and our proposed method (Proposed) on the 73 aligned images. Similar slices were selected from each of these six atlases for the ease of comparison.
CONCLUSION
In this article, we presented a novel space‐frequency domain based sparse representation method for better preservation of structural details in neonatal brain atlases. Our approach employs a hierarchical strategy in constructing the atlas by combining atlases constructed from the frequency subbands using wavelet decomposition. Experimental results demonstrated that our approach is able to preserve richer anatomical details with better performance on neonatal image normalization than other state‐of‐the‐art neonatal atlases.
REFERENCES
- Aljabar P, Heckemann RA, Hammers A, Hajnal JV, Rueckert D (2009): Multi‐atlas based segmentation of brain images: Atlas selection and its effect on accuracy. Neuroimage 46:726–738. [DOI] [PubMed] [Google Scholar]
- Artaechevarria X, Munoz‐Barrutia A, Ortiz‐de‐Solórzano C (2009): Combination strategies in multi‐atlas image segmentation: Application to brain MR data. Med Imaging, IEEE Trans 28:1266–1277. [DOI] [PubMed] [Google Scholar]
- Cabezas M, Oliver A, Lladó X, Freixenet J, Cuadra MB (2011): A review of atlas‐based segmentation for magnetic resonance brain images. Comp Method Prog Biomed 104:e158–e177. [DOI] [PubMed] [Google Scholar]
- Damasio H (1995): Human Brain Anatomy in Computerized Images. New York, NY: Oxford University Press. [Google Scholar]
- Evans AC, Janke AL, Collins DL, Baillet S (2012): Brain templates and atlases. Neuroimage 62:911–922. [DOI] [PubMed] [Google Scholar]
- Fonov V, Evans AC, Botteron K, Almli CR, McKinstry RC, DL Collins, Brain Development Cooperative Group (2011): Unbiased average age‐appropriate atlases for pediatric studies. NeuroImage 54:313–327. [DOI] [PMC free article] [PubMed] [Google Scholar]
- JH Gilmore, F Shi, SL Woolson, RC Knickmeyer, SJ Short, W Lin, H Zhu, RM Hamer, M Styner, D Shen (2012): Longitudinal development of cortical and subcortical gray matter from birth to 2 years. Cereb Cortex 22:2478–2485. [DOI] [PMC free article] [PubMed] [Google Scholar]
- Hall D, Huerta MF, McAuliffe MJ, Farber GK (2012): Sharing heterogeneous data: The national database for autism research. Neuroinformatics 10:331–339. [DOI] [PMC free article] [PubMed] [Google Scholar]
- Jenkinson M, Bannister P, Brady M, Smith S (2002): Improved optimization for the robust and accurate linear registration and motion correction of brain images. Neuroimage 17:825–841. [DOI] [PubMed] [Google Scholar]
- M Kuklisova‐Murgasova, P Aljabar, L Srinivasan, SJ Counsell, V Doria, A Serag, IS Gousias, JP Boardman, MA Rutherford, AD Edwards, JV Hajnal (2011): A dynamic 4D probabilistic atlas of the developing brain. NeuroImage 54:2750–2763. [DOI] [PubMed] [Google Scholar]
- Liu J, Ji S, Ye J (2009) Multi‐task feature learning via efficient l 2, 1‐norm minimization. In: Proceedings of the twenty‐fifth conference on uncertainty in artificial intelligence, AUAI Press, Corvallis, 339–348.
- Luo Y, Shi L, Weng J, He H, Chu WC, F Chen, D Wang (2014): Intensity and sulci landmark combined brain atlas construction for Chinese pediatric population. Hum Brain Mapp 35:3880–3892. [DOI] [PMC free article] [PubMed] [Google Scholar]
- Mazziotta J, Toga A, Evans A, Fox P, Lancaster J, K Zilles, R Woods, T Paus, G Simpson, B Pike, C Holmes (2001): A probabilistic atlas and reference system for the human brain: International Consortium for Brain Mapping (ICBM). Philos Trans Roy Soc B: Biol Sci 356:1293–1322. [DOI] [PMC free article] [PubMed] [Google Scholar]
- Oishi K, Mori S, Donohue PK, Ernst T, Anderson L, S Buchthal, A Faria, H Jiang, X Li, MI Miller, PC van Zijl (2011): Multi‐contrast human neonatal brain atlas: Application to normal neonate development analysis. Neuroimage 56:8–20. [DOI] [PMC free article] [PubMed] [Google Scholar]
- Schuh A, Murgasova M, Makropoulos A, Ledig C, Counsell SJ, JV Hajnal, P Aljabar, D Rueckert (2015) Construction of a 4D Brain Atlas and Growth Model Using Diffeomorphic Registration. Spatio‐temporal Image Analysis for Longitudinal and Time‐Series Image Data: Springer. pp. 27–37.
- Serag A, Aljabar P, Counsell S, Boardman J, Hajnal JV, D Rueckert (2011): Construction of a 4D atlas of the developing brain using non‐rigid registration. IEEE 1532–1535. [Google Scholar]
- Serag A, Aljabar P, Ball G, Counsell SJ, Boardman JP, MA Rutherford, AD Edwards, JV Hajnal, D Rueckert (2012): Construction of a consistent high‐definition spatio‐temporal atlas of the developing brain using adaptive kernel regression. NeuroImage 59:2255–2265. [DOI] [PubMed] [Google Scholar]
- Shen D, Davatzikos C (2002): HAMMER: Hierarchical attribute matching mechanism for elastic registration. IEEE Trans Med Imaging 21:1421–1439. [DOI] [PubMed] [Google Scholar]
- Shi F, Shen D, Yap PT, Fan Y, Cheng JZ, H An, LL Wald, G Gerig, JH Gilmore, W Lin (2011a): CENTS: Cortical enhanced neonatal tissue segmentation. Hum Brain Mapp 32:382–396. [DOI] [PMC free article] [PubMed] [Google Scholar]
- Shi F, Yap PT, Wu G, Jia H, Gilmore JH, W Lin, D Shen (2011b): Infant brain atlases from neonates to 1‐and 2‐year‐olds. PLoS One 6:e18746 [DOI] [PMC free article] [PubMed] [Google Scholar]
- Shi F, Wang L, Dai Y, Gilmore JH, Lin W, D Shen (2012): LABEL: Pediatric brain extraction using learning‐based meta‐algorithm. Neuroimage 62:1975–1986. [DOI] [PMC free article] [PubMed] [Google Scholar]
- Shi F, Wang L, Wu G, Li G, Gilmore JH, W Lin, D Shen (2014): Neonatal atlas construction using sparse representation. Hum Brain Mapp 35:4663–4677. [DOI] [PMC free article] [PubMed] [Google Scholar]
- Singh A, Porikli F, Ahuja N (2014): Super‐resolving noisy images. Proceedings of the IEEE Conference on Computer Vision and Pattern Recognition: 2846–2853.
- Sled JG, Zijdenbos AP, Evans AC (1998): A nonparametric method for automatic correction of intensity nonuniformity in MRI data. IEEE Trans Med Imaging 17:87–97. [DOI] [PubMed] [Google Scholar]
- Smith SM, Jenkinson M, Woolrich MW, Beckmann CF, Behrens TE, H Johansen‐Berg, PR Bannister, M De Luca, I Drobnjak, DE Flitney, RK Niazy (2004): Advances in functional and structural MR image analysis and implementation as FSL. Neuroimage 23:S208–S219. [DOI] [PubMed] [Google Scholar]
- Sowell ER, Thompson PM, Tessner KD, Toga AW (2001): Mapping continued brain growth and gray matter density reduction in dorsal frontal cortex: Inverse relationships during postadolescent brain maturation. J Neurosci 21:8819–8829. [DOI] [PMC free article] [PubMed] [Google Scholar]
- Talairach P, Tournoux J (1988) A Stereotactic Coplanar Atlas of the Human Brain. Stuttgart: Thieme. [Google Scholar]
- Tibshirani R (1996): Regression shrinkage and selection via the lasso. J Roy Stat Soc Ser B (Methodological) 267–288. [Google Scholar]
- Tzourio‐Mazoyer N, Landeau B, Papathanassiou D, Crivello F, Etard O, N Delcroix, B Mazoyer, M Joliot (2002): Automated anatomical labeling of activations in SPM using a macroscopic anatomical parcellation of the MNI MRI single‐subject brain. Neuroimage 15:273–289. [DOI] [PubMed] [Google Scholar]
- Vercauteren T, Pennec X, Perchant A, Ayache N (2009): Diffeomorphic demons: Efficient non‐parametric image registration. NeuroImage 45:S61–S72. [DOI] [PubMed] [Google Scholar]
- Wang H, Suh JW, Das SR, Pluta JB, Craige C, PA Yushkevich (2013): Multi‐atlas segmentation with joint label fusion. Pattern analysis and machine intelligence. IEEE Trans 35:611–623. [DOI] [PMC free article] [PubMed] [Google Scholar]
- Wang L, Shi F, Yap PT, Gilmore JH, Lin W, D Shen (2012) 4D multi‐modality tissue segmentation of serial infant images. PLOS One 7(9):e44596. [DOI] [PMC free article] [PubMed]
- Wei H, Viallon M, Delattre B, Moulin K, Yang F, P Croisille, Y Zhu (2015): Free‐breathing diffusion tensor imaging and tractography of the human heart in healthy volunteers using wavelet‐based image fusion. IEEE Trans Med Imaging 34:306–316. [DOI] [PubMed] [Google Scholar]
- Wu G, Jia H, Wang Q, Shen D (2011): SharpMean: Groupwise registration guided by sharp mean image and tree‐based registration. NeuroImage 56:1968–1981. [DOI] [PMC free article] [PubMed] [Google Scholar]
- Wu G, Wang Q, Jia H, Shen D (2012): Feature‐based groupwise registration by hierarchical anatomical correspondence detection. Hum Brain Mapp 33:253–271. [DOI] [PMC free article] [PubMed] [Google Scholar]
- Wu G, Wang Q, Zhang D, Nie F, Huang H, D Shen (2014): A generative probability model of joint label fusion for multi‐atlas based brain segmentation. Med Image Analysis 18:881–890. [DOI] [PMC free article] [PubMed] [Google Scholar]
- Yeo BT, Sabuncu MR, Desikan R, Fischl B, Golland P (2008): Effects of registration regularization and atlas sharpness on segmentation accuracy. Medical Image Analysis 12:603–615. [DOI] [PMC free article] [PubMed] [Google Scholar]
- Zhang Y, Chang L, Ceritoglu C, Skranes J, Ernst T, S Mori, MI Miller, K Oishi (2014): A Bayesian approach to the creation of a study‐customized neonatal brain atlas. NeuroImage 101:256–267. [DOI] [PMC free article] [PubMed] [Google Scholar]
- Y Zhang, F Shi, PT Yap, D Shen (2015) Space‐Frequency Detail‐Preserving Construction of Neonatal Brain Atlases. Medical Image Computing and Computer‐Assisted Intervention–MICCAI 255–262. Springer International Publishing. [DOI] [PMC free article] [PubMed]


