Figure 6.

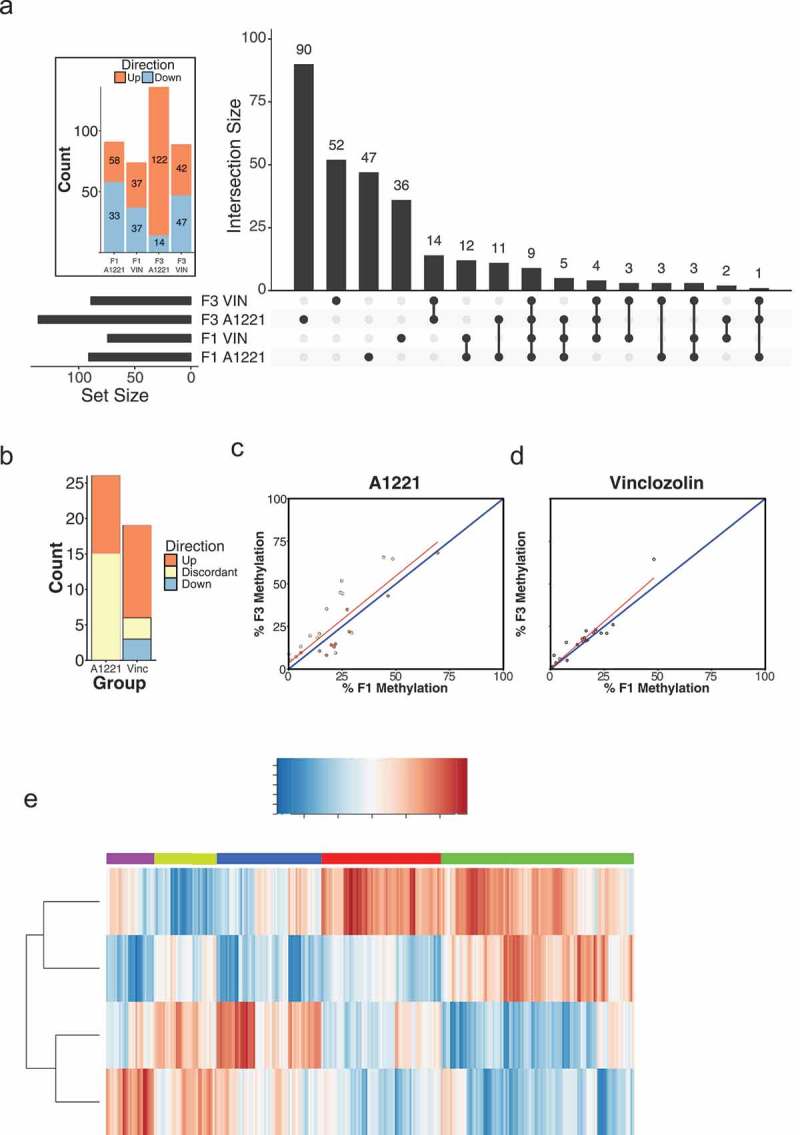
Differentially methylated (versus vehicle, p < 0.05 after FDR) CpG islands relative to vehicle control in F1 and F3 CA3 are shown by generation and treatment. a) The intersection, the number of significantly altered CpG islands identified that are either unique or common between groups, is shown for all possible group combinations. Most identified CpG islands were unique to each generation and treatment, followed by within generation, then within treatment. The total number of altered CpG islands per treatment lineage and generation is shown in the figure inset; orange indicates CpG islands with increased methylation compared to vehicle, and blue indicates decreased methylation. b) The number and directionality of change of DMRs is shown between the F1 and F3 generations in relationship to vehicle. Orange indicates hypermethylation compared to vehicle in both the F1 and F3 generation, blue indicates hypomethylation in both generations, and yellow indicates that a CpG island is significantly affected in both generations but in opposite directions. A1221 had more transgenerational DMRs but more discordance between generations compared to VIN. c & d) The % DNA methylation of probes affected in both the F1 and F3 generation were correlated within A1221 and VIN CA3, respectively. Data points below the 1:1 blue diagonal line have higher methylation in the F1 generation while those above have higher methylation in the F3 generation. e) Normalized % methylation relative to vehicle of all probes (CpG islands) affected across treatment groups is shown. Red indicates increased methylation compared to vehicle and blue indicates decreased methylation compared to vehicle normalized within a given CpG island. Generation was a significant clustering factor (both AU/BP = 100/100%).
