Figure 6.

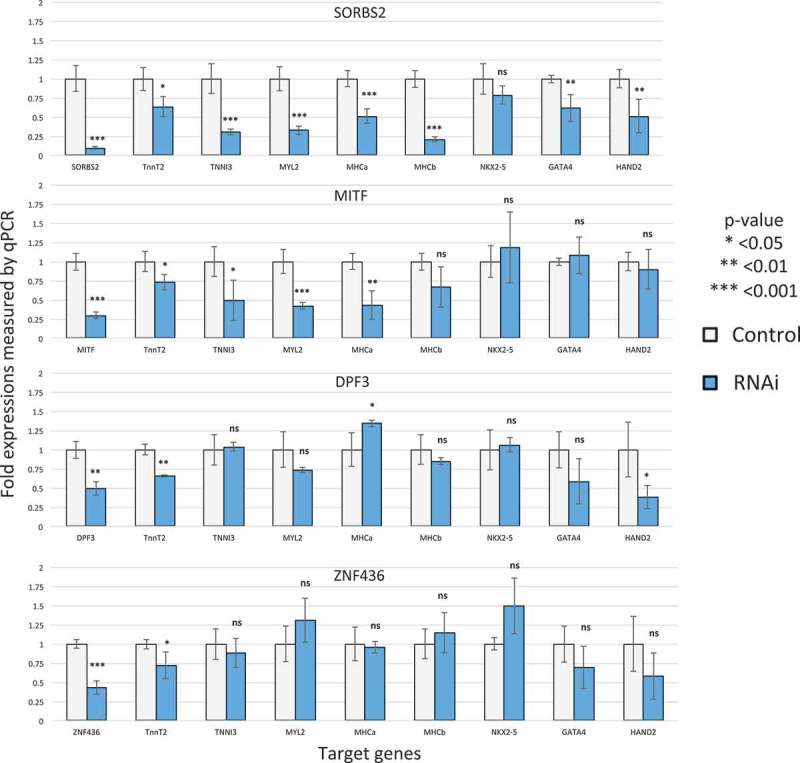
siRNA gene expression knockdown identifies four novel cardiac regulators. The y-axis represents the relative expression level (control is 1). The gray bar represents the control while the blue bar represents the RNAi result of that factor.

siRNA gene expression knockdown identifies four novel cardiac regulators. The y-axis represents the relative expression level (control is 1). The gray bar represents the control while the blue bar represents the RNAi result of that factor.