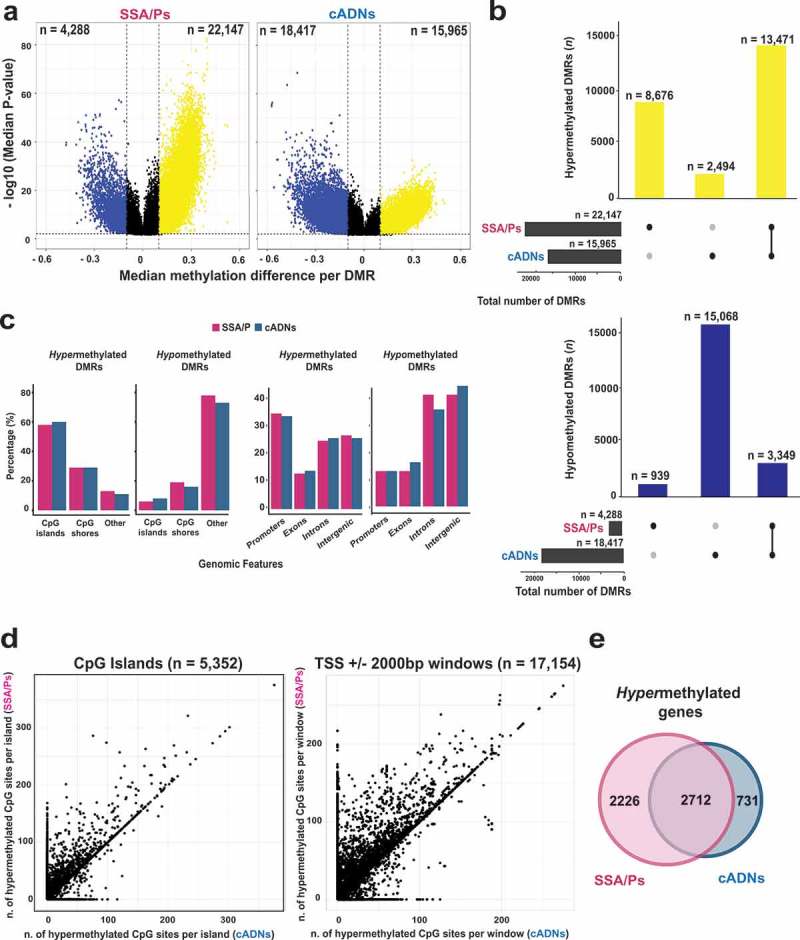
Figure 2.

Differentially methylated regions (DMRs) in precursor lesions and proto-CIMP in SSA/Ps. a. Volcano plots showing the median differential methylation (x-axis) and its statistical significance (y-axis) for DMRs found in SSA/Ps and cADNs. (See Figure 1B legend for cutoffs and color codes) b. UpSet plots showing the lesion-specificity of hypermethylated and hypomethylated DMRs found in precancerous tumors. Exact numbers of lesion-specific (•) and shared (•-•) DMRs appear above the bars. c. Genomic location of DMRs in SSA/Ps vs cADNs. d. Scatterplots showing the extent of methylation at regions hypermethylated in both SSA/Ps and cADNs, and located within CpG islands (dots in the left panel) or 4-kb peri-TSS windows, i.e., TSS plus 2000-bp upstream and downstream flanking regions (dots in the right panel). In addition, CpG islands or peri-TSS windows with at least one hypermethylated CpG in either SSA/Ps or cADNs are included in the two graphics (i.e., dots along the y or x axis, respectively). e. Venn diagrams showing overlap between sets of genes in SSA/Ps and cADNs whose peri-TSS window contained at least one hypermethylated DMR.
