Abstract
Most adult carcinomas develop from noninvasive precursor lesions, a progression that is supported by genetic analysis. We analyzed the somatic variants of co-existing pancreatic cancers and precursor lesions sampled from distinct regions of the same pancreas. After inferring evolutionary relationships, we found that the ancestral cell had initiated and clonally expanded to form one or more lesions, and that subsequent driver gene mutations eventually led to an invasive pancreatic cancer. We estimate that this multi-step progression generally spans many years. These new data reframe the step-wise progression model of pancreatic cancer by illustrating independent, high-grade pancreatic precursor lesions observed in a single pancreata often represent a single neoplasm that has colonized the ductal system, accumulating spatial and genetic divergence over time.
The transformation of a normal cell to invasive cancer occurs through the accumulation of genetic and epigenetic changes1. Many invasive carcinomas of adults develop from morphologically recognizable noninvasive precursor lesions2. The most common precursor lesion associated with pancreatic ductal adenocarcinoma (PDAC) is pancreatic intraepithelial neoplasia (PanIN)3. At the morphologic level, low-grade PanINs (LG-PanIN, PanIN-1 and PanIN-2) have minimal to moderate cytologic atypia and higher-grade PanINs (HG-PanIN, PanIN-3) have severe cytologic atypia. HG-PanINs exhibit morphological features that are thought to facilitate progression to an infiltrating carcinoma4.
Aspects of this progression are supported by genetic studies4–6, yet fundamental questions about the development of PDAC remain7. The majority of PanINs (regardless of grade) harbor KRAS mutations; increasing grade of PanINs and invasive carcinomas are more likely to contain additional driver gene alterations such as those in TP53, CDKN2A, and SMAD4. Moreover, PanINs adjacent to PDACs often share many genetic alterations in both passenger and driver genes8,9. Collectively, these observations suggest a subset of PDACs arise from adjacent PanINs, just as a colorectal carcinoma can arise from an underlying adenoma10. However, in individuals with multiple anatomically distinct PanINs11, the biologic and genetic relationships among these lesions and their clinical significance are not fully understood12. For instance, cancerization of the pancreatic ducts by an established PDAC recapitulates lesions with histopathologic features that are difficult to distinguish from those of bona fide PanIN precursor lesions13. Further, the importance of non-invasive precursor lesions was recently challenged by a whole genomic sequence analysis of pancreatic cancers which proposed that pancreatic cancer tumorigenesis is neither gradual nor slow14. We posited that a genomic evaluation of PDAC and matched co-evolving PanINs would provide additional insights into the biology of pancreatic cancer precursors and the dynamics of step-wise progression.
Evolutionary scenarios
Figure 1a presents the conceptual framework underlying the interpretation of sequencing data generated from one PanIN and PDAC in the same patient, outlining three possible scenarios that in theory might be found. In the first scenario, the PanIN and the PDAC do not share any somatic mutations and arose independently. In the second scenario, the PanIN shares a subset of the somatic passenger and driver gene mutations with the PDAC, but the PDAC contains additional driver or passenger gene alterations not present in the PanIN. Scenario 2 presumes that a common ancestral cell underwent initiation and clonal expansion prior to seeding the PanIN and PDAC, but neither the common ancestral cell nor the founding PanIN cell had yet acquired all the genetic events required to generate an invasive neoplasm. In the third scenario, the PanIN and the PDAC share some passenger mutations and all driver gene alterations, and the ancestral cell that seeded both the PDAC and PanIN already acquired all alterations required to form a malignant cancer.
Figure 1. Evolutionary scenarios and study strategy of coexistent PanIN(s) and PDAC.
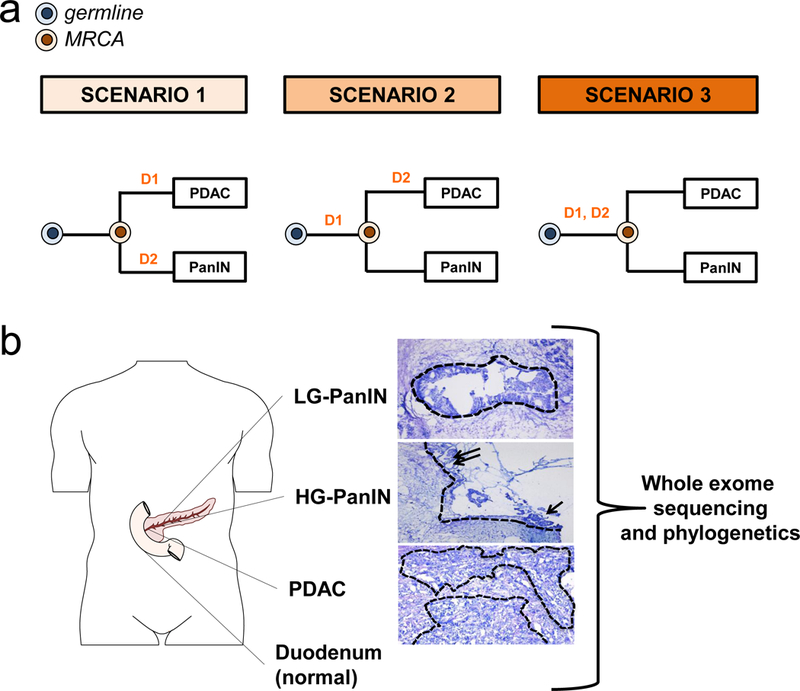
a. Evolutionary scenarios of coexistent PanIN(s) and PDAC. For each of the three evolutionary scenarios, D1 and D2 indicate two hypothetical driver gene alterations whereas the colored cells represent the germline (matched normal sample) in blue and the most recent common ancestor (MRCA) in orange for each PanIN/PDAC pair. The primary tumor is labeled “PDAC” while the PanIN is labeled by a letter. In scenario 1, none of the somatic gene alterations are shared by the PanIN and PDAC. Mutation D1 is private to PDAC and mutation D2 is private to the PanIN. In scenario 2, only D1 is shared by the PanIN and PDAC. The mutation in D2 is private to the PDAC. In scenario 3, both D1 and D2 driver gene alterations are shared by the PanIN and PDAC. b. Tissue collection, histological review and microdissection, whole exome sequencing (WES), and phylogenetic analysis of human patients. Body diagram was adapted from the Motifolio toolkit. Example of PanINs and matched PDAC. The dashed outlines indicate regions that underwent laser capture microdissection of DNA extraction followed by whole exome sequencing (WES). The low-grade PanIN (LG-PanIN) shows well formed papillary structures with nuclear crowding and cytologic atypia. The high-grade PanIN (HG-PanIN) has regions of pseudopapillary formation (arrows) with high nuclear to cytoplasmic ratio. The matched PDAC shows features of poorly differentiated carcinoma with desmoplasia.
Patient selection, whole exome sequencing and phylogenetic analysis
To investigate the progression patterns of pancreatic carcinogenesis, >100 resected pancreata from over a three-year interval were prospectively screened to identify those samples in which at least one LG-PanIN (PanIN-2) or HG-PanIN (PanIN-3) was present in a region that was anatomically distinct and far removed from that of the PDAC (Methods). We excluded any patient with a personal or family history of PDAC from our study, as the dynamics of initiation in patients with germline alterations may be different from that in sporadic pancreatic carcinogenesis15. Eight patients were identified, from which 12 PanINs and eight PDACs were sampled for the current study (Supplementary Table 1). All 20 tissue samples were laser-capture microdissected to ensure that a high fraction of the cells within each lesion were neoplastic (Figure 1b). Despite the microscopic size of the PanINs, we were able to obtain sufficient amounts of DNA to generate high quality libraries for whole exome sequencing (WES). Importantly, the generation of these libraries did not require whole genome amplification prior to WES, thus reducing potential errors in downstream analyses.
Sequencing libraries were prepared from each of the lesions as well as from normal tissues of each patient and used for massively parallel sequencing on an Illumina HiSeq instrument. We obtained a median canonical exon coverage of 253x across all samples. By comparison of each lesion with its matched normal DNA, a total of 2,886 somatic single base substitutions (SNVs) and small insertions or deletions (INDELs) were identified (Extended Data Figure 1, Supplementary Table 2). As a group, the PanINs harbored as many SNVs/INDELs as the PDACs (average of 75 vs. 80, Extended Data Figure 1b). We also analyzed somatic copy number alterations (CNAs) and structural variants (SVs) from the exomic sequencing data (Supplementary Tables 3 and 4, Extended Data Figures 1c and 2). The number of CNAs, unlike the number of SNVs/INDELs, was higher in PDACs compared to PanINs (average of 90 vs 68).
Computational analysis (Methods) revealed somatic mutations in many well-known driver genes, such as KRAS, CDKN2A, TP53, SMAD4, U2AF1, and KMT2D (Supplementary Table 5). Collectively, the genetic features of this set of PanINs and PDACs were consistent with previous sequencing studies of these tumors16–20. To infer evolutionary relationships among the PanINs and PDACs for each patient based on the SNVs/INDELs, we employed Treeomics21, a recently developed phylogenetic method designed specifically for analyzing sequencing data from spatially distinct tumors in the same individual22 (Methods). Treeomics identified high confidence phylogenies for the matched samples from each of the eight patients (Figure 2a-c, Extended Data Figures 3-5). These analyses allowed us to derive the evolutionary relationships between the coexisting PanINs and the PDAC in each patient.
Figure 2. Phylogenetics of eight patients.
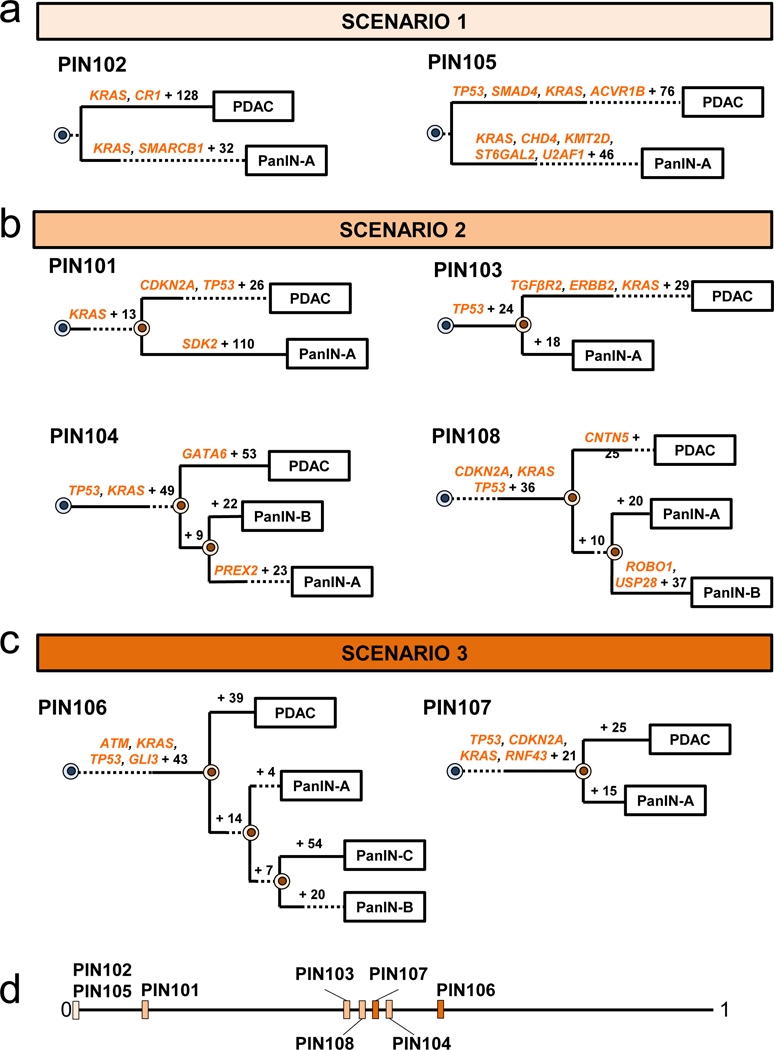
a-c. Phylogenetic trees from SNVs/INDELs. See Supplementary Table 1 for sample identities. For each phylogeny, gene names in orange text are SNVs/INDELs and the number of additionally acquired mutations are in black font. The branch lengths approximate the number of SNVs/INDELs. The dashed lines indicate branches that have been extended to accommodate gene annotation and variant numbers. The sequencing data for each driver gene variant was manually reviewed to verify phylogenetic position. a. PIN102 and PIN105 are both scenario 1. b. PIN101, PIN103, PIN104, and PIN108 are scenario 2. In manual review of the PIN101 sequencing data, a read supporting the presence of the KRAS p.G12D variant was detected in both the PDAC and PanIN-A samples and was thus moved to the trunk of the phylogeny despite the overall low coverage of KRAS in PanIN-A. c. PIN106 and PIN107 are scenario 3. d. Jaccard indices from SNVs/INDELs. For each evolutionary scenario, the average Jaccard index for each patient was calculated from all driver and passenger variants (see Supplementary Table 6 for values) and plotted on a range from 0 to 1, with values closer to 1 denoting higher genetic similarity.
Evolutionary patterns in pancreatic cancer and precursor lesions
In our cohort, we found two cases (PIN102 and PIN105) in which no passenger gene mutations were shared by the PDAC and PanIN (Figure 2a, Extended Data Figure 3). For example, in patient PIN105 both the PanIN and PDAC had a KRAS p.G12D missense mutation. The PDAC exhibited 80 additional point mutations, including a one basepair frameshift deletion in TP53, a missense mutation in ACVR1B p.C34Y, and a 15 basepair in frame deletion in SMAD4. Additionally, the PDAC acquired CNA losses affecting CDKN2A, MAP2K4, TP53, and SMAD4 (Extended Data Figure 3b). The PDAC and PanIN may have arisen independently and by chance accumulated the same KRAS mutation (scenario 1), or they may have been initiated by a single KRAS p.G12D mutant clone and subsequently diverged (i.e. scenario 2). Scenario 1 may be more likely given the high frequency of KRAS variants in PDAC (>90%)13 and the absence of any other shared somatic variants among the matched PanIN and PDAC samples in both of these patients. Moreover, the PanINs in both of these cases exhibited PanIN-2 histology, and a previous study indicated that low grade PanINs often harbor genetic features that support independent evolution. We note the previous observation included distinct KRAS variants in matched PanINs, contrary to the two cases presented here9.
Four of the eight cases showed unequivocal evidence for scenario 2, that is a common ancestral cell underwent initiation and clonal expansion to form one or more PanINs. Further clonal expansions driven by additional driver gene mutations in a PanIN cell eventually led to a PDAC (Figure 2b, Extended Data Figure 4). For example, in patient PIN101, the common ancestor of PanIN lesion A and the PDAC acquired 14 somatic passenger mutations, including a KRAS p.G12D, as well as losses affecting ACVR1B, MAP2K4, TP53, and SMAD4 (Figure 2b, Extended Data Figure 4a). The PDAC accumulated 28 point mutations including a p.A21D missense mutation in CDKN2A and a missense mutation in TP53 for p.R273H, as well as a loss affecting CDKN2A and a gain affecting MYC. The PanIN lesion A accumulated 111 point mutations, including a nonsense mutation in SDK2. Similar patterns were found in PIN103, PIN104 and PIN108, i.e. driver gene mutations common to all lesions as well as additional driver gene mutations specific to the PDAC (i.e., scenario 2, Figure 2b).
Finally, we observed two cases with phylogenetic patterns consistent with scenario 3 (PIN106 and PIN107) in which all lesions in a single pancreata shared all of the driver gene mutations identified (Figure 2c, Extended Data Figure 5). In patient PIN106, the common ancestor of all four samples harbored 47 somatic point mutations, including a p.G12D missense mutation in KRAS, a p.G266E missense mutation in TP53, a mutation affecting the splice region in ATM, and a p.Q597* in GLI3 (Figure 2c). The PDAC subsequently acquired 39 passenger mutations and losses affecting CDKN2A and SMAD4.
In summary, the lesions in four of these eight patients were unequivocally derived from the same precursor clone, as they shared multiple passenger genes and a subset of driver genes (scenario 2). The presence of these additional driver gene alterations, coupled with phylogenetic analysis, provides persuasive evidence that the PDAC was derived from a PanIN in each case. These results highlight the value of genetic evaluation of morphologically distinct legions in revealing the evolutionary dynamics of pancreatic carcinogenesis. Because the PanINs were all anatomically distinct and far removed from the PDAC (Methods), the data indicate that a single mutant clone had spread through the pancreatic ductal system to generate coexisting neoplastic lesions (Figure 3a). This situation is similar to what occurs in the bladder, wherein a single clone can form multiple anatomically distinct neoplasms23. Though it would seem much more challenging for a neoplastic cell to journey through the fluid in the pancreatic ductal system than to journey through the urine, this journey has been described in intraductal papillary mucinous neoplasms of the pancreas, and clearly occurred in these four patients as well24.
Figure 3. Putative growth pattern of coexistent PanIN(s) and PDAC and mathematical model.
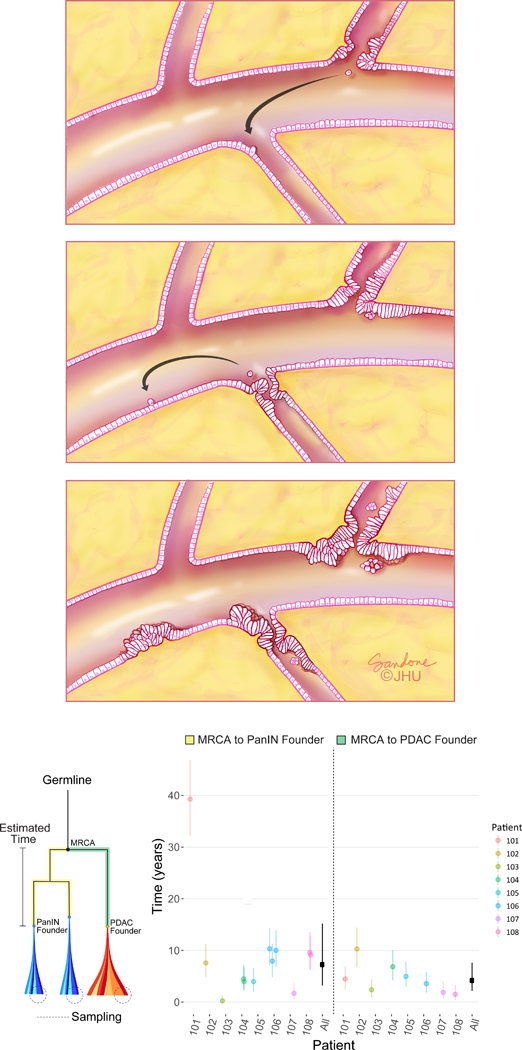
a. Spatial evolution and PanIN progression in intralobular ducts. Low grade PanIN (LG-PanIN) and high grade PanIN (HG-PanIN) lesions represent precursors with differing degrees of nuclear and cytologic atypia. A LG-PanIN develops and seeds a cell that travels to a second duct (arrow, left panel). The first LG-PanIN matures into a HG-PanIN, while a LG-PanIN develops at the second site and a cell subsequently travels to a third duct (arrow, center panel). The second site LG-PanIN matures into a HG-PanIN while a LG-PanIN develops at the second site (right panel). b. Estimated progression times. The lineage leading from the MRCA to the PanINs is illustrated in yellow, while the lineage leading from the MRCA to the PDAC is in green. Clonal passenger mutations were used to estimate progression times, shown for each patient with 90% CIs. Overall (black), the inferred median time elapsed between the common ancestral cell and the birth of the founder clone of a PanIN was 7.1 years (90% CI 3.3–12.2; MRCA to PanIN, n = 12). The median time elapsed between the common ancestral cell and the PDAC was 4.3 years (90% CI 2.3–7.2; MRCA to PDAC, n = 8). These estimates assume a mutation rate of 0.0224 per generation and a time per generation of 4 days (Online Methods).
To assess genetic relatedness using all somatic variants, we quantified Jaccard similarity coefficients between pairs of lesions within each scenario (Figure 2d, Supplementary Table 6). Interestingly, scenario 2 PanIN lesions tended to share fewer somatic variants with the matched PDAC as compared to PanIN lesions in scenario 3 (average Jaccard similarity coefficient of 0.39 vs. 0.50, respectively), although the range of Jaccard similarity coefficients overlapped between the two scenarios (scenario 2 range = 0.10 – 0.57, scenario 3 range = 0.44 – 0.70).
Our phylogenetic analysis also enabled us to estimate the mutational signatures operating in different tumor lineages that led to the PDAC or a coexisting PanIN (Extended Data Figures 6-8). Some signatures were shared between a PDAC and PanIN, while others operated only on a subset of different branches25.
In PIN106 and PIN107, the PDACs and corresponding PanINs contained the same driver gene SNVs/INDELs (scenario 3, Figure 2 and Extended Data Figure 5). In addition to the lost copies of CDKN2A and SMAD4, several unobserved factors might contribute to their morphological differences. First, the PDAC may have accumulated additional genetic events of significance in regions of the genome not assessed by whole exome sequencing. Second, the PDACs may have acquired epigenetic alterations that were not detectable by the approach we used. Third, the microenvironment may have influenced the progression from a PanIN to a PDAC13. Finally, the PanIN lesions in PIN106 and PIN107 may represent cancerization of the ducts (invasive cancer growing back into the duct system and simulating PanINs). We note the PDACs in these two patients showed moderate to poorly differentiated histology, thereby decreasing but not fully eliminating this possibility12.
Modeling progression time of pancreatic cancer evolution
The WES data allow us to estimate the time required for a cell to progress from a non-invasive, neoplastic clone to an invasive pancreatic cancer26 (Methods). We used the number of acquired genetic passenger alterations from a common ancestor to the PanINs and the PDACs, after removing mutations suspected to be drivers or subclonal, to infer the amount of passed time. Because the great majority of the mutations present in any of these lesions are passengers and are not associated with positive or negative growth advantage, these mutations can serve as a molecular clock. Based on previously estimated mutation rates27 and cell division times28 measured in PanINs, we found that the median time elapsed between the common ancestral cell (Figure 3b) and the birth of the founder clone of a PanIN was 7.1 years (90% CI of the median: 3.3 to 12.2 years). Similarly, the median time elapsed between the common ancestral cell and the founder cell of the PDAC itself was 4.3 years (90% CI 2.3 to 7.2 years). Because the PanIN samples are monophyletic in all patients, we cannot estimate how long the primary tumor lineage might have existed as a PanIN. Nonetheless, these intervals are conservative underestimates of the times required to develop neoplasia and radiographically detectable cancer because they do not include any clonal steps prior to the birth of the common ancestral cell nor the time between the birth of the PDAC founder cell and the multiplication of this cell to form a clinically evident mass. A larger patient cohort is required to assess whether or not this length of time is characteristic of the population of individuals with PDAC. When the time required for mass development is taken into account, the data suggest that it takes an average of at least 8.1 years elapsed between the birth of the common ancestral cell and the presence of a clinically evident mass (Methods).
Discussion
Comparison of our results with three recent studies is informative. First, Matsuda et al. found that 77% of patients without clinically evident pancreatic neoplasia actually harbored PanIN-1 lesions when autopsied11. Moreover, Wood et al. found that low grade PanINs (PanIN-1 and PanIN-2) from the same patient generally do not share the same genetic alterations, in contrast to our data which show genetic relationships among high grade PanINs (PanIN-3)9. When taken together with our results, the data suggest that early neoplastic lesions in the pancreas may represent independent events, and that the success of the neoplastic cells in colonizing the ductal system is only achieved with histologic progression and the accrual of additional genetic alterations. Of interest in this regard, the budding off of small clusters of neoplastic epithelial cells into the lumen is one of the pathognomonic morphological features of a high-grade PanIN (PanIN-3)29.
Our data are apparently at odds with the interpretation of a recent study that concluded PDACs do not arise in a gradual fashion14. This conclusion was based on genetic analyses of microdissected PDACs and did not include an analysis of PanINs, nor were models applied to the data to support such a conclusion. As such, it relied on assumptions about the timing of transition from precursor lesion to invasive carcinoma. By contrast, our data are directly based on genomic analyses of the precursor lesions and their corresponding PDACs. Our step-wise model is supported not only by the current data but also by a body of scientific literature17–20,22,26,30,31 that suggests single/short base substitutions that gradually accumulate over many years form the great majority of the genetic alterations responsible for this tumor type. Our findings in no way contradict the observation that multiple chromosome translocations can occur simultaneously (chromothripsis) in a small subset of pancreatic tumors14,31. However, they do buttress the model that PDAC development is a multi-step progression caused by the accumulation of somatic alterations in driver genes, a process that generally spans many years.
It could be argued that the cases we analyzed were unusual in that more than one advanced PanIN was found in each pancreas, and our selection of eight out of ~100 patients potentially introduced an unintended bias in our cohort. However, Matsuda et al. have shown that multiple advanced PanIN lesions are the norm rather than the exception when the entire pancreas is methodically dissected11. Further, the mutations in driver genes and distribution of mutational signatures in this cohort are similar to those previously observed in pancreatic cancers. Finally, genomic analysis of a PDAC arising directly from an adjacent high grade PanIN lesion revealed a gradual genetic progression from PanIN to PDAC8 – similar to our findings for anatomically separate high grade PanIN lesions and their corresponding PDACs.
In summary, we have discovered that pancreatic intraepithelial neoplasia (i.e., PanIN-2 and PanIN-3) need not be a spatially localized lesion; rather, it is a disease that can spread through the entire ductal system. Additional studies—with more patients and a higher density of samples—will be required to determine the frequencies of the evolutionary scenarios we identified and to clarify which features of precursor lesions put them at substantial risk of transformation. Nonetheless, our data suggest that the multiple, apparently discrete PanIN lesions observed in an individual patient often represent a single neoplasm that can spread (contiguously or discontiguously) along the ductal system. This finding provides an explanation for the observation that patients who have had a high grade PanIN or PDAC removed by subtotal pancreatectomy are at high risk for the development of recurrent disease.
Methods
Patient selection.
Human tissues were collected with the approval of the Johns Hopkins Hospital Institutional Review Board (protocols NA_00001584 and NA_00017879) after informed and written consent was obtained, following all relevant ethical regulations. Fresh-frozen samples from eight patients who underwent surgical resection of pancreatic cancer at Johns Hopkins Hospital (Jan 2009-Dec 2011) with pathologic confirmation of pancreatic ductal adenocarcinoma and geographically distinct PanIN-2 or PanIN-3 lesions were selected for study. For inclusion in the study, PDAC, PanIN lesion(s), and normal duodenum tissue were required for each patient. To minimize the possibility of studying cancerization of normal ducts, we only included PanINs in which at least 1.0 cm of uninvolved lobular parenchyma was present between the PanIN and the cancer, or the PanINs were present in a block that contained no cancer.
Processing of tissue samples.
For each tissue sample, multiple sequential 5 μm thick cryosections were mounted on polyethylene naphthalate (PEN) membrane slides and stained with cresyl violet for visualization of histologic features and confirmation of adequate cellularity. Neoplastic epithelium was laser-microdissected using the Leica LMD7 laser microdissection system.
DNA extraction and quantification.
Genomic DNA (gDNA) was extracted from each normal, PanIN, or tumor piece using a standard phenol and chloroform extraction followed by precipitation in ethanol. The gDNA was quantified by LINE assay (i.e. counting long interspersed elements (LINE) using real-time PCR. The LINE forward primer was 5’-AAAGCCGCTCAACTACATGG-3’ and the reverse primer was 5’-TGCTTTGAATGCGTCCCAGAG-3’. The real-time PCR protocol was 50°C for 2 min, 95°C for 2 min, 40 cycles of 94°C for 10 s, 58°C for 15 s, and 70°C for 30 s, 95°C for 15 s, and 60°C for 30 s. The PCR reactions were carried out using Platinum SYBR Green qPCR mastermix (Invitrogen).
Whole exome sequencing and alignment.
Whole exome sequencing (WES) was performed on an Illumina HiSeq 2000 platform for a target coverage of 150X. Upon the completion of WES, the data were analyzed in silico to determine overall quality and coverage. Sequencing reads were aligned to the hg19 human reference genome using BWA32. Read de-duplication, base quality recalibration, and multiple sequence realignment were performed using the Picard Suite and GATK version 3.133,34. SNVs were called using Mutect version 1.1.6 and INDELs were detected using HaplotypeCaller version 2.433,35.
Filtering of whole exome sequencing data.
WES generated a large list of potential mutations, and we evaluated these data to identify high quality mutations while removing sequence artifacts. Each mutant must have been observed with at least 5% variant allele frequency with 20x coverage in at least one neoplastic sample; each mutant must have been observed in less than 2% of the reads (or 3 reads total) of the matched normal sample with 10x coverage. This filtering yielded a total of 2,886 mutations for subsequent analysis (Supplementary Table 2).
Driver gene and mutation analysis.
All somatic variants causing a frameshift deletion, frameshift insertion, in-frame deletion, in-frame insertion, missense, nonsense, nonstop, splice site/region, or a translation start site were considered. If a variant was a missense or nonsense mutation, we required the variant to have a CHASM p-value of ≤ 0.05 and an FDR of ≤ 0.25. In combination with manual review, driver gene mutations were identified if the gene was supported by at least three of the following four methods: 20/20+36, TUSON37, MutSigCV38 (see Table S1 in Ref. 36 for gene list), and a hotspot analysis39. In addition, we also considered genes significantly mutated in large PDAC sequencing studies17,18,20,40. Further, we required that each somatic variant have a variant allele frequency of < 2% in the patient-matched normal tissue as well as any normal tissue from another patient. If a deleterious variant was detected in a driver gene as described above, and was not detected abundantly in any normal tissue, it was considered a driver gene variant.
CNAs.
Allele-specific copy number analysis was performed using FACETS41. Briefly, FACETS performs a complete analysis that includes library size and GC-normalization, and segmentation of total and allele-specific signals, using coverage and genotypes of single nucleotide polymorphisms simultaneously across the exome41. The resulting segments accurately identify points of change in the exome, accounting for diploidy, purity, and average ploidy for each sample. A maximum likelihood approach then assigns each segment with a major and minor integer copy number.
Evolutionary analysis.
We derived phylogenies for each set of samples by using Treeomics 1.7.921. Each phylogeny was rooted at the matched patient’s normal sample and the leaves represented the PanIN or tumor samples. Treeomics employs a Bayesian inference model to account for error-prone sequencing and varying neoplastic cell content to calculate the probability that a specific variant is present or absent. Treeomics infers the global optimal tree based on Mixed Integer Linear programming. For Extended Data Figures 3-5, the CNAs were not directly used to infer phylogenies in order to prevent bias from potential false-negatives or false-positives, given that CNA calls from multiple samples within a patient are particularly sensitive to varying neoplastic cell content and depth of sequencing. Moreover, WES data usually does not capture the exact breakpoints of CNAs, further complicating phylogenetic analysis. Nevertheless, common PDAC driver genes KRAS, MYC, GATA6, and CDK6 were manually reviewed in the CNA data for evidence of gains, while CDKN2A, SMAD4, TP53, MAP2K4, TGFβR2, and ACVR1B were queried for losses. Allelic losses were defined as total copy number (tcn) = 1 or 0, and gains were defined as tcn ≥ 4. Given the CNA status of a given driver gene in each sample, the driver gene with the CNA status was manually placed on the corresponding position edge in the phylogeny (previously derived using SNVs/INDELs). This approach was used with each PDAC driver gene affected by a CNA as defined above.
Our classification of each patient into one of three evolutionary scenarios was based on SNVs/INDELs that affect key driver genes in PDAC (e.g. KRAS G12D). Such alterations represent driver gene variants that are readily interpretable with respect to function as well as position on the phylogenetic tree. Nonetheless, CNAs can also affect driver genes involved in pancreatic cancer (e.g. CDKN2A deletion). If we reclassify the eight patients using both SNVs/INDELs as well as CNAs affecting driver genes (Extended Data Figures 3-5), we find that the evolutionary scenario does not change for six patients. For two patients (PIN106 and PIN107), the scenario changes from scenario 3 to scenario 2, indicating a step-wise progression of PanINs and PDACs for all eight patients. As noted above, the identification and placement of CNAs on a phylogenetic tree remains challenging. Nonetheless, we note that the SNV/INDEL phylogenies represent a minimum number of evolutionary steps: including additional CNAs would either confirm or increase the total number of steps in the evolution of the PDAC.
Structural variant analysis.
We inferred structural variants (SV) using DELLY2 (v.0.7.5) to verify the reconstructed phylogenies42. Since the SVs were called for each sample independently, we merged SVs for which DELLY determined breakpoints differing by at most 250 base-pairs among the samples of each patient. In total, we found 154 distinct SVs in the eight subjects. After a comprehensive manual review of the called SVs, we developed additional criteria to minimize the number of false-positives. We required that each SV has to pass one of the following two filters in at least one sample: 1) (a) SV is supported by at least 3 distinct split reads, (b) the ratio of split reads that support the SV to the total number of split reads at the position of the SV is greater or equal to 0.75, and (c) the number of the SV supporting split reads is greater than the number of split reads in the normal sample; or 2) (d) SV is supported by at least 5 discordantly paired (DP) reads, (e) the ratio of DP reads that support the SV to the total number of DP reads at the position of the SV is greater or equal to 0.25, and (f) the number of the SV supporting DP reads is greater than the number of DP reads in the normal sample. After applying these filters, we obtained 40 SVs (Supplementary Table 4).
To create input files for Treeomics, we used the number of SV supporting split and DP reads as the number of variant reads. We normalized the coverage of SVs such that on average it approximately matched the median coverage of the SNVs (single nucleotide variants). Generally, the inferred phylogenies based on the SVs agreed well with the ones based on SNVs. However, since the significantly lower number of SVs per subject (median 4; range 0–14; Supplementary Table 4), the confidence in the inferred branches was significantly lower than in the phylogenies based on SNVs. For PIN106 (coverage in sample of PanIN-A was extremely low), we inferred a slightly different phylogeny as PanIN-A diverged before the PDAC, likely due to many false-negatives resulting from the extremely low coverage and the therefore difficult detection of SVs in this sample. For PIN108, no SVs were shared across multiple samples and hence there were no parsimony-informative SVs such that a phylogeny could be inferred.
Mutation signatures.
We assessed the presence of previously identified mutational signatures43 in each patient. Our phylogenetic analysis enabled us to estimate the signatures operating at different stages of cancer evolution25. For SNVs acquired along each phylogenetic branch, we estimated the maximum likelihood signature proportions among 30 previously identified trinucleotide signatures44 (see https://github.com/mskcc/mutation-signatures). We quantified the uncertainty in these estimates by performing 100 iterations of bootstrap resampling within each branch followed by signature re-estimation. We ignored branches with 5 or fewer mutations and removed signature 24 because of its similarity to smoking. The maximum likelihood signature estimates and 90% bootstrap confidence intervals for each branch are shown in Extended Data Figures 6-8. We detect signatures 1, 2, 3, and 6, consistent with previous studies43. Additionally, we find evidence for signatures 4 (associated with smoking) and 29 (associated with chewing tobacco). Signatures operating on different branches within a patient were not significantly more similar than those across patients (mean cosine distance similarity 0.62 vs 0.59, p=0.21, one-sided permutation test). We note that signature estimates had large bootstrap uncertainty and the number of patients as well as the number of mutations is limited.
Progression time inference.
We assume that the number of passenger mutations n acquired along a lineage during time T (in cell generations) is Poisson-distributed with rate equal to T times the mutation rate per cell division16:
We assume that a random sample from the population of PanINs or PDACs takes T generations to progress from a previous stage (either most recent common ancestor (MRCA) of all sampled PanINs and PDAC in a patient or the MRCA of the most closely related PanIN to the PDAC) to the founder of a particular PanIN or PDAC, and that the mutational clock time μT is gamma-distributed with hyperparameters shape k and scale θ (k, ) uniform a priori:
In order to infer the joint distribution of (T, k, θ), we use the following sampling strategy. For each sample i, we update T by sampling directly from the gamma posterior:
Using the updated values, we jointly update k, θ by Metropolis-Hastings sampling from the posterior:
where dgamma is the density function for the gamma distribution and is the prior over the hyperparameters (uniform). This setup pools information about the time to progression for each sample toward the population of progression time estimates, with a flexible structure for the overall distribution of times provided by the gamma distribution.
In order to convert the inferred number of generations to absolute time, we follow a previous method26 by multiplying by the average time for cell division. To estimate the division time, we again follow the previous method but instead note that 14% of Stage II PanINs stain positively for Ki-6728. We therefore estimate the generation time of PanIN Stage II cells to be 4 days. The mutation rate μ per generation is 0.0224, calculated for 35 Mb of exome sequencing multiplied by a point mutation rate of per generation27.
To calculate the expected time it takes that the PDAC founding cell grows to a detectable lesion of , we used previously measured PDAC metastasis doubling times of 56 days45 leading to an exponential growth rate of r=0.012 per day. The probability density function for the time an exponential branching process conditioned on survival takes to reach size is approximately given by:
Extended Data
Extended Data Figure 1. Mutation counts and features of samples.
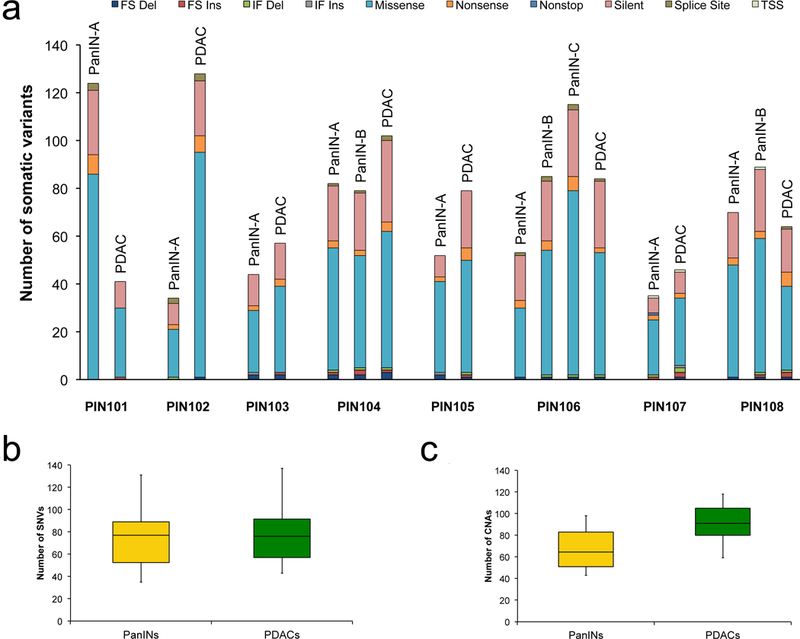
a. Number of somatic mutations detected per sample with clinical features of each patient. The y-axis shows mutation counts while the x-axis is patient ID. FS Del: frameshift deletion, FS Ins: frameshift insertion, IF Del: in-frame deletion, IF Ins: in-frame insertion, TSS: transcription start site. b,c. Box and whisker plots comparing number of somatic SNVs and CNAs between PanINs and PDACs. The PanIN data are in yellow while the PDAC data are shown in green. The x-axes show the two groups, the y-axes indicate the number. The whiskers indicate the minimum and maximum, while the box indicates the quartiles. The total number of independent PanIN lesions is n = 12, while the total number of PDACs is n = 8. b. Plot depicting the SNVs/INDELs between PanINs and PDACs. c. Plot depicting the CNAs between PanINs and PDACs. Panel c contains hisens results only.
Extended Data Figure 2. Allelic copy number alterations (x-axis) across all patient samples (y-axis).
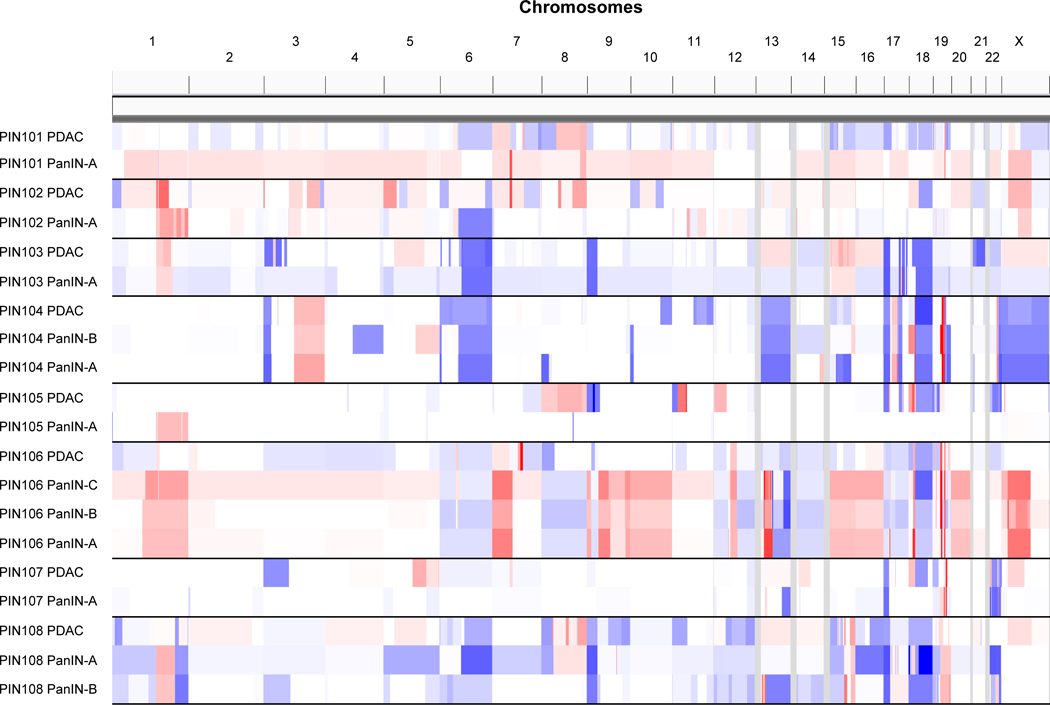
The CNAs were inferred using the FACETS algorithm (Supplementary Table 3, FACETs.purity variants shown in this figure). The scale of CNAs range from putative losses (blue) to putative gains (red).
Extended Data Figure 3. Phylogenetics of PanINs and the matched primary tumor for patients PIN102 and PIN105.
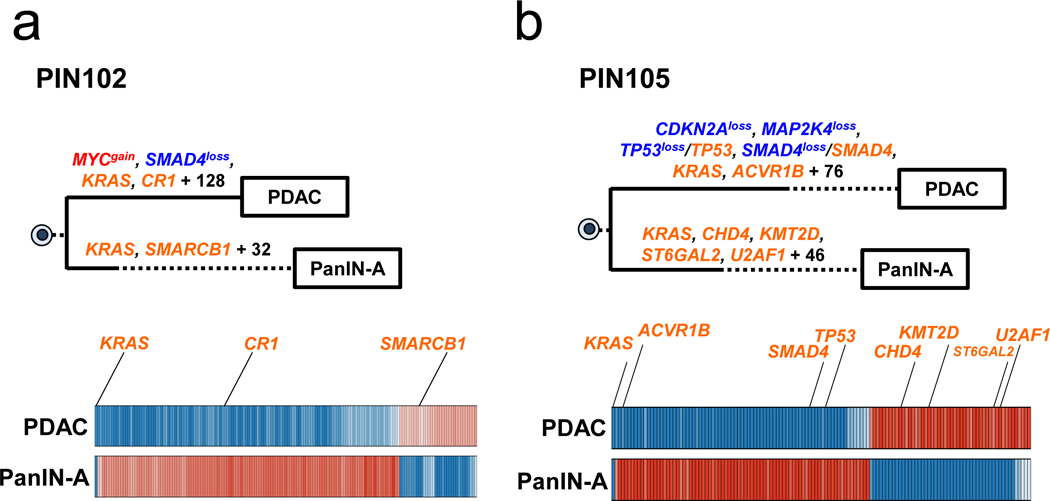
See Supplementary Table 1 for sample identities. The primary tumor is labeled “PDAC” while the PanIN is labeled by a letter. Gene names in orange text are SNVs/INDELs, in blue are copy-number losses, and in red are copy-number gains affecting putative driver genes. The sequencing data for each driver gene variant was manually reviewed to verify phylogenetic position. For each phylogeny, the numbers of acquired mutations are in black font. The branch lengths are proportional to the number of SNVs/INDELs. The dashed line indicates the branch from the germline to the PDAC and PanIN-A. For the Bayesian heat maps, samples are indicated on each row while variants are represented by each column. The color of each tile indicates the probability that the variant is present or absent in the corresponding sample. Dark blue indicates a variant with a >99.9% probability of being present, while dark red indicates a variant with a >99.9% probability of being absent. Light blue and red tiles indicate lower probabilities, and white tiles indicate approximately a 50% probability. a. Phylogenetic tree and Bayesian heat map with each variant for PIN102. b. Phylogenetic tree and Bayesian heat map with each variant for PIN105.
Extended Data Figure 4. Phylogenetics of PanINs and the matched primary tumor for patients PIN101, PIN103, PIN104, and PIN108.
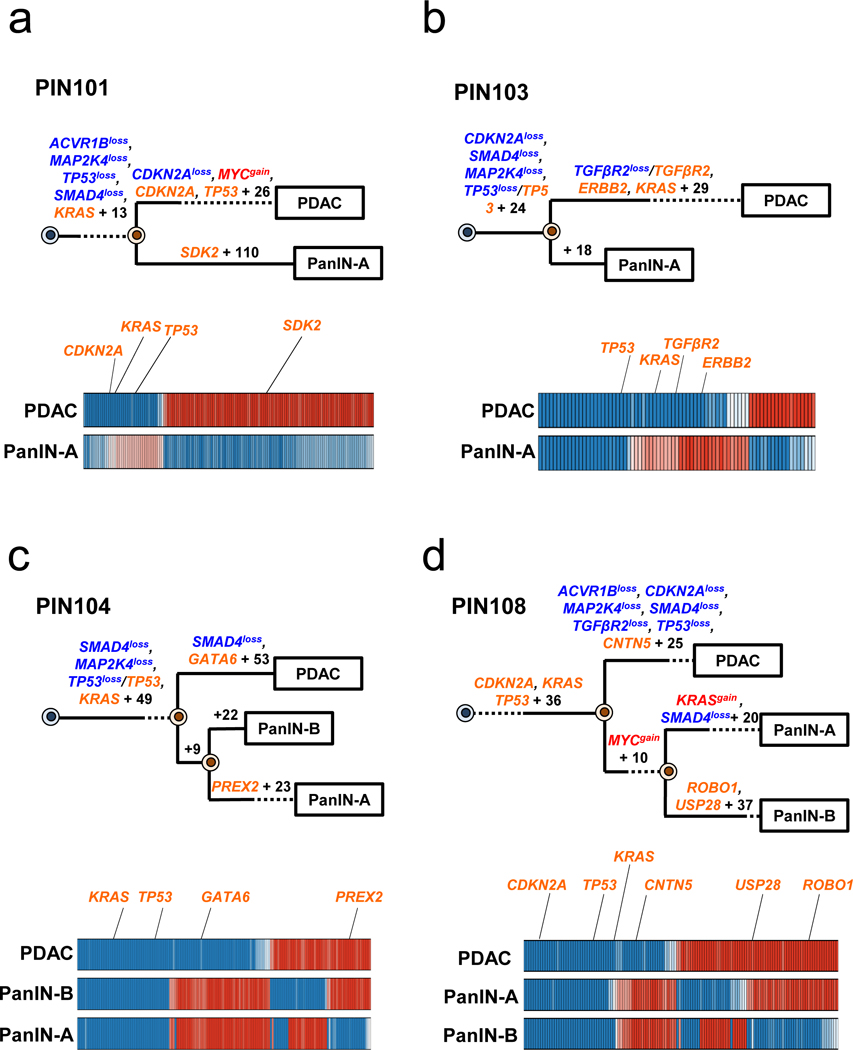
See Supplementary Table 1 for sample identities. The primary tumor is labeled “PDAC” while the PanIN is labeled by a letter. Gene names in orange text are SNVs/INDELs, in blue are copy-number losses, and in red are copy-number gains affecting putative driver genes. The sequencing data for each driver gene variant was manually reviewed to verify phylogenetic position. For each phylogenetic tree, the numbers of acquired mutations are in black font. The branch lengths are proportional to the number of SNVs/INDELs. The dashed lines indicate branches that have been extended to accommodate gene annotation and variant numbers. For the Bayesian heatmaps, samples are indicated on each row while variants are represented by each column. The color of each tile indicates the probability that the variant is present or absent in the corresponding sample. Dark blue indicates a variant with a >99.9% probability of being present, while dark red indicates a variant with a >99.9% probability of being absent. Light blue and red tiles indicate lower probabilities, and white tiles indicate approximately a 50% probability. a. PIN101. In manual review of the sequencing data, a read supporting the presence of the KRAS p.G12D variant was detected in both the PDAC and PanIN-A samples and was thus moved to the trunk of the phylogeny despite the overall low coverage of KRAS in PanIN-A. b. PIN103. c. PIN104. The node leading from the first MRCA to the second MRCA has a confidence value of >99%. d. PIN108. The node leading from the first MRCA to the second MRCA has a confidence value of >99%.
Extended Data Figure 5. Phylogenetics of PanINs and the matched primary tumor for patients PIN106 and PIN107.
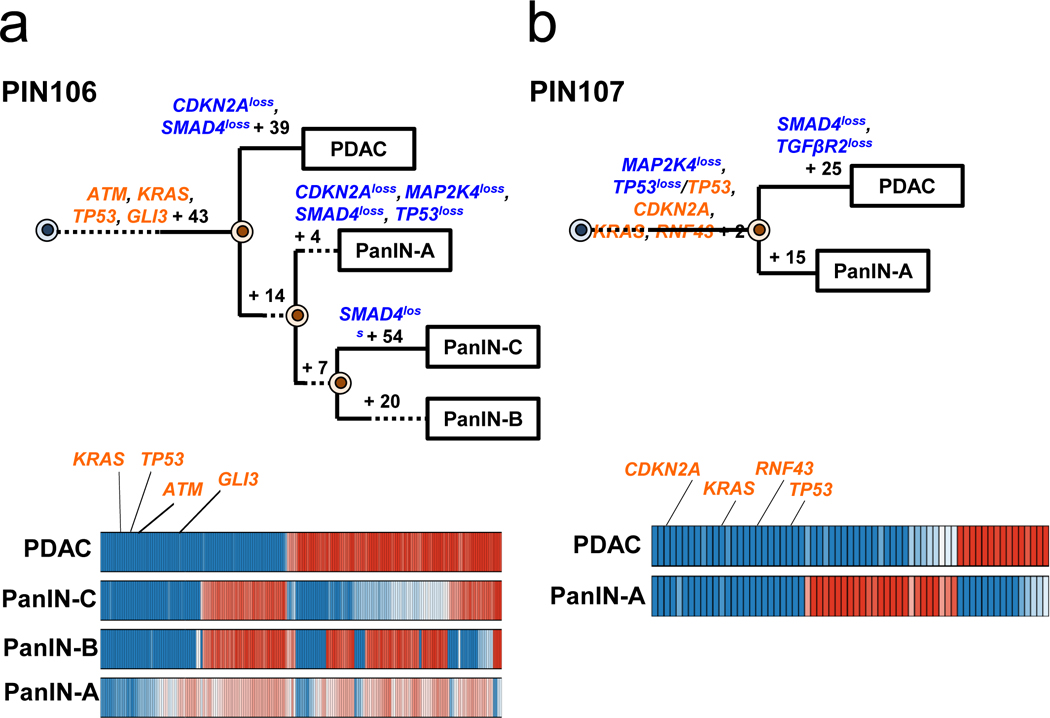
See Supplementary Table 1 for sample identities. The primary tumor is labeled “PDAC” while the PanINs are labeled by letters. Gene names in orange text are SNVs/INDELs, in blue are copy-number losses, and in red are copy-number gains affecting putative driver genes. The sequencing data for each driver gene variant was manually reviewed to verify phylogenetic position. For each phylogeny, the numbers of acquired mutations are in black font. The branch lengths are proportional to the number of SNVs/INDELs. The dashed lines indicate branches that have been extended to accommodate gene annotation and variant numbers. For each Bayesian heat map, samples are indicated on each row while variants are represented by each column. The color of each tile indicates the probability that the variant is present or absent in the corresponding sample. Dark blue indicates a variant with a >99.9% probability of being present, while dark red indicates a variant with a >99.9% probability of being absent. Light blue and red tiles indicate lower probabilities, and white tiles indicate approximately a 50% probability. a. PIN106. The node leading from the first MRCA to the second MRCA has a confidence value of >99% and the node leading from the second MRCA to the third MRCA has a confidence value of 82%. b. PIN107.
Extended Data Figure 6. Average signature abundance across samples.
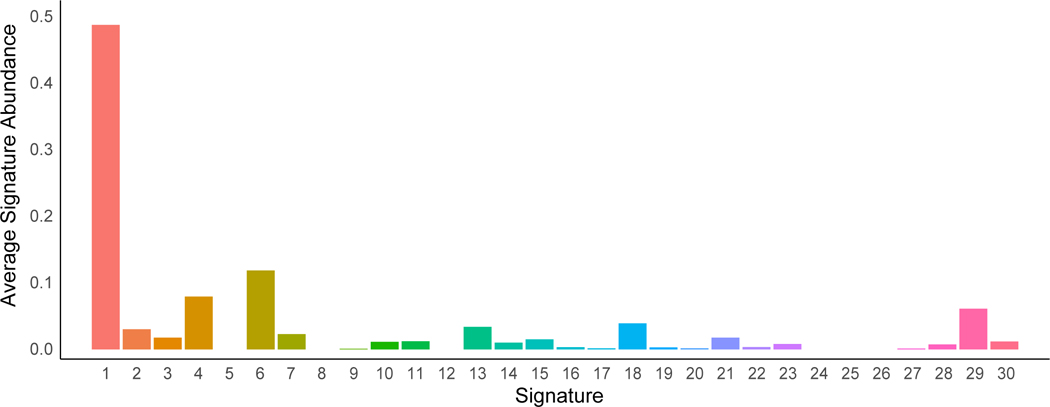
Signature numbers 1–30 from Alexandrov et al.43 are shown on the x-axis with signature abundance averaged across phylogenetic branches shown on the y-axis. Each histogram is colored by signature identity.
Extended Data Figure 7. The proportion of mutational signatures from Alexandrov et al.43 estimated in PIN101-PIN104.
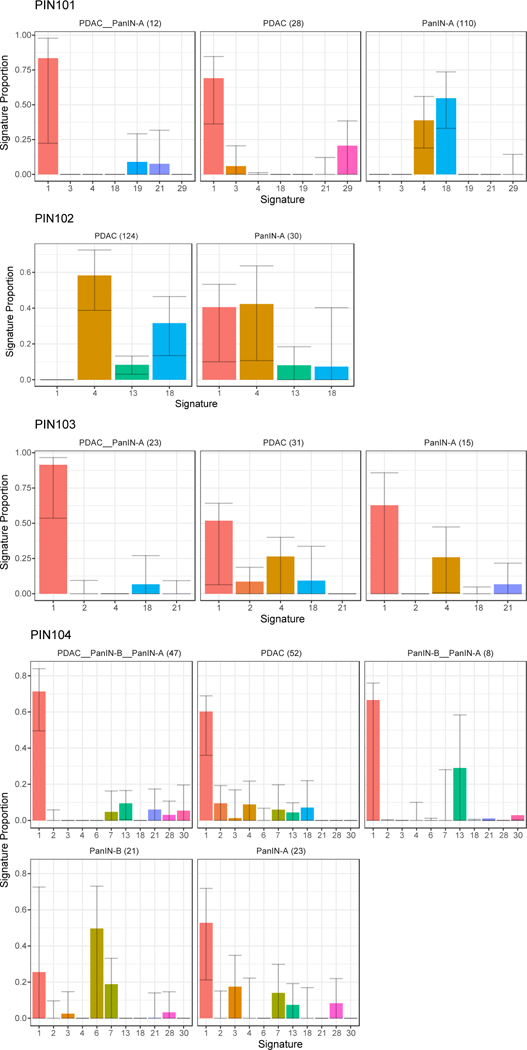
Signatures are shown on the x-axis, with the proportion of each signature shown on the y-axis. Each bar is colored by signature identity. The text on the top of each panel denotes the corresponding phylogenetic branch and the number of mutations acquired along it in parentheses. Error bars depict 90% confidence intervals in the signature proportion estimated by 100 iterations of bootstrap resampling.
Extended Data Figure 8. The proportion of mutational signatures from Alexandrov et al.43 estimated in PIN105-PIN108.
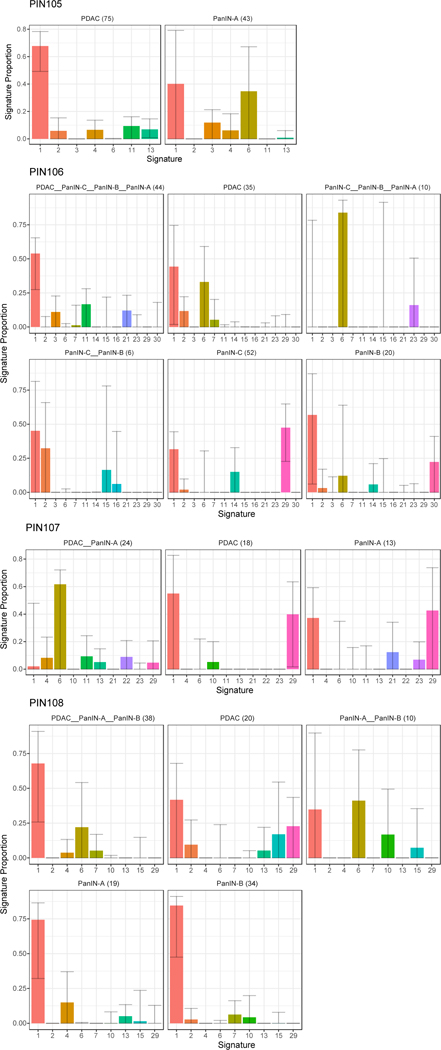
Signatures are shown on the x-axis, with the proportion of each signature shown on the y-axis. Each bar is colored by signature identity. The text on the top of each panel denotes the corresponding phylogenetic branch and the number of mutations acquired along it in parentheses. Error bars depict 90% confidence intervals in the signature proportion estimated by 100 iterations of bootstrap resampling.
Supplementary Material
Acknowledgements:
Supported by the V Foundation for Cancer Research, NIH grants F31 CA180682, 2T32 CA160001–06 and 5T32 CA067751–13, an Erwin Schrödinger fellowship (Austrian Science Fund FWF J-3996), SPORE grant P50 CA062924, the Michael Rolfe Foundation, The Lustgarten Foundation for Cancer Research, the Sol Goldman Center for Pancreatic Cancer Research, The Virginia and D.K. Ludwig Fund for Cancer Research, and Dennis Troper and Susan Wojcicki.
Footnotes
The authors declare no competing financial interests.
Data availability.
Sequence data have been deposited at the European Genomephenome Archive (EGA), which is hosted by the European Bioinformatics Institute (EBI) and the Centre for Genomic Regulation (CRG), under accession number EGAS00001002778. Further information about EGA can be found at https://ega-archive.org and “The European Genome-phenome Archive of human data consented for biomedical research” (http://www.nature.com/ng/journal/v47/n7/full/ng.3312.html). Source data are provided for Figure 3, panel b, and Extended Data Figures 1, 7 and 8. All other relevant data are included within the manuscript or are available upon request from the corresponding author (C.I-D.).
References
- 1.Vogelstein B et al. Cancer genome landscapes. Science 339, 1546–58 (2013). [DOI] [PMC free article] [PubMed] [Google Scholar]
- 2.Vogelstein B & Kinzler KW The Path to Cancer --Three Strikes and You’re Out. N. Engl. J. Med. 373, 1895–8 (2015). [DOI] [PubMed] [Google Scholar]
- 3.Basturk O et al. A Revised Classification System and Recommendations From the Baltimore Consensus Meeting for Neoplastic Precursor Lesions in the Pancreas. Am. J. Surg. Pathol. 39, 1730–1741 (2015). [DOI] [PMC free article] [PubMed] [Google Scholar]
- 4.Hruban RH, Goggins M, Parsons J & Kern SE Progression model for pancreatic cancer. Clin. cancer Res. 6, 2969–72 (2000). [PubMed] [Google Scholar]
- 5.van Heek NT et al. Telomere shortening is nearly universal in pancreatic intraepithelial neoplasia. Am. J. Pathol. 161, 1541–7 (2002). [DOI] [PMC free article] [PubMed] [Google Scholar]
- 6.Kanda M et al. Presence of somatic mutations in most early-stage pancreatic intraepithelial neoplasia. Gastroenterology 142, 730–733.e9 (2012). [DOI] [PMC free article] [PubMed] [Google Scholar]
- 7.Makohon-Moore A & Iacobuzio-Donahue CA Pancreatic cancer biology and genetics from an evolutionary perspective. Nat. Rev. Cancer 16, 553–65 (2016). [DOI] [PMC free article] [PubMed] [Google Scholar]
- 8.Murphy SJ et al. Genetic alterations associated with progression from pancreatic intraepithelial neoplasia to invasive pancreatic tumor. Gastroenterology 145, 1098–1109.e1 (2013). [DOI] [PMC free article] [PubMed] [Google Scholar]
- 9.Hosoda W et al. Genetic analyses of isolated high-grade pancreatic intraepithelial neoplasia (HG-PanIN) reveal paucity of alterations in TP53 and SMAD4. J. Pathol. 242, 16–23 (2017). [DOI] [PMC free article] [PubMed] [Google Scholar]
- 10.Fearon ER & Vogelstein B A genetic model for colorectal tumorigenesis. Cell 61, 759–67 (1990). [DOI] [PubMed] [Google Scholar]
- 11.Matsuda Y et al. The Prevalence and Clinicopathological Characteristics of High-Grade Pancreatic Intraepithelial Neoplasia. Pancreas 46, 658–664 (2017). [DOI] [PubMed] [Google Scholar]
- 12.Yamasaki S, Suda K, Nobukawa B & Sonoue H Intraductal spread of pancreatic cancer. Clinicopathologic study of 54 pancreatectomized patients. Pancreatology 2, 407–12 (2002). [DOI] [PubMed] [Google Scholar]
- 13.Kleeff J et al. Pancreatic cancer. Nat. Rev. Dis. Prim. 2, 16022 (2016). [DOI] [PubMed] [Google Scholar]
- 14.Notta F et al. A renewed model of pancreatic cancer evolution based on genomic rearrangement patterns. Nature 538, 378–382 (2016). [DOI] [PMC free article] [PubMed] [Google Scholar]
- 15.Roberts NJ et al. Whole Genome Sequencing Defines the Genetic Heterogeneity of Familial Pancreatic Cancer. Cancer Discov. 6, 166–175 (2016). [DOI] [PMC free article] [PubMed] [Google Scholar]
- 16.Jones S et al. Comparative lesion sequencing provides insights into tumor evolution. Proc. Natl. Acad. Sci. U. S. A. 105, 4283–8 (2008). [DOI] [PMC free article] [PubMed] [Google Scholar]
- 17.Biankin AV et al. Pancreatic cancer genomes reveal aberrations in axon guidance pathway genes. Nature 491, 399–405 (2012). [DOI] [PMC free article] [PubMed] [Google Scholar]
- 18.Waddell N et al. Whole genomes redefine the mutational landscape of pancreatic cancer. Nature 518, 495–501 (2015). [DOI] [PMC free article] [PubMed] [Google Scholar]
- 19.Witkiewicz AK et al. Whole-exome sequencing of pancreatic cancer defines genetic diversity and therapeutic targets. Nat. Commun. 6, 6744 (2015). [DOI] [PMC free article] [PubMed] [Google Scholar]
- 20.Bailey P et al. Genomic analyses identify molecular subtypes of pancreatic cancer. Nature 531, 47–52 (2016). [DOI] [PubMed] [Google Scholar]
- 21.Reiter JG et al. Reconstructing metastatic seeding patterns of human cancers. Nat. Commun. 8, 14114 (2017). [DOI] [PMC free article] [PubMed] [Google Scholar]
- 22.Makohon-Moore AP et al. Limited heterogeneity of known driver gene mutations among the metastases of individual patients with pancreatic cancer. Nat. Genet. 49, 358–366 (2017). [DOI] [PMC free article] [PubMed] [Google Scholar]
- 23.Sanli O et al. Bladder cancer. Nat. Rev. Dis. Prim. 3, 17022 (2017). [DOI] [PubMed] [Google Scholar]
- 24.Pea A et al. Targeted DNA Sequencing Reveals Patterns of Local Progression in the Pancreatic Remnant Following Resection of Intraductal Papillary Mucinous Neoplasm (IPMN) of the Pancreas. Ann. Surg. 266, 133–141 (2017). [DOI] [PMC free article] [PubMed] [Google Scholar]
- 25.Roerink SF et al. Intra-tumour diversification in colorectal cancer at the single-cell level. Nature 556, 457–462 (2018). [DOI] [PubMed] [Google Scholar]
- 26.Yachida S et al. Distant metastasis occurs late during the genetic evolution of pancreatic cancer. Nature 467, 1114–7 (2010). [DOI] [PMC free article] [PubMed] [Google Scholar]
- 27.Tomasetti C, Vogelstein B & Parmigiani G Half or more of the somatic mutations in cancers of self-renewing tissues originate prior to tumor initiation. Proc. Natl. Acad. Sci. U. S. A. 110, 1999–2004 (2013). [DOI] [PMC free article] [PubMed] [Google Scholar]
- 28.Klein WM, Hruban RH, Klein-Szanto AJP & Wilentz RE Direct Correlation between Proliferative Activity and Dysplasia in Pancreatic Intraepithelial Neoplasia (PanIN): Additional Evidence for a Recently Proposed Model of Progression. Mod. Pathol. 15, 441–447 (2002). [DOI] [PubMed] [Google Scholar]
- 29.Hruban RH et al. An illustrated consensus on the classification of pancreatic intraepithelial neoplasia and intraductal papillary mucinous neoplasms. Am. J. Surg. Pathol. 28, 977–87 (2004). [DOI] [PubMed] [Google Scholar]
- 30.Jones S et al. Core signaling pathways in human pancreatic cancers revealed by global genomic analyses. Science 321, 1801–6 (2008). [DOI] [PMC free article] [PubMed] [Google Scholar]
- 31.Reiter JG & Iacobuzio-Donahue CA Pancreatic cancer: Pancreatic carcinogenesis — several small steps or one giant leap? Nat. Rev. Gastroenterol. Hepatol. 14, 7–8 (2016). [DOI] [PubMed] [Google Scholar]
- 32.Li H & Durbin R Fast and accurate short read alignment with Burrows-Wheeler transform. Bioinformatics 25, 1754–1760 (2009). [DOI] [PMC free article] [PubMed] [Google Scholar]
- 33.DePristo MA et al. A framework for variation discovery and genotyping using next-generation DNA sequencing data. Nat. Genet. 43, 491–498 (2011). [DOI] [PMC free article] [PubMed] [Google Scholar]
- 34.Mose LE, Wilkerson MD, Hayes DN, Perou CM & Parker JS ABRA: improved coding indel detection via assembly-based realignment. Bioinformatics 30, 2813–5 (2014). [DOI] [PMC free article] [PubMed] [Google Scholar]
- 35.Cibulskis K et al. Sensitive detection of somatic point mutations in impure and heterogeneous cancer samples. Nat. Biotechnol. 31, 213–219 (2013). [DOI] [PMC free article] [PubMed] [Google Scholar]
- 36.Tokheim CJ, Papadopoulos N, Kinzler KW, Vogelstein B & Karchin R Evaluating the evaluation of cancer driver genes. Proc. Natl. Acad. Sci. U. S. A. 113, 14330–14335 (2016). [DOI] [PMC free article] [PubMed] [Google Scholar]
- 37.Davoli T et al. Cumulative haploinsufficiency and triplosensitivity drive aneuploidy patterns and shape the cancer genome. Cell 155, 948–62 (2013). [DOI] [PMC free article] [PubMed] [Google Scholar]
- 38.Lawrence MS et al. Mutational heterogeneity in cancer and the search for new cancer-associated genes. Nature 499, 214–8 (2013). [DOI] [PMC free article] [PubMed] [Google Scholar]
- 39.Chang MT et al. Identifying recurrent mutations in cancer reveals widespread lineage diversity and mutational specificity. Nat. Biotechnol. 34, 155–63 (2016). [DOI] [PMC free article] [PubMed] [Google Scholar]
- 40.Raphael BJ et al. Integrated Genomic Characterization of Pancreatic Ductal Adenocarcinoma. Cancer Cell 32, 185–203.e13 (2017). [DOI] [PMC free article] [PubMed] [Google Scholar]
- 41.Shen R & Seshan VE FACETS: allele-specific copy number and clonal heterogeneity analysis tool for high-throughput DNA sequencing. Nucleic Acids Res. 44, e131–e131 (2016). [DOI] [PMC free article] [PubMed] [Google Scholar]
- 42.Rausch T et al. DELLY: structural variant discovery by integrated paired-end and split-read analysis. Bioinformatics 28, i333–i339 (2012). [DOI] [PMC free article] [PubMed] [Google Scholar]
- 43.Alexandrov LB et al. Signatures of mutational processes in human cancer. Nature 500, 415–21 (2013). [DOI] [PMC free article] [PubMed] [Google Scholar]
- 44.Alexandrov LB, Nik-Zainal S, Wedge DC, Campbell PJ & Stratton MR Deciphering Signatures of Mutational Processes Operative in Human Cancer. Cell Rep. 3, 246–259 (2013). [DOI] [PMC free article] [PubMed] [Google Scholar]
- 45.Amikura K, Kobari M & Matsuno S The time of occurrence of liver metastasis in carcinoma of the pancreas. Int. J. Pancreatol. 17, 139–46 (1995). [DOI] [PubMed] [Google Scholar]
- 46.Durrett R in Branching Process Models of Cancer 1–63 (Springer International Publishing, 2015). [Google Scholar]
Associated Data
This section collects any data citations, data availability statements, or supplementary materials included in this article.


