Abstract
In multi-cellular organisms, cells communicate with each other utilizing chemical messengers. For many of these messenger molecules, the membrane is an insurmountable barrier. Yet, they act by binding to surface proteins often triggering a cascade of reactions inside the cell. Accordingly, studying ligand-receptor interactions at the cellular surface is key to understanding important aspects of membrane biology. However, despite a multitude of approaches to study membrane features, there is a need for developing techniques that can measure ligand binding with high temporal resolution and on a single cellular level. We recently developed a label-free approach to study ligand binding in real time. This methodology capitalizes on changes of the membrane’s surface potential induced by the adsorption of a charged ligand. The resulting apparent alteration of membrane capacitance is measurable by capacitance recordings. Herein, we describe the implementation of the same using recordings obtained from HEK293 cells stably expressing the human serotonin transporter (SERT), which were challenged with the inhibitor cocaine.
Keywords: Surface charge, Ligand binding, Membrane capacitance, Serotonin transporter, Whole-cell patch-clamp technique
Background
Ligand binding to surface proteins is a key event in cell-to-cell signaling. It is also the initial step in active or facilitated transport of impermeable solutes through the membrane. Most methods to measure ligand binding rely on the use of radiolabeled or fluorescence-labeled surrogates. These methods are well established and time-tested having helped to gain valuable insights into many biological processes. However, they also have known shortcomings. These include (i) a small sampling rate (i.e., 0.2 s-1) (ii) distorted binding properties of the ligand by virtue of the necessary label (iii) non-physiological experimental conditions, implemented to ensure success of the method and (iv) the difficulty of tracking ligand binding on single cellular level. To remedy these shortcomings, we have recently developed a label-free approach to study ligand binding in real-time that can be applied to single cells ( Burtscher et al., 2018 ). This approach relies on the detection of changes in the apparent membrane capacitance that result from ligand binding to membrane proteins. These changes are contingent on the adsorption of a charged ligand, which alters the outer surface potential and, as a consequence, the voltage difference between the inner and outer surface of the membrane. Because the membrane behaves as a capacitor, ligand-induced changes in the membrane’s voltage are detectable by capacitance recordings.
Materials and Reagents
Pipette tips
Silicone tube (Diameter: outer: 2 mm) (VWR, catalog number: KART3920)
1 ml plastic syringe (Braun, catalog number: 9166017V-02)
Borosilicate glass capillaries (Diameter: outer: 1.5 mm, inner: 0.86 mm) (Science Products, catalog number: GB150-8P)
Cell culture dish 35 x 10 mm (SARSTEDT, catalog number: 83.3900)
HEK293 cells (Public Health of England: European Collection of Authenticated Cell Cultures, catalog number: 85120602)
GFP-SERT-pcDNA4-TO plasmid (cloned as described in Hilber et al., 2005 )
Sylgard 184 Kit (Dowsil/Dow Corning, catalog number: 1024001)
Potassium D-gluconate, C6H11KO7 (Sigma-Aldrich, catalog number: G4500)
Sodium chloride, NaCl (Sigma-Aldrich, catalog number: S7653)
Calcium chloride dihydrate, CaCl2·2H2O (Sigma-Aldrich, catalog number: 21097)
Magnesium chloride hexahydrate, MgCl2·6H2O (Sigma-Aldrich, catalog number: 63064)
EGTA, Ethylene glycol-bis (2-aminoethylether)-N,N,N′,N′-tetraacetic acid, C14H24N2O10 (Sigma-Aldrich, catalog number: E0396)
HEPES, 4-(2-Hydroxyethyl) piperazine-1-ethanesulfonic acid, C8H18N2O4S (Sigma-Aldrich, catalog number: H3375)
EDTA, Ethylenediaminetetraacetic acid, (HO2CCH2)2NCH2CH2N(CH2CO2H)2 (Sigma-Aldrich, catalog number: R1021)
Cocaine, C17H21NO4 HCl (Sigma-Aldrich, catalog number: 53-21-4)
Potassium chloride, KCl (Sigma-Aldrich, catalog number: P9333)
D-(+)-Glucose Monohydrate, C6H12O6·H2O (Sigma-Aldrich, catalog number: G7528)
Sodium phosphate dibasic dihydrate, Na2HPO4·2H2O (Sigma-Aldrich, catalog number: 71643)
Monopotassium phosphate, KH2PO4 (Sigma-Aldrich, catalog number: PHR1330)
Poly-D-lysine hydrobromide (PDL) (Sigma-Aldrich, catalog number: P1149)
Dulbecco’s Modified Eagle’s Medium, DMEM (Fisher Scientific, catalog number: 11965-084)
Fetal bovine serum, FBS (Biowest, catalog number: S1810)
Zeocin, C55H86N20O21S2 (InvivoGen, catalog number: ant-zn-1)
Blasticidin, C17H26N8O5 (InvivoGen, catalog number: ant-bl-1)
Tetracycline (Sigma-Aldrich, catalog number: 87128)
NaOH (Sigma-Aldrich, catalog number: S8045)
Tergazyme (Sigma-Aldrich, catalog number: Z273287-1EA)
Cell Culture maintenance medium (stored at 4 °C) (see Recipes)
Phosphate-buffered saline (PBS)/EDTA (stored at 4 °C) (see Recipes)
Intracellular solution (stored at 4 °C) (see Recipes)
Extracellular solution (stored at 4 °C) (see Recipes)
Equipment
10 MΩ resistor (any brand)
Hot-air gun (any brand)
Micropipette Puller P-97 (Sutter Instruments, USA)
4 tube or 8 tube ALA perfusion manifold (ALA Scientific Instruments, USA)
Octaflow perfusion system (ALA Scientific Instruments, USA)
Axopatch 200B amplifier (Molecular Devices, USA)
Digidata 1440 digitizer (Molecular Devices, USA)
Two personal computers running Windows 7 (one for data acquisition and one for controlling the perfusion system)
Motorized micromanipulator for the patch electrode (PatchStar, Scientifica, UK)
Manual micromanipulator for the perfusion manifold (Luigs & Neumann, Germany)
Inverted microscope (Axiovert 135M, Zeiss, Germany)
Software
pCLAMP 10.2 Electrophysiology Data Acquisition and Analysis Software (Molecular Devices, USA)
MAT-MECAS
Matlab 2015 (MathWorks, USA)
Procedure
-
PDL-coating of dishes
Put 1 ml PDL (1 mgml-1 dissolved in MilliQ-water) per 35 mm dish and incubate it for 20 min at room temperature.
Rinse the dish twice with sterile MilliQ-water.
-
Store dried dishes at 4 °C (recommended storage duration: ≤ 5 months).
Note: PDL-coating is required for the cells to stay attached during rapid solution exchange in the experiment.
-
Cell culture
Culture Tet-on HEK293 cells, stably transfected with the GFP-SERT-pcDNA4-TO plasmid ( Hilber et al., 2005 ), in maintenance medium at 37 °C, 5% CO2. Use 5 ml for a 25 cm2 dish.
Split cells, at 80% confluency. Detach them with PBS/EDTA and spin them down at 80 × g for 5 min. Resuspend the pellet in a small volume of maintenance medium (e.g., 200 μl for a 25 cm2 dish).
Induce the expression of GFP-SERT in Tet-on HEK293 cells with tetracycline, twenty-four hours prior to the experiment. Plate cells at low density (2,000-4,000 cells ml-1) onto PDL-coated 35 mm dishes containing 2 ml maintenance medium supplied with 1 μgml-1 tetracycline.
-
Cleaning of the perfusion system and positioning of the perfusion manifold tip
Clean the Octaflow perfusion system and manifold using 1% tergazyme (10 g tergazyme dissolved in 1 L MilliQ-water; prewarmed to 37 °C, incubation time 30 min) followed by 7-10 wash steps with MilliQ-water.
Fill the Octaflow tanks with extracellular solution and connect them with the manifold tubing. Ensure that no air bubbles are trapped within the tubing.
-
For the positioning of the manifold tip, immerse the manifold tip into deionized water and start applying extracellular solution using a pressure of 400 mmHg.
Note: Due to the different refractive indexes of the deionized water and the extracellular solution, the liquid flow is traceable.
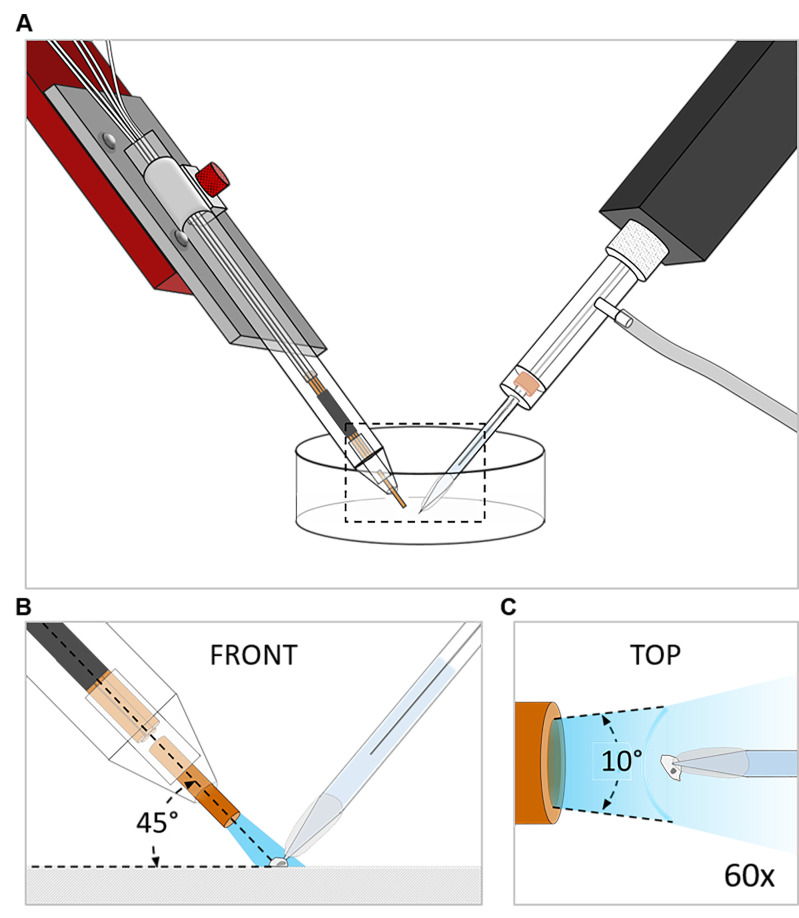
Position the manifold tip at a 45° angle. Ensure uniform, rapid application of solution to the cell (Figures 1A and 1B).
Check the application speed of each tank by the application flow angle that should be in the range of 10°-20°. At larger angles the solution exchange rate drops below 10 s-1. Increase the application pressure if required (Figure 1C).
-
Fabrication of patch pipettes
Pull patch pipettes from borosilicate glass (Rae and Lewis, 2004; Oesterle, 2018). The desirable range of resistances is between 2 and 5 MΩ when using the intracellular solution specified in the recipe section. For measurements of the pipette resistance, see DeFelice, 1997.
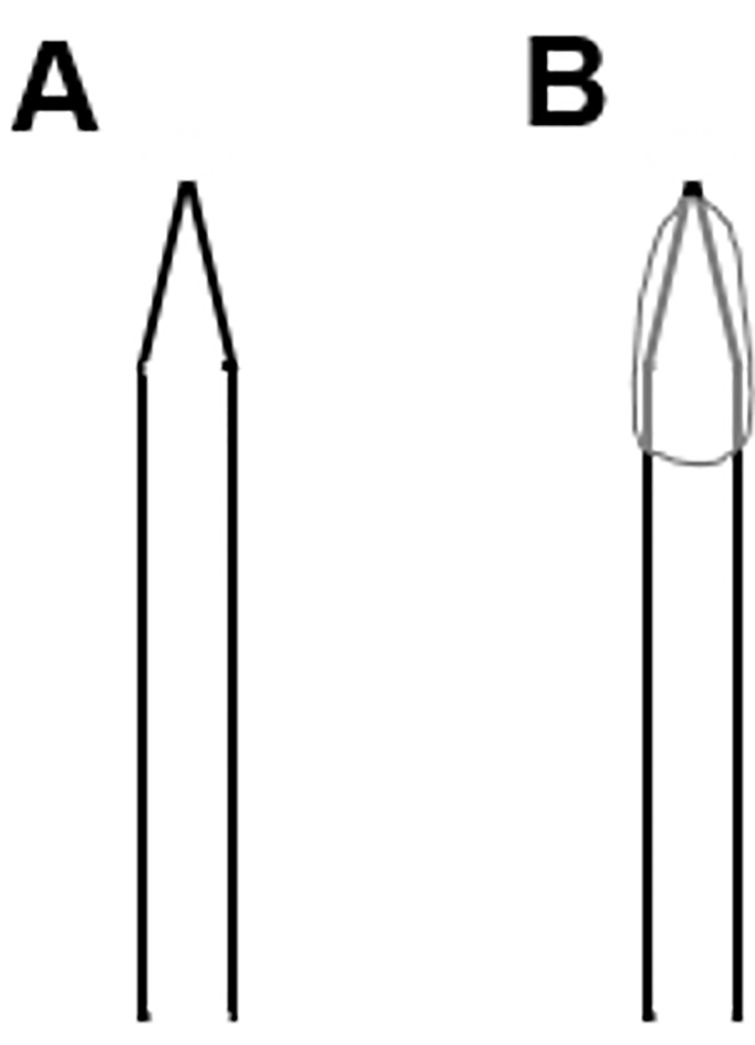
Coat the tip of a patch pipette with Sylgard to reduce the stray capacitance (CS) of the pipette and fluctuations thereof (Figure 2). We applied Sylgard onto the patch pipette tip, utilizing a standard 200 μl plastic pipette tip. To accelerate hardening of Slygard, we used a hot-air gun. Fluctuations of CS will interfere with the measurements by introducing artifacts in amplitude changes in membrane capacitance (CM).
-
Recording-protocols
Amplifier settings: low-pass filter frequency = 10 kHz, gain = 2, scaling factor = 0.1.
-
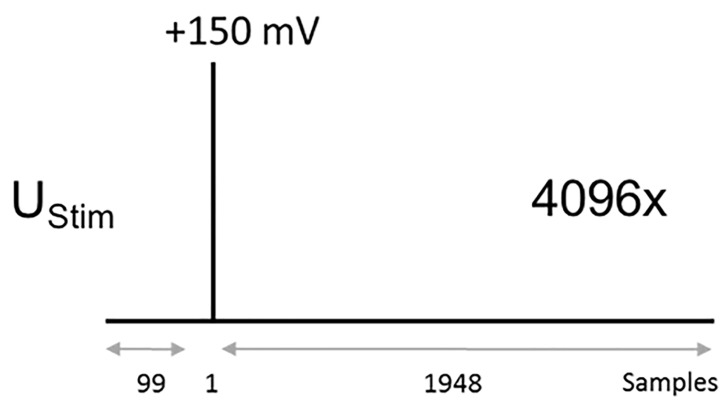
Protocol to measure the impulse response function: 10 μs (one sample long) step to + 150 mV from a holding potential of 0 mV. The pulse should be positioned at the sample number 100. (sweep duration: 20 ms, sweep number: 4,096, sampling frequency: 100 kHz, Figure 3).
Protocol specifications for the current impulse response:
Stimulus pulse (UStim): 150 mV, 10 μs, 100th sample
Samples per sweep: 2,048
Number of sweeps: 4,096
Sampling frequency: 100 kHz
-
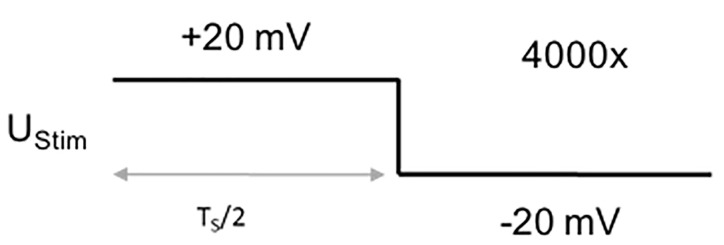
Protocol to measure the stray capacitance of the pipette and the membrane patch beneath it: 2.5 ms step from +20 mV to -20 mV (sweep duration: 5 ms, sweep number: 4,000, sampling frequency: 100 kHz, Figure 4).
Protocol specifications for recording of the residual stray capacitance:
UStim: 20 mV
TS: 5 ms
Number of sweeps: 4,000
Sampling frequency: 100 kHz
-
Protocol to measure the membrane capacitance of the whole cell: 2.5 ms step from + 40 mV to -40 mV (sweep duration: 5 ms, sweep number: 10,000, sampling frequency: 100 kHz, Figure 5).
Protocol specifications for recording of membrane parameters:
UStim: 40 mV
TS: 5 ms
Number of sweeps: 10,000
Sampling frequency: 100 kHz
Note: The time constant of the transient current elicited by a square pulse depends on the cell size. Set the duration of the voltage pulse such that the pulse is sufficiently long to charge the cell membrane completely (i.e., 5 times Tau). This is 2-5 ms for most HEK293 cells. Note also that the resolution of CM can be improved by increasing the amplitude of the stimulating voltage pulse (UStim).
-
-
Measuring the impulse response function of the recording apparatus
The impulse response must be re-recorded, if changes to the apparatus are made that affect the signal path, the sampling frequency or the corner frequency of the low-pass filter (i.e., replacement of the amplifier, digitizer (Digidata 1440) (BNC-cables etc.).
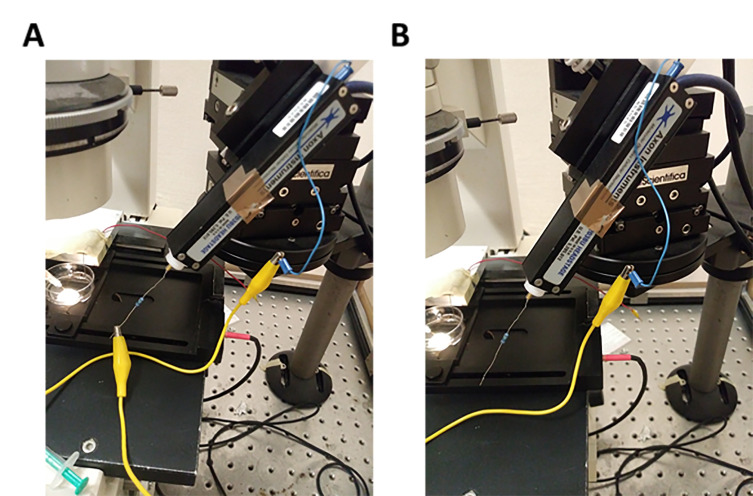
Mount a 10 MΩ resistor between the signal input and the ground input of the head-stage. Run the protocol to measure the impulse response function (Step E1, Figure 6A).
Record the stray capacitance of the 10 MΩ resistor. For this, disconnect the 10 MΩ resistor from the ground input while keeping the resistor connected to the signal input of the head-stage and rerun the protocol to measure the impulse response function (Step E1, Figure 6B).
-
Patch clamp recordings (for a detailed description see DeFelice, 1997)
Fill the patch pipette with intracellular solution and mount it onto the electrode holder.
Immerse the patch electrode into the bath solution while applying positive pressure to the electrode holder. We apply pressure to the electrode holder by using a 1 ml plastic syringe, which is connected to the electrode holder via a silicone tube. The positive pressure produced by attaching the 1 ml syringe to the closed tubing system is sufficient to cause liquid outflow from the pipette tip. This prevents clogging of the pipette tip.
Remove the pipette voltage offset by using the pipette offset potentiometer on the patch-clamp amplifier.
Formation of giga-seal: Lower the pipette onto the cell until the pipette resistance increases by 10%. Apply negative pressure to the electrode holder. Proceed with the next step when the seal resistance is > 1 GΩ.
-
Cancel the pipette capacitance by utilizing the fast capacitance compensation circuitry of the patch-clamp amplifier.
Note: Once adjusted, do not change it during the experiment.
In most cases, it is not possible to fully compensate the stray capacitance with the compensation circuitry. We therefore recommend recording the remaining stray capacitance of the pipette and the membrane patch beneath it, using the protocol described in Step E2. The recorded currents can later be subtracted from the membrane currents obtained with the protocol to measure the membrane capacitance of the whole cell (Step E3).
Open the cell by applying a short pulse of negative pressure to the electrode holder. Wait two minutes after establishing the whole-cell configuration to allow for the equilibration of the cytosolic solution with the pipette solution.
Record the currents elicited by the protocol to measure whole cell membrane capacitance (Step E3). Apply the ligand with the perfusion device. Loop the recording protocol if the experiment exceeds the duration of 50 s.
Figure 1. Scheme depicting the position of the manifold-tip with respect to the recorded cell.
A. Overview. Dashed box indicates magnified region depicted in B and C. B. Front view: The manifold-tip is positioned in a 45° angle above the cell. C. Top view (60x magnification): The flow angle has to be in the range between 10° and 20°. The application pressure must be increased, if flow angles greater than 20° are observed.
Figure 2. Scheme of an (A) uncoated and (B) Sylgard-coated glass pipette.
Figure 3. Voltage protocol for recording the current impulse response.
Figure 4. Voltage protocol for recording the residual stray capacitance.
Figure 5. Voltage protocol for recording the membrane parameters.
Figure 6. Illustration of how to record the impulse response function.
Data analysis
MatMecas is a Matlab-based software, which is used to estimate the three parameters of the minimal equivalent circuit of a cell. They are: CM–membrane capacitance, RM–membrane resistance and RA–access resistance (Figure 7A). For these estimations, the recorded currents elicited by a train of bipolar square-wave voltage pulses are de-convolved with the impulse response function of the recording apparatus. This procedure reconstructs the initial segment of the current decay, which is distorted by intrinsic filters in the circuitry of the amplifier (Figure 7B). The reconstructed decays are then fit to a monoexponential function (Figure 7C). The obtained fit parameters (IP, IS and τ) are used to estimate circuit parameters of the minimal equivalent circuit by utilizing the equations shown in Figure 7D. The detailed description of the analysis can be found in (Hotka and Zahradnik, 2017). MatMecas reads currents stored in axon binary files (abf) as well as txt files.
Figure 7. Estimating the circuit parameters CM, RM and RA with MatMecas software.
A. Minimal equivalent circuit: UM is the voltage difference between the intra- and extracellular bulk solution. IM is the current applied by the amplifier, RA is the access resistance, RM is the membrane resistance, CM is the membrane capacitance. B. Original (grey trace) and reconstituted (black trace) current response to a voltage step from -40 to +40 mV (see upper panel). UStim is the voltage step (80 mV) of the bipolar pulse. UHold is the holding potential. C. Monoexponential fit (red line) to the reconstituted current decay (black line). The fit parameters are IP (peak current amplitude), IS (steady state current) and the τ (time constant). These parameters allow for calculating the circuit parameters of the equivalent circuit by using the equations in D.
-
Install MatMecas
Download all files into a working directory (Supplementary file). MatMecas is a standalone application. For its proper function the MATLAB Compiler Runtime (MCR) version 8 (R2015a) 32-bit must be installed on your computer (see http://www.mathworks.com/products/compiler/mcr/).
The installer application will take the user through the installation process and will download all the necessary files including MCR. Thus, it is necessary to install MatMecas on a computer connected to the internet. To ensure availability of the required permissions we recommend running MatMecas and the installer app as an administrator.
-
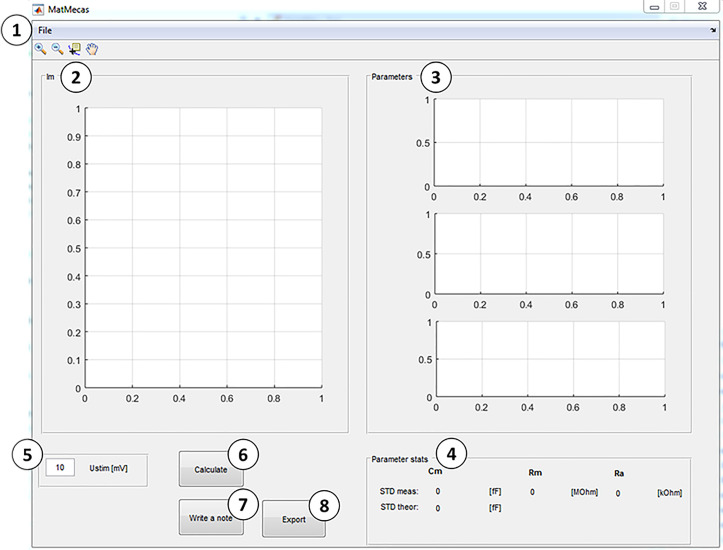
MatMecas user interface description (Figure 8)
For description see below:
-
The context menu ‘File’ contains the following applications:
Open: A dialog window opens in which a raw data file (.abf) must be selected for analysis.
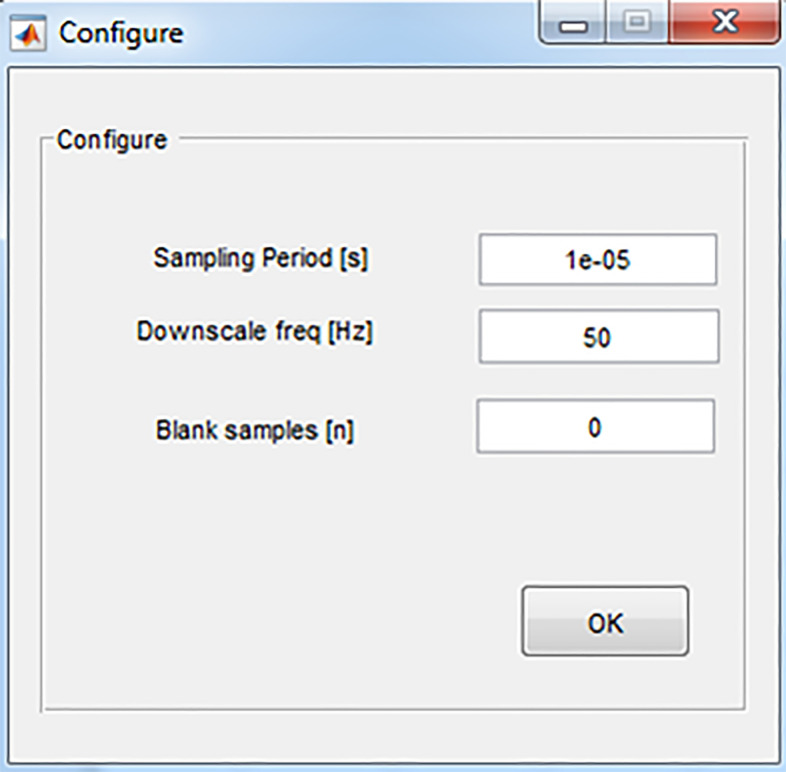
Configure: Opens a dialog window (Figure 9) in which the following parameters are set:
• Sampling Period–reciprocal to the sampling frequency, e.g., 1e-5 for a sampling frequency of 100 kHz.
• Downscale frequency–set a frequency to which the original pulse frequency is downscaled. Downscaling uses averaging to increase the resolution of parameter estimates. For instance: raw data recorded with a sampling frequency of 200 Hz can be downscaled to 50 Hz. This improves the signal to noise ratio by a factor of 2, at the expense of a four-fold loss in time resolution.
• Blank samples–a number of sample points at the beginning of the current signal that are excluded before analysis. Since the first samples of the current response are most affected by fluctuations of the stray capacitance, blanking is recommended in cases where the residual stray capacitance is unstable.
• Impulse Response–A dialog window opens in which the impulse response function files are selected and loaded (R+C impulse response: containing the current response of the 10 MΩ resistor mounted between the head-stage input and ground, C impulse response: containing the current response of the ungrounded resistor).
Display of the first current trace (IM) in the loaded file.
Display of the calculated circuit parameters (CM, RM and RA).
-
Display of parameter statistics: STDMeas: measured standard deviation; STDTheor: theoretical standard deviation calculated as:
where k is Boltzmann constant, T is absolute temperature in Kelvin, RA is access resistance in Ohm, CM is membrane capacitance in Farad, B is bandwidth in Hertz and UStim is the amplitude of a voltage stimulus in Volt ( Thompson et al., 2001 ).
Voltage pulse information providing the amplitude of the stimulus pulse (UStim).
‘Calculate’ button: A dialog window opens in which the raw data file of the stray capacitance is selected and loaded. Following this, the recorded currents are de-convoluted with the impulse response function of the recording apparatus. These de-convoluted traces are individually fit to a monoexponential function and the circuit parameters are calculated for each current response.
‘Write a note’ button: opens an input dialog window in which comments on the experiment can be added.
‘Export’ button: Calculated parameters and added notes are exported into an excel file.
-
-
Initialize MatMecas
Load the raw data file: File → Open.
Load the impulse-response function: File → Load Impulse Response.
Configure parameters for the calculation: File → Configure.
-
Press the ‘Calculate’ button. Select the requested stray capacitance file. The calculation process starts and its progress is indicated in the waiting bar. When the calculation is finished, two windows pop up:
Parameters
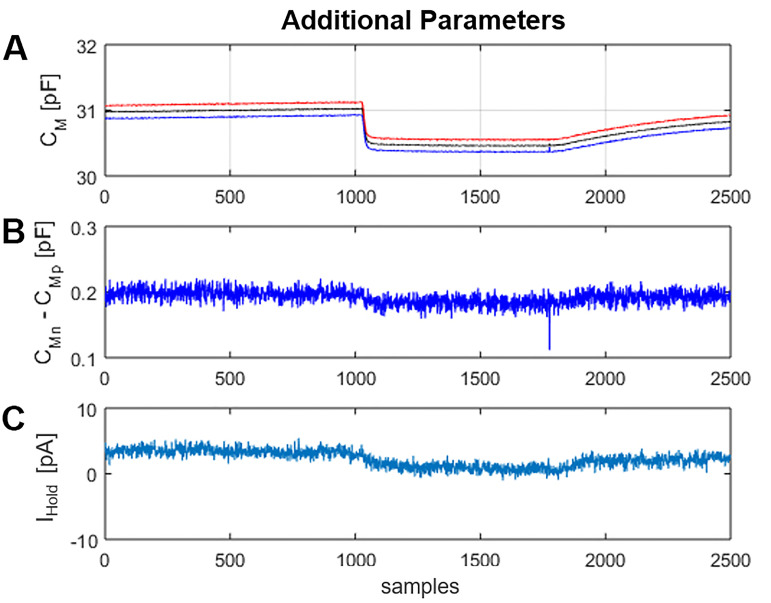
Additional Parameters
-
Characteristics and interpretation of CM changes
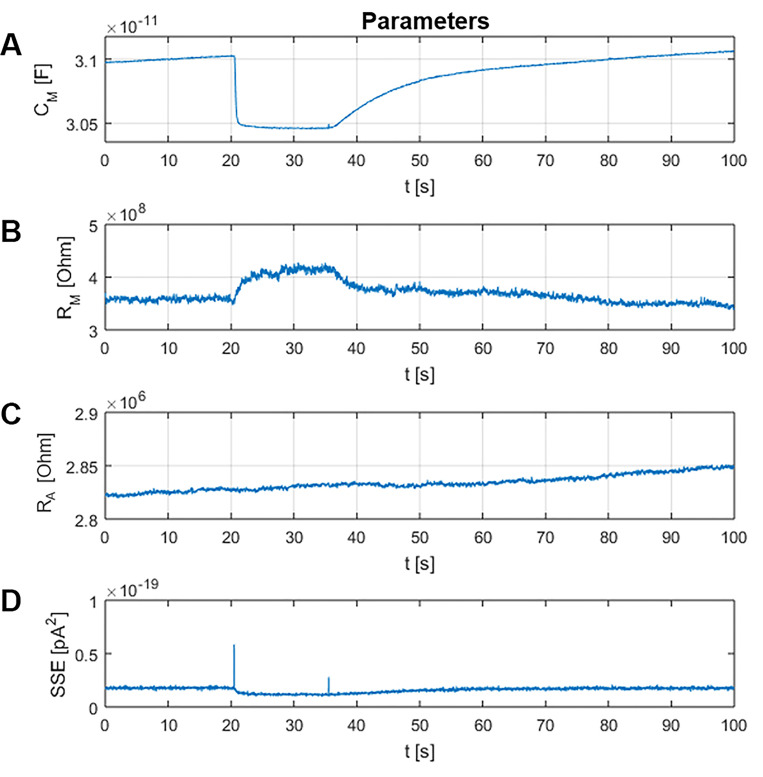
MatMecas provides time records of the three circuit parameters CM, RM and RA along with the summed squared errors (SSE) of the fitting procedure (Figure 10). SSE is a useful parameter for evaluating the fidelity of the model. Furthermore, MatMecas provides information on the voltage profile of CM and the baseline current IHold of the analyzed current responses (Figure 11).
Figure 8. MatMecas user interface.
Figure 9. Configuration dialog window.
Figure 10. Window “Parameters”.
In panels A-C the circuit parameters CM, RM and RA are plotted as a function of time, respectively. Panel D depicts the evolution of the summed squared residuals (SSE, pA2) between the measured data and the fit. Smaller SSE values indicate better fits.
Figure 11. Window “Additional Parameters”.
A. CMp (blue trace) and CMn (red trace) are the CM values obtained from the positive and negative displacement current produced by the square-wave voltage stimulus, respectively. CM (black trace) is the average of CMp and CMn. The display of CMp and CMn as separate traces provides information on the voltage dependence of CM over the span of the stimulating voltage. B. The difference between CMn and CMp (CMn-CMp) is a useful parameter for monitoring changes in the voltage dependence of CM in time. C. IHold is the mean of the positive and negative steady currents (IS, P/N).
Recipes
-
Cell culture
-
Maintenance medium (10 ml)
9 ml DMEM
1 ml FBS
150 μg ml-1 Zeocin
6 μg ml-1 Blasticidin
Store at 4 °C
-
Phosphate-buffered saline (PBS)/EDTA
137 mM NaCl
2.7 mM KCl
8.1 mM Na2HPO4·2H2O
1.8 mM KH2PO4
Adjust the pH to 7.4 with NaOH
0.02% EDTA
Store at 4 °C
-
-
Electrophysiological Solutions
-
Extracellular solution (bath)
140 mM NaCl
3 mM KCl
2.5 mM CaCl2
2 mM MgCl2
20 mM Glucose
10 mM HEPES
Adjust the pH to 7.4 with NaOH
Store at 4 °C
-
Intracellular solution (pipette)
133 mM K-gluconate
5.9 mM NaCl
1 mM CaCl2
0.7 mM MgCl2
10 mM EGTA
10 mM HEPES
Adjust the pH to 7.2 with KOH
Store at 4 °C
-
Acknowledgments
This work was supported by the Austrian Science Fund/FWF Project P28090 (to W. S.).
Competing interests
The authors declare no conflict of interest.
Citation
Readers should cite both the Bio-protocol article and the original research article where this protocol was used.
Supplementary Data.
References
- 1. Burtscher V., Hotka M., Li Y., Freissmuth M. and Sandtner W.(2018). A label-free approach to detect ligand binding to cell surface proteins in real time. Elife 7: e34944. [DOI] [PMC free article] [PubMed] [Google Scholar]
- 2. DeFelice L. J.(1997). Electrical properties of cells: patch clamp for biologists. New York, Springer Science& Business Media . [Google Scholar]
- 3. Hilber B., Scholze P., Dorostkar M.M., Sandtner W., Holy M., Boehm S., Singer E.A. and Sitte H.H.(2005). Serotonin-transporter mediated efflux: A pharmacological analysis of amphetamines and non-amphetamines. Neuropharmacology 49: 811-819. [DOI] [PubMed] [Google Scholar]
- 4. Hotka M. and Zahradnik I.(2017). Reconstruction of membrane current by deconvolution and its application to membrane capacitance measurements in cardiac myocytes. PLoS One 12(11): e0188452. [DOI] [PMC free article] [PubMed] [Google Scholar]
- 5. Oesterle A.(2018). The pipette cookbook. Sutter Instrument Company. https://www.sutter.com/PDFs/pipette_cookbook.pdf. Accessed 23 Nov 2018. [Google Scholar]
- 6. Rae J. L. and Levis R. A.(2004). Fabrication of patch pipets. Current Protocols in Neuroscience. Chapter 6: Unit 6.3 [Google Scholar]
- 7. Thompson R. E., Lindau M. and Webb W. W.(2001). Robust, high-resolution, whole cell patch-clamp capacitance measurements using square wave stimulation. Biophysical Journal 81(2): 937-948. [DOI] [PMC free article] [PubMed] [Google Scholar]
Associated Data
This section collects any data citations, data availability statements, or supplementary materials included in this article.


