Abstract
We describe the Honeycomb Maze, a novel behavioral paradigm for the study of spatial navigation. The maze consists of 37 platforms which can be raised or lowered independently. Place navigation requires an animal to go to a goal platform from any of several start platforms via a series of sequential choices. On each, the animal is confined to a raised platform and given a choice between two of the six adjacent platforms, the correct one being the platform with the smallest angle to the goal heading-direction. Rats learn rapidly and their choices are influenced by three factors: the angle between the two choice platforms, the distance from the goal, and the angle between the correct platform and the goal heading-direction. Rats with hippocampal damage are impaired in learning and are affected by all three factors. The Honeycomb Maze is a significant improvement over current spatial navigation tests such as the Morris Water Maze1–3; it controls the animal’s choices at each point in the maze, provides the ability to assess knowledge of the goal direction from any location, allows the identification of factors influencing task performance, and affords the possibility of concomitant single cell recording.
The hippocampal formation forms a cognitive map of a familiar environment which supports the ability of an animal to identify its location, respond to changes in the environment, and navigate to desirable locations or avoid undesirable ones4. These functions are supported by cells coding for location (place cells)5, heading direction (head direction cells)6, 7, distance in a particular direction (grid cells)8, and distance from the boundaries of an environment (boundary cells)9,10, see11,12 for reviews.
Several tasks are routinely used to test spatial navigational learning. These include the T- or Y-maze13, Olton radial arm maze14,15, Barnes maze16 and Morris water maze1–3. All have drawbacks as tests of spatial navigation and memory, and for recording spatial cell activity. The first four do not force the animals to use a single identifiable spatial strategy because they can all be learned using directional- or object- heading strategies as well as place learning. The Morris water maze does not suffer from this indeterminacy because it requires the animal to approach a hidden goal from different directions and therefore to head in different directions and towards different cues on different trials. However, it presents other problems related to the unlimited number of choices at each location, the lack of independence between successive choices, and the inhomogeneity of behavior across the environment once the animal has learned the task (see Supplementary Discussions 1 & 2). The Honeycomb Maze described in this paper represents an improved version of the water maze and has been purposely designed to overcome the deficiencies of these tasks.
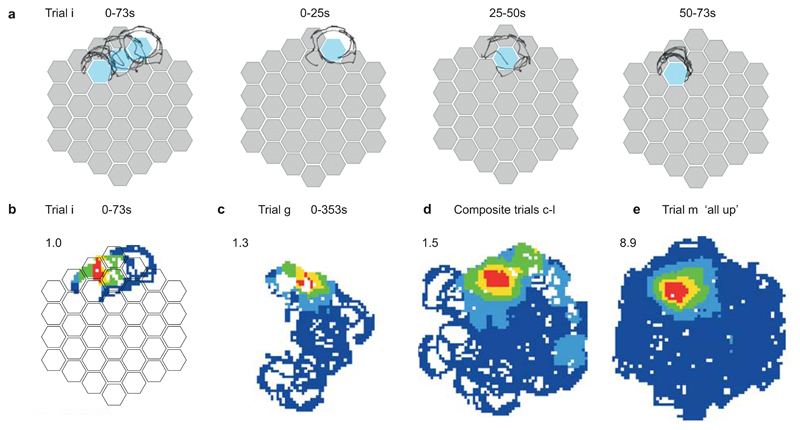
In this paper we describe the Honeycomb Maze, the performance of control animals on the navigational task, factors affecting their performance, and the performance of hippocampal-lesioned animals. As proof of principle, an example of a place cell recorded on the maze is included in Extended Data Figure 1.
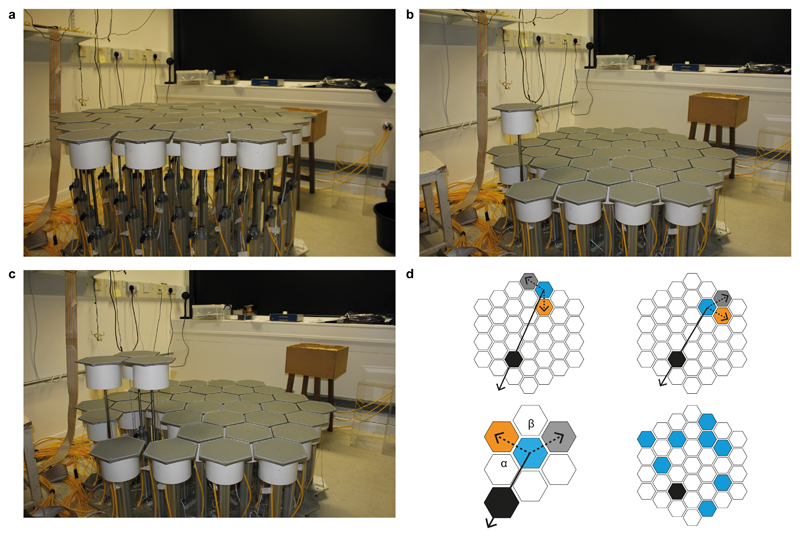
The Honeycomb Maze consists of 37 tessellated hexagonal platforms each fixed atop a pneumatic tube, allowing it to be raised independently of the others. Figure 1 shows the maze in different configurations: all platforms raised (a), a single platform raised (b) or three adjacent platforms raised (c). The animal’s objective is to reach a specific goal platform from eight or nine different starting locations (Fig. 1d lower right, Extended Data Fig. 2) by making a series of binary choices, between two platforms adjacent to the currently occupied platform (Fig. 1d, upper left and right; Supplementary Video). The ‘correct’ choice is the platform with the smallest angle to the goal direction or, in vector terminology, the one with the smallest dot or inner product with respect to the goal-direction vector. The sequence continues until the goal platform is reached where the animal is rewarded after a short delay with a single Cheerio®.
Figure 1. The Honeycomb Maze.
Honeycomb Maze with all (a), one (b), and three platforms raised (c). (d) Schematic navigation paradigm: Upper left, at any given location (e.g. blue start platform) two choices are offered, correct (orange) having a smaller heading direction towards the goal (black) than the other (grey). Upper right, next choice: the platform previously chosen becomes the new “occupied” platform (blue). Lower left, each choice is described by two angles: α between correct choice and goal heading direction, and β between correct and incorrect choices. Lower right, eight different start platforms (blue).
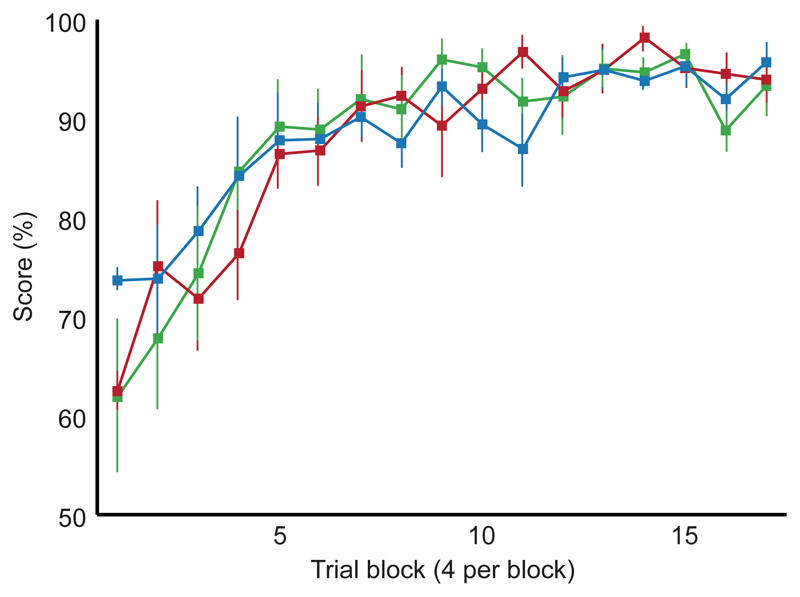
Three groups of male Lister hooded rats were tested on a spatial navigation task on the Honeycomb Maze (Methods); an unoperated control group, and two operated control groups which had received sham surgical procedures (one group received sham hippocampal lesions and the other sham surgical procedures in the medial entorhinal cortex). All three control groups learned the task rapidly, and after 28 trials all animals achieved a mean score of greater than 90% correct choices over four consecutive trials. There was no difference in performance between the three groups suggesting that performance on the maze is consistent and reliable (Fig. 2).
Figure 2. Learning to navigate on the Honeycomb Maze.
Performance of three groups of rats (means ± s.e.m): n = nine unoperated controls (blue), eight operated controls with sham hippocampal lesions (red), and eight operated controls with sham medial entorhinal lesions (green). All animals were tested for 68 to 72 trials over thirteen to seventeen days; data are shown for the first 68 trials. Unoperated controls undertook six trials per day, sham operated controls undertook four per day. Note similarity of performance (F2, 22 < 0.001, p > 0.999, two-way Mixed ANOVA).
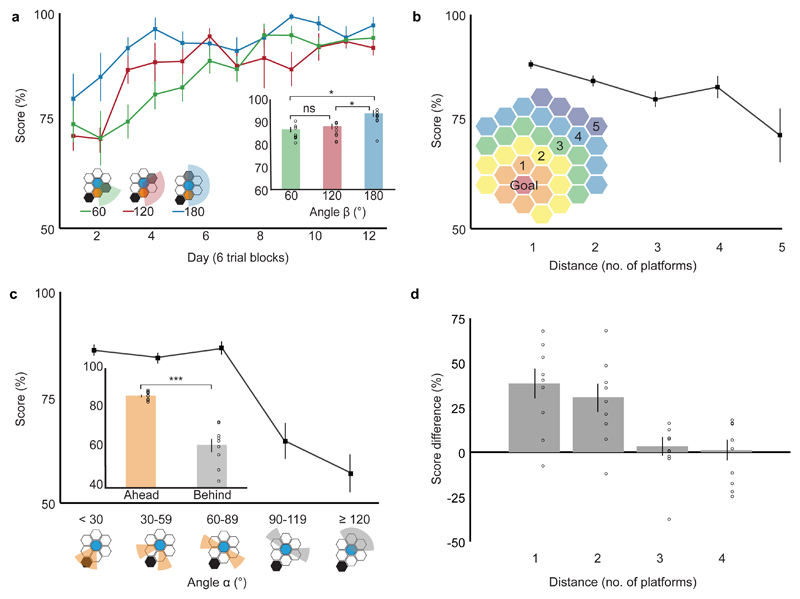
Several parameters determined performance in unoperated control animals: i) the angular difference between the direction to the correct platform and the goal (angle α), ii) the smallest angular separation between the two choice platforms independent of the direction of the goal (angle β), and iii) the distance of the choice from the goal (Supplementary Discussion 3). The testing schedule minimized the interaction between these variables so that the effect of each could be examined (Methods, Extended Data Fig. 2). Performance was best when choice platforms were separated by two others (angle β = 180°, 92.8 ± 1.1% (mean ± s.e.m) correct choices overall) and deteriorated when only one (angle β = 120°) or no (angle β = 60°) platform separated them (86.9 ± 1.2% and 85.8 ± 1.4% respectively). There was a significant effect of angle β and day of testing on performance but no interaction between these two variables (Fig. 3a). The differences between two-platform separations (angle β = 180°) and the rest (angle β = 120° or 60°) were significant (Fig. 3a inset).
Figure 3. Factors affecting maze performance in controls.
Three factors influence performance in unoperated control rats (n = 9 animals): (a) Performance improved with increasing platform separation (performance vs angle β: F2, 16 = 8.850, p = 0.003) and with experience (performance vs testing day: F11,88 = 11.361, p < 0.001) but there was no significant interaction between angle β and experience (F22,176 = 1.438, p = 0.102, all two-way repeated measures ANOVA). Inset: mean performance for different values of angle β across all days and pairwise comparisons (60° vs 180°, mean difference (MD) = 7.0%, p = 0.034; 120 ° vs 180°, MD = 5.9%, p = 0.044; 60° vs 120°, MD = 11.0%, p = 1.000; post-hoc Bonferroni). (b) Performance declined with increasing distance of choice from goal as measured inset (F3,24 = 3.707, p = 0.025, one-way repeated measures ANOVA). (c) Performance declined with increasing angle to goal (angle α, F4,32 = 20.670, p < 0.001, one-way repeated measures ANOVA). Inset: Mean scores were higher for “Ahead” (α< 90°, orange) vs “Behind” choices (α> 90°, grey) (t8 = 6.620, p < 0.001, two-sided paired t-test). (d) There was an interaction between distance from goal and angle to goal (angle α) for adjacent platform choices (F3,24 = 9.133, p < 0.001, two-way repeated measures ANOVA). y axis = difference in mean performance for “Ahead” and “Behind” choices. For (a-d) error bars indicate s.e.m., *p < 0.05, ***p < 0.001.
Performance declined with increasing distance from the goal (Fig. 3b, Supplementary Discussion 3) ranging from 88.4 ± 1.0% correct for platforms adjacent to the goal to 71.8 ± 6.1% for five platforms distant. Performance also decreased as an inverse function of the difference between the direction to the goal and the correct platform (angle α), ranging from 86.2 ± 1.3% correct for 0° to 29° angles, to 61.1 ± 3.1% for angles greater than or equal to 90° (Fig. 3c). Animals performed significantly better when the direction of the correct platform was less than 90° from that of the goal (Fig. 3c inset). Importantly, even when the correct choice was 90° or greater from the goal direction all animals performed above chance (t8 = 3.156, p = 0.013, one sample t-test).
A multiple regression analysis indicated that angle α, angle β, and distance were all significant predictors of performance (Extended Data Table 1), between them predicting 5.5% of the variance (R2 = 0.055, F3, 391 = 7.608, p < 0.001). As illustrated by Figure 2, a large proportion of the remaining variance in performance is accounted for by experience.
Finally, there was evidence of an interaction between the effects of angle α and the distance from goal, at least when choice platforms were adjacent to one another. The angle-to-goal effect falls off as a function of the distance from the goal such that performance improved with larger angles at greater distances (Fig. 3d).
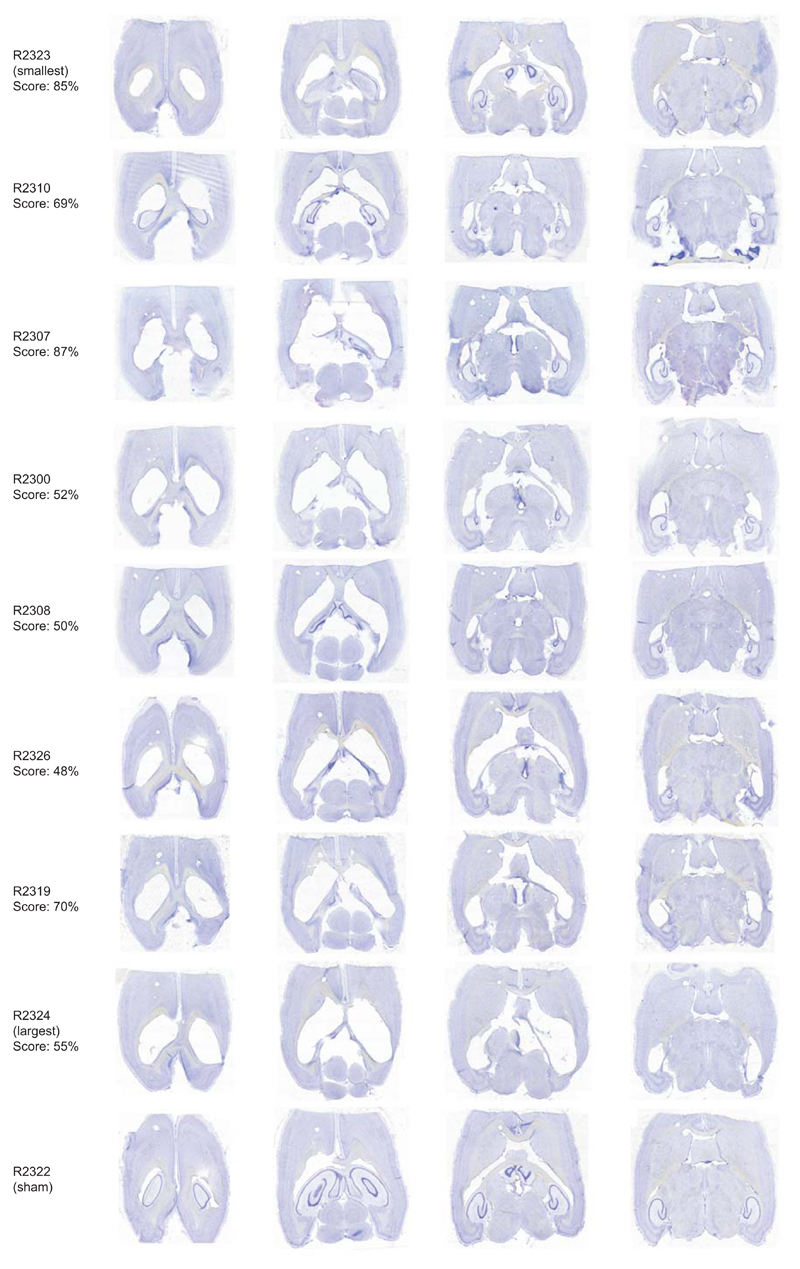
In a further experiment, learning on the Honeycomb Maze was compared between animals with ibotenic acid lesions of the hippocampus and sham-operated controls. Hippocampal damage ranged from 48% to 94% with preserved tissue primarily in the ventral hippocampus with small amounts of incidental damage to the caudate and putamen in all animals and minor additional damage to dorsal subiculum, medial geniculate nucleus and pre- and parasubiculum in a subset (Methods, Extended Data Fig. 3).
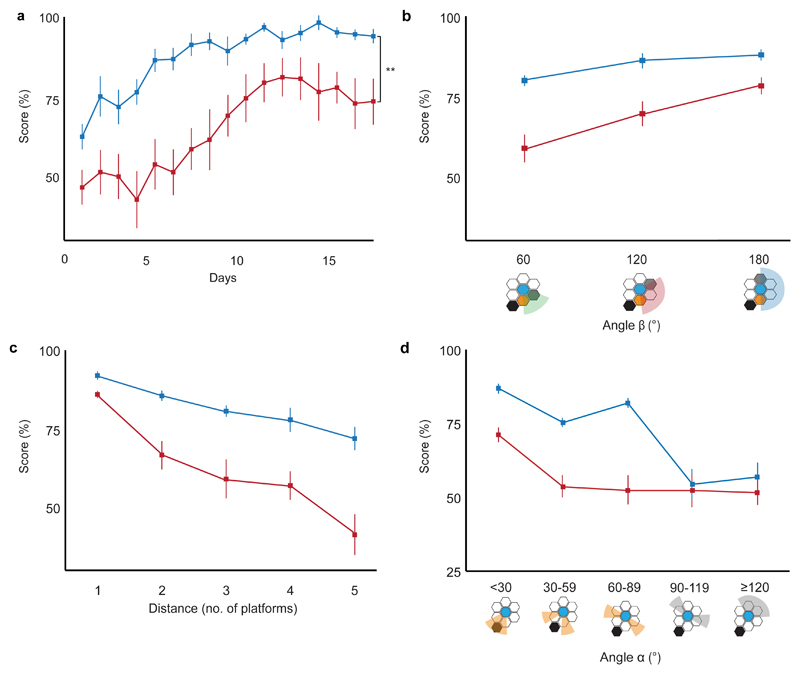
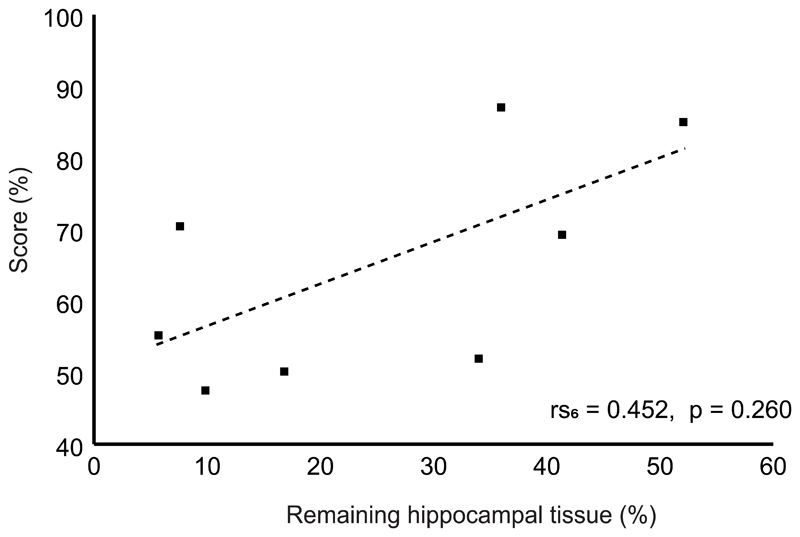
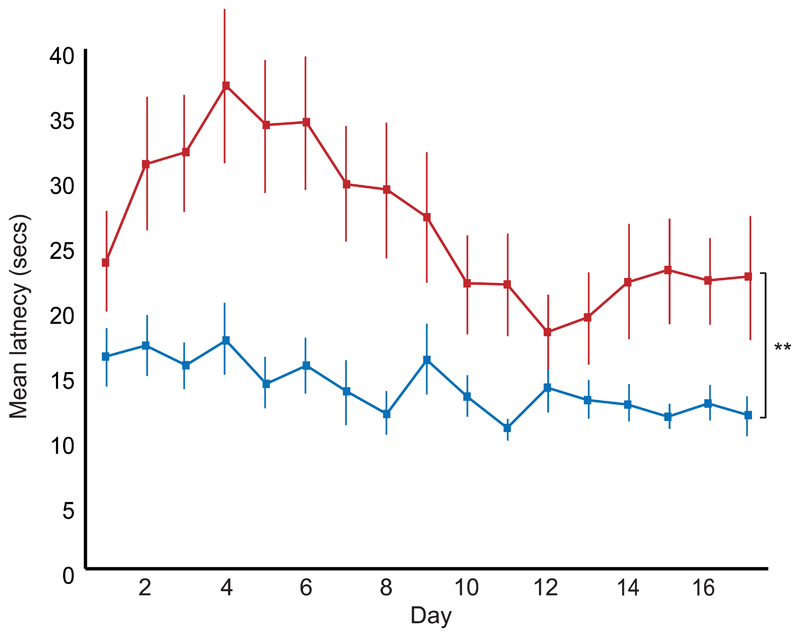
Hippocampal-lesioned animals were significantly deficient in learning the task relative to controls (Fig. 4a). As in the unoperated control group described above, performance in both lesioned animals and sham-operated controls was related to three variables (Fig. 4b-d): separation between choice platforms (angle β), distance from the goal and angle of the correct choices to the goal direction (angle α). There was a significant interaction between all three variables and lesion status (angle β*lesion status, F2,28 = 6.981, p = 0.003; distance*lesion status, F4,56 = 4.999, p = 0.002, angle α*lesion status, F2.3,32.8 = 8.431, p = 0.001; two-way Mixed ANOVAs). Behavioral performance tended to decrease as hippocampal damage increased, but this was not significant, possibly due to a floor effect with half the lesioned animals scoring at chance level (Extended Data Fig. 4). Hippocampal-lesioned animals were also slower to make choices (F1, 14 = 11.103, p = 0.005; Extended Data Fig. 5). Latencies were significantly longer for incorrect choices than correct choices (F1, 14 = 23.839, p < 0.001) suggesting that longer latencies reflect the animals’ uncertainty, an effect larger for the lesioned animals (F1, 14 = 4.956, p = 0.043, all two-way Mixed ANOVA).
Figure 4. Hippocampal-lesioned animals on the Honeycomb Maze.
(a) Animals with hippocampal damage (red, n = 8) are significantly impaired in learning the task compared to operated controls with sham hippocampal lesions (blue, n = 8) (F1,14 = 10.240, p = 0.006, two-way Mixed ANOVA), 4 trials per day. (b-d) Animals with hippocampal damage (red, n = 8) are significantly more influenced than controls (blue, n = 8) by (b) separation between choice platforms (angle β; F2,28 = 40.024, p < 0.001, two-way Mixed ANOVA), (c) distance from the goal (F4,56 = 34.740, p < 0.001, two-way Mixed ANOVA), and (d) angle to goal (angle α; F2.3, 32.8 = 28.812, p < 0.001, two-way Mixed ANOVA). For (a-d) error bars indicate s.e.m., ** p < 0.01.
In summary, the Honeycomb Maze is an improvement on the water maze, the current gold standard for testing hippocampal-dependent spatial navigation (Supplementary Discussion 2). Performance across three control groups was comparable (Fig. 2), even when animals were tested by different experimenters on different occasions, showing the consistency and reproducibility of the task. Performance was affected by three variables. Success was reduced with increased distance of the choice from the goal and by increased deviation of the best-choice platform from the direction vector to the goal (angle α), and was improved by an increase in the angle between the two choice platforms (angle β). Both direction and distance factors were noted in early research on maze learning (Supplementary Discussion 3), with O'Keefe and Nadel4 suggesting that the direction factor was generated by the hippocampal cognitive map. The ability of control animals to identify the better of two directions even when neither is aligned with the goal suggests that the brain is capable of vector computations. Animals with hippocampal damage are significantly worse on all three factors, suggesting that these vectors are computed in the hippocampus itself. An alternative explanation is that the computation is performed in another brain region such as the parietal cortex, which requires input from hippocampal place cells encoding the current location of the animal and the goal and choice platform locations. A simple vector schema can account for these data (Extended Fig. 6, see also17,18).
Finally, the Honeycomb Maze makes an ideal environment for correlating the activity of place cells with spatial navigation performance (Extended Data Fig. 1) something not easily accomplished in the water maze.
Methods
Maze Description
The Honeycomb Maze consists of 37 tessellated hexagonal platforms (11.5 cm along each side) in an overall hexagonal configuration (total maze diameter 145.5 cm, five platforms across with 1 cm gaps between each platform). Each platform is fixed atop a pneumatic tube allowing it to be raised independently of the others. Each raised platform is 81.5 cm above the base (49 cm lowered). Each platform is comprised of three layers; the top, made of 3 mm thickness ABS (Acrylonitrile Butadiene Styrene) with a pinseal finish, is movable and connected to the bottom layer by six microswitches for registering an animal's presence on that platform; the middle layer is made of aluminum which is grounded to reduce electrical artifacts. Custom-made Software (written in Labview) monitoring the platform switches allows the raising and lowering of platforms based on the animal’s location. Only unoccupied platforms are moved. Plastic skirts around the top of the pneumatic tubes protect the under-platform wiring and tubing. The maze sits within a standard laboratory giving the animal access to abundant extra-maze cues for location and direction (Fig. 1a-c).
Animals and surgical procedures
Four groups of rats weighing between 310 and 374 grams were trained: three control groups and a hippocampal lesion group. All rats were male Lister Hooded rats purchased from Charles River Laboratories and aged between 12 and 16 weeks at the start of behavioural testing. Rats were all housed in open caging along with their littermates in groups of three to four. All animal experiments were carried out in accordance with the British Home Office Regulations (UK Animals Scientific Procedures Act 1986; Project License PPL 70/8202 to Professor John O’Keefe). Study protocols were in accordance with the terms of the Project License which was reviewed by the Animal Welfare and Ethical Review Board (AWERB) at University College London.
The first group consisted of nine normal unoperated control rats. The second group comprised eight control rats with sham hippocampal (HPC) lesions, and the third group eight animals with sham lesions in the medial entorhinal cortex (MEC). In the operated controls, sham lesions which caused no neural damage were made by insertion of a Barosilicate-glass micropipette (World Precision Instruments) without injection into fourteen sites (per hemisphere) for the sham hippocampal lesions (Extended Data Table 2), and eight sites (per hemisphere) for the sham MEC lesions (Extended Data Table 3). In the final group of eight rats pressure injections of between 50-80nl of ibotenic acid [10µg/µl] were made via a glass micropipette at fourteen injection sites in each hemisphere to lesion the hippocampus (Extended Data Table 2). Surgeries were performed under sterile conditions under isoflurane anesthesia and the animals were given analgesics (Metacam) for three days postoperatively.
Behavioral training
After one week of recovery all animals were food restricted and reduced to 90% of their free feeding body weight over a two week period prior to training. During this time, they were handled daily and during the last three days were placed on a holding platform in the testing room where they were habituated to the sounds made by the maze platforms being raised and lowered.
There was no period of maze exploration prior to training on the task. At the beginning of each trial, the animal was placed down on one of eight or nine different starting platforms and after a four second delay, two of the six adjacent platforms were raised (Fig. 1d). When the animal chose one of these two platforms, the previously occupied and non-chosen platforms were lowered and after an interval of four seconds, two new platforms were raised. Neither of these was the platform from which the animal had just come (with one exception), ruling out the strategy of avoiding that platform as a potential solution. If a choice was not made within one minute, the animal was gently guided onto a choice platform (alternatively correct or incorrect, ruling this out as a source of information about correct choice), the choice scored as incorrect, and the next choice in the sequence initiated. If the animal had not reached the goal within five minutes, the trial was terminated and the animal guided to the goal platform and given a reward. On some ‘choices’, the animal was presented with only a single platform and was required to move to that platform. This forced-choice was occasionally necessitated to eliminate the strategy of avoiding an immediately previously occupied platform.
Platform choices could vary along several dimensions: i) in the angle between the best choice platform and the heading direction to the goal which could vary from 0° to 135° (angle α, Fig. 1d), ii) in the angle between the two platforms (angle β, Fig. 1d), choices ranging from neighboring platforms to platforms separated by two others, and iii) in the distance of the platform from the goal, in terms of the number of platforms to be traversed on the direct route to goal (range one to five, Fig. 3b inset).
The trial was terminated when the animal reached the goal or after five minutes had elapsed. Upon reaching the goal animals were confined there and given one Cheerio® after a delay of approximately five seconds. This delay of reward procedure ensured that the animal could not locate the goal platform by its odour. Cleaning of the maze between trials also eliminated odour cues.
Two different trial protocols were used in this study (see below, and Extended Data Fig. 2 for further discussion of different schedules). Unoperated controls had three trials per day on the first two days and subsequently six trials per day for the next eleven days (total of 72 trials). Operated controls were given four trials per day for seventeen days (total of 68 trials). The number of choices per trial varied depending on the animal’s success rate with a median of five choices per trial (range 2–37).
In the lesion study the experimenter was blinded to lesion status.
Statistics
Differences in learning rates between the different control groups (unoperated vs sham HPC vs sham MEC controls) were assessed using a two-way Mixed ANOVA (Figs. 2). Two-way repeated measures ANOVAs were used to compare the performance of unoperated controls on trials with different values of angle β (Fig. 3a), with post-hoc Bonferroni testing for pairwise comparisons (Fig. 3a inset), and to test for an interaction between angle α (“ahead” choices vs “behind” choices) and distance in trials where choices consisted of adjacent platforms (Fig. 3d). One-way repeated measures ANOVAs were used to test for a relationship between performance and distance, and performance and angle α, in the unoperated control group (Fig. 3b-c). Performance on “ahead” choices (angle α < 90°) vs “behind” choices (angle α > 90°) was compared using a paired t-test, and a one sample t-test was used to determine whether performance on “behind” choices was significantly better than chance. A multiple regression analysis was conducted to evaluate the contribution of the three maze factors (angle α, angle β and distance) to performance in the unoperated control group (see main text and Extended Data Table 1).
Differences in learning curves were assessed in HPC lesioned animals vs controls using a two-way Mixed ANOVA (Fig. 4a). Two-way Mixed ANOVAS were also used to ascertain the effect of each maze variable (angle α, angle β and distance) on performance and their potential interaction with lesion status (Fig. 4b-d). A Spearman’s correlation was used to correlate lesion extent with performance (Extended Data Fig. 4). Differences in latencies between HPC lesioned animals and controls over time were tested using a two-way Mixed ANOVA, and a two-way Mixed ANOVA was used to investigate the relationship between latencies, whether a choice was correct or incorrect, and lesion status.
For Figures 2, 3(a-c), 4 and Extended Data Figure 5, data points indicate the mean score of one group of animals over a specified number of trials. In all figures, error bars indicate the s.e.m. For all statistical tests, data were tested to ensure they met the necessary assumptions before proceeding to analysis.
Histology
On completion of behavioral testing animals were euthanised under deep anesthesia and the brain fixed via intracardial perfusion with saline and 4% paraformaldehyde. Horizontal sections (40µm) of the brains of hippocampal-lesioned animals and operated controls with sham hippocampal lesions were mounted on gelatinised slides and stained with cresyl-violet acetate. Slides were imaged using a ZEISS Axio Scan.Z1. Lesion volume was quantified by a blinded observer via manual tracing of the hippocampus on every fourth section using ImageJ. The remaining volume of hippocampal tissue in lesioned animals was expressed as a percentage in relation to the measured volume of a typical operated control with a sham hippocampal lesion.
Testing schedules
Testing schedules were carefully designed to meet a number of criteria. First, for each choice the animal was not offered a platform it had just occupied, with the exception of one instance, to eliminate the strategy of avoiding an immediately previously occupied platform. Second, to prevent the task being solved using an egocentric strategy, correct choices were selected so that there was an approximately equal number of choices requiring the animal to turn left (or anticlockwise) when facing the goal, as right (or clockwise). Third, the starting platform changed between trials and these eight or nine platforms were distributed approximately equally around the maze.
The design of the maze permits a large number of different spatial navigation schedules to be run, running the gamut from those most sensitive to hippocampal function to those least so. At the most sensitive end of the spectrum are schedules in which no trial is ever repeated ruling out the possibility that the task can be solved by a non-hippocampal dependent guidance or stimulus-response strategy. The animal must learn to approach a location in space from any starting position and any direction. At the other end of the spectrum are schedules which can be easily learned using a guidance strategy, such as always approach a distal cue, or a stimulus-response routine such as a sequence of body turns e.g. left-right alternations. A guidance-biased training protocol might involve always starting the animal from the same location and offering the same sequence of choices, one of which always led directly towards the goal (for example see19). Intermediate between these two extreme schedules are ones which restrict the types of choices available to the animal (e.g. to choices between platforms at three different angles) which we have used in our first study to identify the factors contributing to successful performance.
The two different testing schedules used in the present study are described in more detail below:
Schedule 1
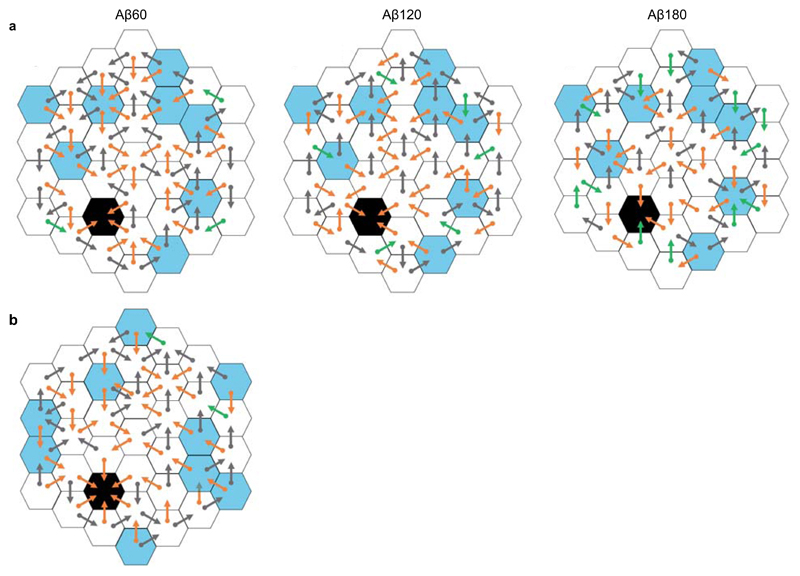
The schedule used in the unoperated control group was specifically designed to investigate the effect of the three metrics (angle α, angle β, and distance) on task performance. In this experiment the nine unoperated control animals undertook three different “types” of trial, which we call “Aβ60”, “Aβ120” and “Aβ180”. In each trial type, the smallest angle between the two choice platforms offered (angle β) was fixed at 60 (Aβ60), 120 (Aβ120) or 180 (Aβ180) degrees. The values of angle α were carefully selected to ensure that for any given distance from the goal there were a range of angle α values for each choice. This was done in order to maximise the number of choices with unique combinations of distance, angle α and angle β. This design enabled us to collect a rich data set with 50 unique angle α/angle β/distance combinations. Animals were tested in groups of three. Each animal completed six trials per day: two trials of each type. In the testing schedule trial type was staggered to control for the effect of experience on performance. Eight different start platforms were also rotated and the combinations of start platforms and trial type were carefully counterbalanced. (Extended Data Fig. 2a illustrates the three different types of trials used in testing schedule 1.)
Schedule 2
When testing the lesioned animals, a new protocol was designed to allow us to examine the correlation between lesion size and task performance. In order to make a meaningful comparison between individual lesioned subjects it was important to ensure that all animals experienced trials of the same difficulty in the same temporal order. This was particularly vital given the rapid rate at which animals learn the Honeycomb Maze task. (As an illustration, in the lesion study control animals did not perform significantly better than hippocampal-lesioned animals on the very first trial, but significantly outperformed them by the end of the first day of testing.) For the lesion study, we therefore designed a schedule containing choices with all possible values of angle β, to enable direct comparisons between lesioned and control subjects on a day-by-day basis and amongst lesion subjects with differing-sized lesions. Nine start platforms were used. (This protocol is illustrated in Extended Data Fig. 2b.)
Extended Data
Extended Data Figure 1. Place cell recorded on the Honeycomb Maze.
Single place cell recorded during navigation on the Honeycomb Maze. (a) Behavior (black line) on a single trial (trial i) in which the animal is offered three consecutive choices (left) to go from the start platform (second left, 0 - 25 s), to an intermediate platform (third left, 25 - 50 s), to the goal (right, 50 - 73 s). The program detained the rat on each platform for 20 s before the two choice platforms were raised. Non-chosen platforms not shown. Notice that as the animal waits on each platform it samples the immediate environment by circling around the perimeter of the platform. (b) The firing of a place cell during this trial (trial i), maximum rate in red shown upper left. (c) Rate map for the same cell on a separate trial (trial g) from a different start arm. (d) Composite rate map from ten trials (trials c–l), each from a different starting location in which the animal took a different path to the goal. (e) Firing rate map of the same cell when all platforms were in the up-state and animal foraged for food over a period of 20 minutes (trial m). Note the similarity in this cell between the firing fields during navigation trials (d) and during the foraging condition (e) (spatial correlation = 0.77). Not all place cells show this profile with others (not shown) firing in a different location(s) during the navigation trials from that seen in the foraging condition (i.e. remapping).
Extended Data Figure 2. Protocols used on the Honeycomb Maze.
(a) Schedule 1 trial protocols for Aβ60 (left), Aβ120 (middle) and Aβ180 (right) trials. (b) Schedule 2 protocol. For (a) and (b) goal platform = black, start platforms = blue, orange vector = correct choices, grey vectors = incorrect choices, green vectors = “forced” choices. For a more detailed explanation see Methods.
Extended Data Figure 3. Histology for hippocampal-lesioned rats.
Representative sections from hippocampal-lesioned animals and one operated control with a sham hippocampal lesion (R2322) alongside mean performance scores on the Honeycomb Maze. Subjects are arranged in order of increasing lesion size. Horizontal sections (40µm) stained with cresyl violet.
Extended Data Figure 4. Correlation between hippocampal volume and performance.
Correlation between remaining hippocampal volume and performance on the spatial navigation task on the Honeycomb Maze in eight hippocampal-lesioned animals (n = 8 animals, rs6 = 0.452, p = 0.260; Spearman’s correlation).
Extended Data Figure 5. Hippocampal-lesioned animals have longer latencies.
Hippocampal-lesioned animals (red, n = 8) have longer latencies than operated controls with sham hippocampal lesions (blue, n = 8) (F1,14 = 11.103, p = 0.005). Latencies also changed as a function of experience (day) (F16, 224 = 5.612, p < 0.001) with a significant day*lesion interaction (F16, 224 = 2.464, p = 0.002, two-way Mixed ANOVA). ***p < 0.005. Error bars indicate s.e.m.
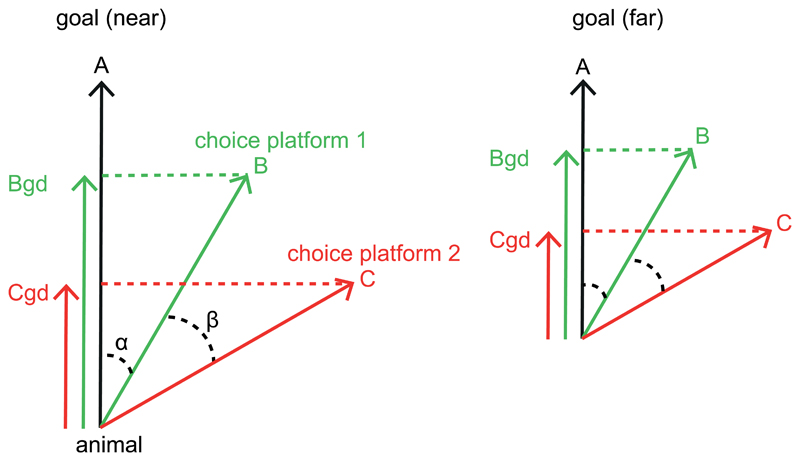
Extended Data Figure 6. Vector-based Navigation Schema.
(Left) The hippocampus represents a goal-direction vector pointing from the animal to the goal (A) which decreases as the animal is farther from the goal (Right). The navigation system computes the projection of each choice platform vector (B, C) onto the goal direction vector (inner product, Bgd, Cgd) and selects the larger of the two. This choice is easier with increased angle between choices (β) and consequent increased difference in the magnitudes of their projection vectors. The projection vector of the preferred platform, Bgd, is the output of the system which competes with other potential solutions to the problem e.g. choose the left-most or North-most platform.
Extended Data Table 1. Summary of Multiple Regression Analysis.
A multiple regression analysis was undertaken to establish the contribution of angle α, angle β, and distance to maze performance. Data were taken from nine unoperated control rats and performance assessed across all choice types. B = unstandardized regression coefficient; SEB = standard error of the coefficient; β = standardised coefficient
| Variable | B | SEB | β | p value |
|---|---|---|---|---|
| Intercept | 82.647 | 4.062 | ||
| Angle α | 0.068 | 0.024 | 0.138 | 0.005 |
| Angle β | - 1.862 | 0.930 | - 0.099 | 0.046 |
| Distance | - 0.091 | 0.029 | - 0.157 | 0.002 |
Extended Data Table 2. Coordinates of the hippocampal lesion sites with respect to bregma, and the volume of ibotenic acid used in lesioned animals.
AP, anteroposterior; ML, mediolateral; DV, dorsoventral; IBO, ibotenic acid.
| Site | AP (mm) | ML (mm) | DV (mm) | IBO (µl) |
|---|---|---|---|---|
| 1 | - 2.4 | 1.0 | 3.0 | 0.05 |
| 2 | - 3.0 | 1.4 | 2.1 | 0.05 |
| 3 | - 3.0 | 1.4 | 2.9 | 0.05 |
| 4 | - 3.0 | 3.0 | 2.7 | 0.10 |
| 5 | - 4.0 | 2.6 | 1.8 | 0.05 |
| 6 | - 4.0 | 2.6 | 2.8 | 0.05 |
| 7 | - 4.0 | 3.7 | 2.7 | 0.10 |
| 8 | - 4.9 | 4.6 | 6.5 | 0.05 |
| 9 | - 4.9 | 4.1 | 3.5 | 0.05 |
| 10 | - 4.9 | 4.1 | 7.2 | 0.10 |
| 11 | - 5.9 | 4.3 | 3.9 | 0.10 |
| 12 | - 5.9 | 5.1 | 4.5 | 0.08 |
| 13 | - 5.9 | 5.1 | 5.3 | 0.08 |
| 14 | - 5.9 | 5.1 | 6.1 | 0.08 |
Extended Data Table 3. Coordinates of the sham medial entorhinal lesion sites.
AP, anteroposterior; ML, mediolateral with respect to lambda; DV, dorsoventral. The glass micropipette was angled at 22 degrees from vertical pointing rostrally along the AP axis.
| Site | ML (mm) | DV (mm) | AP coordinates |
|---|---|---|---|
| 1 | 4.6 | 1.7 | Angle: 22° along AP axis pointing rostrally |
| 2 | 4.6 | 2.2 | |
| 3 | 4.6 | 2.7 | |
| 4 | 4.6 | 3.2 | |
| 5 | 4.6 | 3.7 | Site: close to transverse sinus (without inflicting damage) |
| 6 | 4.6 | 4.2 | |
| 7 | 4.6 | 4.7 | |
| 8 | 4.6 | 5.2 |
Supplementary Material
Supplementary Information and Extended Data are available in the online version of the paper.
Acknowledgements
The authors wish to thank Michele Bertelli, Duncan Farquharson, Derek Halpin, Alexandra Hastings, David Howett, Nadia Khan, Paige Mumford, Alice O’Leary, Bill Potter, Sami Richards and Richard Wu for their contribution to this work.
This work was supported by grants from the Wellcome Trust and the Gatsby Charitable Foundation to JOK. RW is an MRC Clinical Research Training Fellow, JK was a Wellcome Trust/Royal Society Sir Henry Dale Fellow. DC is funded by the Cambridge NIHR Biomedical Research Centre and by the Wellcome Trust.
Footnotes
Data availability
All relevant data are included within the manuscript and the Extended Data. Additional information regarding methods, including trial protocols, are included here in the Methods and Extended Data Figure 2. The original and/or analysed data sets generated during the current study, and any further methodological details required, are available from the corresponding author upon request.
Code availability
The Custom Software (written in LabView) used to run the maze trials is available from the corresponding author upon request.
Author Contributions
J.O.K conceived the maze and the study. J.O.K., M.B., J.K., and S.B. were instrumental in designing, building and testing prototypes of the maze, with input from D.F. and D.H. (acknowledged above). J.K. and M.B. designed the custom-made software used to operate the maze. R.W. designed testing schedule 1 for the control experiment, and A.D. and J.O.K. designed testing schedule 2 for the lesion experiment. A.D. and S.B. performed the hippocampal lesion and sham lesion surgeries. R.W. acquired the behavioral data. R.W. and A.D. performed the histology for the lesion experiment, and R.W. measured hippocampal lesion volumes. R.W. conducted the data management and performed the statistical analyses. J.K., S.B. and J.O.K. collected the single unit data and J.K. and J.O.K. analysed these data. J.O.K. and R.W. wrote the manuscript with contributions to later drafts from all other authors.
Author Information
Reprints and permissions information is available at www.nature.com/reprints.
The authors declare no competing financial interests.
Authors’ note on Honeycomb Maze availability
We have designed the maze to be as simple as possible so that individual laboratories with access to a machine shop can build it. We will make all detailed methods and materials on Honeycomb Maze building and control available upon request. We are currently seeking a manufacturer who will build mazes at a reasonable cost if there is sufficient demand.
References
- 1.Morris RGM. Spatial localization does not require the presence of local cues. Learning and motivation. 1981;12:239–260. [Google Scholar]
- 2.Morris RG, Garrud P, Rawlins JN, O'Keefe J. Place navigation impaired in rats with hippocampal lesions. Nature. 1982;297:681–683. doi: 10.1038/297681a0. [DOI] [PubMed] [Google Scholar]
- 3.Morris R. Developments of a water-maze procedure for studying spatial learning in the rat. J Neurosci Methods. 1984;11:47–60. doi: 10.1016/0165-0270(84)90007-4. [DOI] [PubMed] [Google Scholar]
- 4.O'Keefe J, Nadel L. The hippocampus as a cognitive map. Oxford University Press; 1978. [Google Scholar]
- 5.O'Keefe J, Dostrovsky J. The hippocampus as a spatial map. Preliminary evidence from unit activity in the freely-moving rat. Brain Res. 1971;34:171–175. doi: 10.1016/0006-8993(71)90358-1. [DOI] [PubMed] [Google Scholar]
- 6.Ranck JB. Head-direction cells in the deep cell layers of the dorsal presubiculum in freely moving rats. Soc Neurosci Abstr. 1984;10:599. [Google Scholar]
- 7.Taube JS, Muller RU, Ranck JB., Jr Head-direction cells recorded from the postsubiculum in freely moving rats. I. Description and quantitative analysis. J Neurosci. 1990;10:420–435. doi: 10.1523/JNEUROSCI.10-02-00420.1990. [DOI] [PMC free article] [PubMed] [Google Scholar]
- 8.Hafting T, Fyhn M, Molden S, Moser MB, Moser EI. Microstructure of a spatial map in the entorhinal cortex. Nature. 2005;436:801–806. doi: 10.1038/nature03721. [DOI] [PubMed] [Google Scholar]
- 9.Lever C, Burton S, Jeewajee A, O'Keefe J, Burgess N. Boundary vector cells in the subiculum of the hippocampal formation. J Neurosci. 2009;29:9771–9777. doi: 10.1523/JNEUROSCI.1319-09.2009. [DOI] [PMC free article] [PubMed] [Google Scholar]
- 10.Solstad T, Boccara CN, Kropff E, Moser MB, Moser EI. Representation of geometric borders in the entorhinal cortex. Science. 2008;322:1865–1868. doi: 10.1126/science.1166466. [DOI] [PubMed] [Google Scholar]
- 11.O'Keefe J. In: The Hippocampus Book. Morris R, Andersen P, Amaral D, Bliss T, O’Keefe J, editors. Oxford University Press; 2007. pp. 471–544. Ch. 8. [Google Scholar]
- 12.Moser MB, Rowland DC, Moser EI. Place cells, grid cells, and memory. Cold Spring Harb Perspect Biol. 2015;7 doi: 10.1101/cshperspect.a021808. a021808. [DOI] [PMC free article] [PubMed] [Google Scholar]
- 13.Dudchenko PA. How do animals actually solve the T maze? Behav Neurosci. 2001;115:850–860. [PubMed] [Google Scholar]
- 14.Olton DS, Walker JA, Gage FH. Hippocampal connections and spatial discrimination. Brain Res. 1978;139:295–308. doi: 10.1016/0006-8993(78)90930-7. [DOI] [PubMed] [Google Scholar]
- 15.Olton DS, Samuelson RJ. Remembrance of Places Passed: Spatial Memory in Rats. Journal of Experimental Psychology: Animal Behavior Processes. 1976;2:97–116. [Google Scholar]
- 16.Barnes CA. Memory deficits associated with senescence: a neurophysiological and behavioral study in the rat. J Comp Physiol Psychol. 1979;93:74–104. doi: 10.1037/h0077579. [DOI] [PubMed] [Google Scholar]
- 17.O'Keefe J. In: Brain and Space. Paillard J, editor. Oxford University Press; 1991. pp. 273–295. [Google Scholar]
- 18.O'Keefe J. In: Language and Space. Bloom P, Peterson M, Nadel L, Garrett M, editors. MIT Press; 1996. pp. 277–316. [Google Scholar]
- 19.Eichenbaum H, Stewart C, Morris RG. Hippocampal representation in place learning. J Neurosci. 1990;10:3531–3542. doi: 10.1523/JNEUROSCI.10-11-03531.1990. [DOI] [PMC free article] [PubMed] [Google Scholar]
- 20.Morris RGM. Spatial localisation does not depend on the presence of local cues. Learning and Motivation. 1981;12:239–260. [Google Scholar]
- 21.Hollup SA, Molden S, Donnett JG, Moser MB, Moser EI. Accumulation of hippocampal place fields at the goal location in an annular watermaze task. J Neurosci. 2001;21:1635–1644. doi: 10.1523/JNEUROSCI.21-05-01635.2001. [DOI] [PMC free article] [PubMed] [Google Scholar]
- 22.Hull CL. The goal gradient hypothesis and maze learning. Psychological review. 1932;39:19. [Google Scholar]
- 23.Dashiell JF. Direction orientation in maze running by the white rat. Comparative Psychology Monographs. 1930;7 [Google Scholar]
- 24.Spence KW. The order of eliminating blinds in maze learning by the rat. Journal comparative psychology. 1932;14:9. [Google Scholar]
- 25.O'Keefe J, Speakma A. Single unit activity in the rat hippocampus during a spatial memory task. Exp Brain Res. 1987;68:1–27. doi: 10.1007/BF00255230. [DOI] [PubMed] [Google Scholar]
- 26.Sarel A, Finkelstein A, Las L, Ulanovsky N. Vectorial representation of spatial goals in the hippocampus of bats. Science. 2017;355:176–180. doi: 10.1126/science.aak9589. [DOI] [PubMed] [Google Scholar]
- 27.O’Keefe J. A computational theory of the hippocampal cognitive map. Prog Brain Res. 1990;83:301–12. doi: 10.1016/s0079-6123(08)61258-3. [DOI] [PubMed] [Google Scholar]
Associated Data
This section collects any data citations, data availability statements, or supplementary materials included in this article.


