

SUMMARY
Enhancer of Zeste 2 (EZH2) is the enzymatic subunit of Polycomb Repressive Complex 2 (PRC2), which catalyzes histone H3 lysine 27 trimethylation (H3K27me3) at target promoters for gene silencing. Here, we report that EZH2 activates androgen receptor (AR) gene transcription through direct occupancy at its promoter. Importantly, this activating role of EZH2 is independent of PRC2 and its methyltransferase activities. Genome-wide assays revealed extensive EZH2 occupancy at promoters marked by either H3K27ac or H3K27me3, leading to gene activation or repression, respectively. Last, we demonstrate enhanced efficacy of enzymatic EZH2 inhibitors when used in combination with AR antagonists in blocking the dual roles of EZH2 and suppressing prostate cancer progression in vitro and in vivo. Taken together, our study reports EZH2 as a transcriptional activator, a key target of which is AR, and suggests a drug-combinatory approach to treat advanced prostate cancer.
Graphical Abstract
In Brief
Kim et al. report EZH2 as a transcriptional activator that directly induces AR gene expression in a Polycomb- and methylation-independent manner, providing a mechanism to escape enzymatic EZH2 inhibitors. Combination of inhibitors with AR-targeted therapies showed a strong synergy in blocking the EZH2 downstream pathways and suppressing prostate cancer progression.
INTRODUCTION
Prostate cancer (PCa) is the most frequently diagnosed cancer and the third most frequent cause of cancer deaths in United States males (Siegel et al., 2015). PCa patients have benefitted from androgen deprivation therapies (ADTs) and small molecular inhibitors targeting the androgen receptor (AR). However, 30% of patients have primary resistance to both forms of treatment, and the majority of patients progress from androgen-dependent PCa (ADPC) to castration-resistant PCa (CRPC). The AR remains a key driver of CRPC through aberrant activation in the milieu of low androgen.
Enhancer of Zeste 2 (EZH2) is a bona fide oncogene that is among the most highly upregulated genes in CRPC relative to localized PCa (Varambally et al., 2002). EZH2 is a core subunit of the Polycomb Repressive Complex 2 (PRC2), which also contains embryonic ectoderm development (EED) and suppressor of zeste 12 (SUZ12). EZH2 is the catalytic member of PRC2 and contains a C-terminal su(var)3–9, enhancer-of-zeste and trithorax (SET) domain that specifically catalyzes histone H3 lysine 27 trimethylation (H3K27me3), leading to epigenetic (defined as histone modifications) silencing of many tumor suppressor genes (Yu et al., 2010; Zhao et al., 2012).
Interestingly, evidence has emerged recently that suggests noncanonical roles of EZH2 in various cancers. For example, in addition to histone H3, EZH2 has been shown to methylate nonhistone substrates, such as Jarid2 and STAT3, to regulate their transcriptional activities (He et al., 2012; Sanulli et al., 2015). EZH2 can also methylate RORα and PLZF, in which cases the methylation leads to target protein degradation (Lee et al., 2012; Vasanthakumar et al., 2017). Moreover, several studies have reported that EZH2 can also act independently of PRC2 and/or its histone methyltransferase activities. For instance, in estrogen receptor-negative breast cancer, EZH2 forms a complex with RelA and RelB to activate nuclear factor κB (NF-κB) signaling, which does not involve methylation (Gonzalez et al., 2011). Similarly, EZH2 interacts with the SWI and SNF complex (Kim et al., 2015) in a PRC2-independent manner to activate target genes. In PCa, EZH2 has been shown to interact with the AR in CRPC, but not ADPC, to activate gene expression through a PRC2-independent but methylation-dependent mechanism (Xu et al., 2012). The precise mechanism and target genes remain unclear.
In the present study, we identify the AR as a direct target of EZH2-mediated transcriptional activation in both ADPC and CRPC. This activation is independent of PRC2 as well as its methyltransferase activity but requires EZH2 occupancy at the AR promoter. AR-driven PCa depends on dual roles of EZH2: its conventional role in epigenetic silencing of tumor suppressor genes as well as its newly discovered role in activating AR and downstream signaling. Significantly, an enzymatic EZH2 inhibitor in combination with an AR antagonist led to significant suppression of PCa growth in vitro and in vivo.
RESULTS
EZH2 Enhances Androgen Signaling in PCa
We recently reported a role of EZH2 in collaborating with the AR on transcriptional repression (Zhao et al., 2012). Importantly, gene set enrichment analysis (GSEA) and Venn diagrams also showed inhibition of androgen-induced genes by EZH2 knockdown compared with control cells (Figures 1A, 1B, S1A, and S1B). This AR-equivalent role of EZH2 in regulating global androgen signaling was confirmed in additional PCa cell lines (Figure S1C). Moreover, qRT-PCR confirmed that AR-induced genes such as PSA, TMPRSS2, and FKBP5 were indeed remarkably downregulated upon EZH2 knockdown using two independent small interfering RNAs (siRNAs) (Figure 1C) and confirmed in additional PCa lines (Figure 1D). Conversely, EZH2 overexpression in LNCaP and LAPC4 cells increased the expression of AR-induced genes (Figures 1E and 1F). To examine this regulatory pathway in CRPC cells, we performed EZH2 knockdown in the CRPC cell line C4–2B with both siRNAs and observed similar effects (Figure 1G), which was confirmed in an additional CRPC line, 22Rv1, also with small hairpin RNA (shRNA)-mediated knockdown of EZH2 (Figure 1H). Therefore, we demonstrate robust regulation of AR target genes by EZH2 in both ADPC and CRPC cells.
Figure 1. EZH2 Enhances Androgen Signaling in Both ADPC and CRPC Cells.

(A and B) Androgen-induced genes (A) are enriched for downregulation upon EZH2 knockdown (false discovery rate [FDR] q < 0.001), whereas androgen-repressed genes (B) are enriched for upregulation upon EZH2 knockdown (FDR q < 0.001). GSEA was utilized to examine the expression of androgen (R1881)-induced and -repressed gene sets, obtained from a previous study (Zhao et al., 2012), in LNCaP cells treated with control (siCtrl) and EZH2 knockdown (siEZH2), as profiled by microarrays. (C and D) EZH2 knockdown inhibits AR-induced genes. LNCaP cells (C) were transfected with siCtrl or two different siEZH2s, and LAPC4 (D) cells were transfected with siCtrl or a representative siEZH2. Cells were then analyzed by qRT-PCR. Data were normalized to GAPDH. Data shown are mean (±SEM) of technical replicates from one representative experiment of three.
(E and F) EZH2 overexpression increases AR-induced genes. LNCaP (E) and LAPC4 (F) cells were infected with cytomegalovirus (CMV) control or an EZH2-expressing adenovirus and analyzed by qRTPCR. Data were normalized to GAPDH. Data shown are mean (±SEM) of technical replicates from one representative experiment of three.
(G and H) EZH2 knockdown reduces AR-induced genes in CRPC cells. (G) 22Rv1 and (H) C4–2B cells were infected with control shRNA or shEZH2 or transfected with either siCtrl or two different siEZH2s and then subjected to qRT-PCR analysis. Data were normalized to GAPDH. Data shown are mean (±SEM) of technical replicates from one representative experiment of three.
EZH2 Positively Regulates AR mRNA and Protein Levels
Next we attempted to investigate the molecular mechanisms by which EZH2 enhances androgen signaling in PCa cells. Previous studies reported that EZH2 activates gene expression through physical interaction with the AR protein (Xu et al., 2012). To examine this, we performed co-immuno-precipitation (coIP) experiments in LNCaP cells and found that, although SUZ12 interacts with EZH2 as expected, the AR failed to interact with EZH2 (Figure S2A). To preclude the potential of antibody competition and masking protein interaction during coIP experiments, we performed coIP using EZH2 and AR N- and C terminus-targeting antibodies. However, we did not observe EZH2 and AR interaction in LNCaP cells (Figure S2B), suggesting that physical interaction with AR is not required for EZH2 to induce androgen signaling.
Because EZH2 increases androgen-induced genes but decreases androgen-repressed genes, exhibiting an AR-like effect, we wondered whether EZH2 regulates AR expression. Importantly, qRT-PCR and western blot analysis of LNCaP cells subjected to control and two independent EZH2-targeting RNA interferences revealed a drastic decrease of the AR at both the mRNA and protein levels (Figure 2A), whereas EZH2 knockdown restored the expression of its previously reported epigenetic targets such as SLIT2 and CNR1 (Figure S2C). This downregulation of the AR but upregulation of epigenetic targets by EZH2 knockdown was observed in additional ADPC and CRPC cell lines (Figures 2B–2D and S2D–S2F). To further validate this regulatory pathway, we performed EZH2 overexpression in androgen-dependent PCa cell lines, which have a relatively lower amount of endogenous EZH2. qRT-PCR and western blot analysis confirmed that EZH2 overexpression indeed increased both the AR transcript and protein levels in these already AR-high cell lines (Figures 2E and 2F) and decreased its epigenetic targets, as expected (Figures S2G and S2H). Therefore, our data strongly support that EZH2 increases AR gene expression at both the mRNA and protein levels.
Figure 2. EZH2 Increases AR mRNA and Protein Levels.

(A–D) EZH2 knockdown decreases AR mRNA and protein levels. LNCaP (A), LAPC4 (B), C4–2B (C), and 22RV1 (D) cells were transfected with control or siEZH2s or infected with control shRNA or shEZH2, followed by qRT-PCR (left) and western blot analysis (right). Data shown are mean (±SEM) of technical replicates from one representative experiment of three.
(E and F) EZH2 overexpression increases AR mRNA and protein levels. LNCaP (E) and LAPC4 (F) cells were infected with CMV or an EZH2-expressing adenovirus for 48 hr, followed by qRT-PCR (left) and western blot analysis (right). Data shown are mean (±SEM) of technical replicates from one representative experiment of three.
EZH2 Occupies the AR Promoter to Directly Induce Its Transcription
Although EZH2, as a core subunit of the PRC2 complex, is best known as an epigenetic silencer, recent evidence has suggested that EZH2 might also function as a transcriptional activator (Gonzalez et al., 2011; Xu et al., 2012). Because our data showed concordant changes at the AR mRNA and protein levels upon EZH2 deregulation, it is likely that this regulation occurs at the step of AR transcription. Moreover, in cells treated with actinomycin D, which halts active transcription, we observed comparable AR mRNA levels over time between control and EZH2-depleted LNCaP cells (Figure S3A), precluding EZH2 regulation of AR transcript levels through altering its mRNA stability. To investigate whether EZH2 protein directly occupies the AR promoter, we performed EZH2 chromatin immunoprecipitation sequencing (ChIP-seq) in LNCaP cells and observed apparent EZH2 occupancy 1 kb downstream (around exon 1) of the AR gene transcription start site (TSS) (Figure 3A; Figure S3B). Using an independent antibody, we conducted hemagglutinin (HA) ChIP-seq in LNCaP cells with HA-EZH2 overexpression in duplicate experiments and observed that ectopic EZH2 also binds to the same region on the AR promoter. As controls, ChIP-seq confirmed EZH2 occupancy on previously reported target genes such as CNR1, NOV, and SLIT2 (Yu et al., 2010; Zhao et al., 2012; Figure S3C).
Figure 3. EZH2 Directly Activates AR Gene Transcription.

(A) EZH2 protein occupies the AR gene promoter. EZH2 ChIP-seq was performed in LNCaP cells with an antibody targeting endogenous EZH2 (top). HA ChIP-seq was performed using an anti-HA antibody in LNCaP cells with ectopic HA-EZH2 overexpression. Two biological replicates are shown (center and bottom).
(B) ChIP-qPCR showing EZH2 binding along the AR gene promoter. ChIP was performed in LNCaP cells using anti-EZH2 and IgG antibodies and then subjected to qPCR using primer pairs targeting ~60-bp sliding windows within −1 kb to +3 kb of the AR gene. The x axis indicates the central location of the PCR products relative to the AR TSS. Data shown are mean (±SEM) of technical replicates from one representative experiment of three.
(C) Different regions (of 400 bp) of the AR promoter (from 0 to +3 kb) were cloned into the pRetroX-Tight-Pur-Luc vector and transfected into 293T cells, which were then subjected to ChIP by anti-EZH2 or IgG. EZH2 occupancy at the ectopically expressed AR promoter was determined by qPCR using a common forward primer targeting the vector sequence and a reverse primer specific to each fragment. Data shown are mean (±SEM) of technical replicates from one representative experiment of two.
(D) Various AR promoter regions were cloned into the pGL4.10 vector and transfected into 293T cells with either control pLVX or HA-EZH2 overexpression. Cells were then subjected to luciferase reporter assays. Results were normalized to the Renilla internal control. Data shown are mean (±SEM) of technical replicates from one representative experiment of three.
(E) Schematic view of the AR promoter sequence starting from the transcription start site (TSS). The sgRNAs were labeled sgAR1 to 4, their sequences are shown in green font, and their distances to the AR TSS are marked as numbers. The primers (F2 and R2) for PCR validation are shown in purple.
(F and G) The distal AR promoter region is required for EZH2 activation of AR transcription. LNCaP cells were infected with lentiCRISPR-Cas9 containing the pLENTI.V2 control, sgAR1+2, sgAR3+4, or sgAR1+4 for 48 hr. CRISPR-Cas9-mediated genome editing was confirmed by Sanger sequencing (F) and genomic DNA PCR (G) using primers F2 and R2 (indicated in A and E).
(H) CRISPR-Cas9-edited LNCaP cells were transfected with control or EZH2-targeting siRNA for 48 hr. Total RNA was harvested and subjected to RT-PCR analysis using F2 and R2, which are expected to yield a wild-type (AR WT, top band with black asterisk) and a CRISPR-Cas9-deleted (AR del, bottom bands with red asterisk) AR mRNA.
To validate the ChIP-seq results, qPCR analysis in primer walking experiments demonstrated strong EZH2 enrichment, compared with the immunoglobulin G (IgG) control, by primer pairs flanking the +1.4, +1.7, +2.1, and +2.6 kb regions of the AR promoter, further supporting EZH2 occupancy at this region (Figure 3B). To further examine the ability of AR promoter sequences to recruit EZH2 protein, we created an artificial system by transfecting 293T cells with various AR promoter fragments spanning 400-bp windows from 0.4 to 2.3 kb downstream of the AR TSS. To determine whether EZH2 is recruited to these exogenous DNA fragments, we performed EZH2 ChIP-qPCR using a forward primer that targets the plasmid backbone and a reverse primer that targets the inserted AR promoter fragment. Our data showed that EZH2 is strongly enriched at the ectopically expressed 1.2–1.6 kb and 1.8–2.3 kb AR promoter fragments, supporting some specificity of these DNA regions in recruiting the EZH2 protein (Figure 3C).
To determine whether the EZH2-bound AR promoter regions are indeed involved in EZH2-induced AR gene transcription, we generated three luciferase reporter constructs containing the 1.1–1.7 kb, 1.7–2.5 kb, and 1.1–2.5 kb regions of the AR promoter. Luciferase reporter assays demonstrated that EZH2 over-expression induced the transcriptional activities of distal AR promoter-containing constructs (i.e., 1.7–2.5 kb and 1.1–2.5 kb) but not the 1.1–1.7 kb construct (Figures 3D and S3D). These data suggest that, although EZH2 occupies both proximal (centered at +1.4 kb) and distal (centered at +2.0 kb) AR promoter regions, as indicated by ChIP-seq data, the regulatory function is dependent on the distal promoter. To identify potential transcription cofactors that might facilitate EZH2 in activating the AR, we performed a motif analysis of the AR promoter (from 0 to +2,500 bp to the AR TSS) using Jaspar and identified a total of 2,031 motifs (Table S1). In particular, there are 127 motifs within the AR distal promoter, among which are transcription activators such as SP1 and KLF5 that are known to bind GC-rich regions (Höller et al., 1988; Wei et al., 2018).
Next, we took one further step to characterize the significance of these EZH2-occuped AR promoter regions in the regulation of AR transcription in vivo by using the CRISPR-Cas9 system. Four single-guide RNAs (sgARs) were designed and paired to delete the downstream proximal AR promoter, the distal AR promoter, or both and were inserted into Cas9-containing lentiviral vectors (Figure 3E). Because the AR is crucial for LNCaP cell growth and the sgAR-targeted promoters overlap with the first exon of the AR gene, which will inadvertently knock out AR expression and lead to cell death, we opted not to select a pure population of CRISPR-mediated AR knockout cells for this experiment. LNCaP cells were infected with Cas9-sgAR lentiviruses, and genomic DNA was isolated from the pooled cells. Sanger sequencing using primers (F2 and R2 in Figures 3A and 3E) flanking the sgAR-targeted regions confirmed CRISPR-Cas9-mediated deletion at the expected sites (Figure 3F). Further, PCR analysis of genomic DNA confirmed the presence of a wild-type AR in all cells and a shorter PCR product of the expected size in CRISPR-Cas9-edited cells (Figure 3G). To examine how deletion of various AR promoter regions impairs the ability of EZH2 to activate the AR, control and CRISPR-Cas9-edited cells were subjected to control and EZH2 knockdown (Figure S3E). Because all sgARs also target the 5′ UTR and exon 1 of the AR gene, the primer set (F2 and R2) that was used to monitor genomic deletion at the AR promoter was also utilized to analyze AR mRNA expression and yielded wild-type AR and CRISPRCas9-deleted AR mRNA products (Figure 3H). Importantly, although EZH2 depletion reduced the levels of wild-type and CRISPR-Cas9-edited AR mRNA in cells with deletion of the AR proximal promoter (sgAR1+2), it failed to decrease the levels of CRISPR-Cas9-edited AR mRNA in cells with distal promoter deletion (sgAR3+4 or sgAR1+4), suggesting that EZH2 activates the AR through its distal promoter. Interestingly, in these cells, we found that the CRISPR-Cas9-deleted AR mRNA is surprisingly increased upon EZH2 knockdown, suggesting that EZH2 could repress AR expression through regulatory elements beyond the distal promoter. These results are consistent with our conclusion that EZH2 plays dual roles in its regulation of AR signaling and PCa.
EZH2 Activates the AR Independently of PRC2 and Its Histone Methyltransferase Activity
Our data so far suggest that EZH2 directly induces AR transcription through promoter binding. However, because the primary role of EZH2 is to catalyze H3K27me3, we wanted to test whether EZH2 activation of the AR is dependent on this catalytic function. First, we analyzed ChIP-seq data and observed EZH2, but not H3K27me3, occupancy at the AR promoter, suggesting a methylation-independent function (Figure 4A). Further, the presence of the active histone mark H3K27 acetylation (H3K27ac) supports that this is an actively transcribed gene. By contrast, strong EZH2 and H3K27me3 occupancy and lack of the active histone mark H3K27ac were found at the promoter of the EZH2 epigenetic target SLIT2. ChIP-PCR confirmed differential H3K27me3 and H3K27ac enrichment at the AR and SLIT2 promoters in LNCaP as well as in C4–2B cells (Figures S4A and S4B). Our data thus suggest that EZH2 occupancy does not lead to H3K27me3 at the AR promoter but, rather, co-exists with H3K27ac, supporting gene activation. To demonstrate that activation of the AR by EZH2 is PRC2-independent, we performed EZH2, SUZ12, or AR knockdown side by side in LNCaP and C4–2B cells by shRNA transfection for 48 hr. Importantly, EZH2 knockdown mimicked AR knockdown in decreasing AR and prostate-specific antigen (PSA) expression in both LNCaP and C4–2B cells (Figure 4B). By contrast, SUZ2 knockdown, despite its ability to decrease total EZH2 protein levels, consistent with the previously reported regulation of PRC2 stability (Pasini et al., 2004), failed to decrease AR and PSA in both cell lines tested, whereas it successfully decreased H3K27me3 levels similar to EZH2 knockdown. Taken together, these results suggest that short-term SUZ12 knockdown did not affect EZH2 outside of the PRC2 complex and that EZH2 activates AR transcription through PRC2-independent mechanisms.
Figure 4. EZH2 Activates the AR Independently of Its Histone Methyltransferase Activity.

(A) The AR promoter is occupied by EZH2 and H3K27ac but not H3K27me3, whereas the promoter of SLIT2, an epigenetic target of EZH2, is occupied with EZH2 and H3K27me3 but not H3K27ac. HA-EZH2 ChIP-seq was performed using anti-HA in LNCaP cells with HA-EZH2 overexpression. H3K27me3 and H3K27ac ChIP-seq was performed in LNCaP cells.
(B) EZH2, but not SUZ12, decreased AR expression levels. LNCaP or C4–2B cells were infected with pLKO.1V, shEZH2, shSUZ12, or shAR for 48 hr, and cell lysates were subjected to western blot analysis.
(C–F) EZH2 methyltransferase inhibitors failed to abolish AR expression. LNCaP cells were treated with EZH2 inhibitors GSK126 (C and D) or EPZ (E) for 72 hr, and the cell lysates were subjected to western blot (C and D) and qRT-PCR (E and F) analyses. The data shown in (E) and (F) are mean (±SEM) of technical replicates from one representative experiment of three.
(G and H) Both WT and the catalytically dead mutant H689A of EZH2 rescued AR expression. LNCaP cells were subjected to EZH2 knockdown (siEZH2), followed by re-introduction of WT or mutant (H689A) EZH2 for 72 hr. Cell lysates were then collected and analyzed by qRT-PCR (G) or western blotting (H).
(I) Both WT and H689A EZH2 are able to bind to the AR promoter. LNCaP cells were infected with pLVX control, HA-EZH2 WT, or HA-EZH2 H689A for 48 hr and then subjected to HA ChIP-qPCR. SLIT2 was used as a positive control and KIAA0066 as a negative control. Data shown are mean (±SEM) of technical replicates from one representative experiment of three. Overexpression of the HA-tagged WT and H689A EZH2 were validated by western blot (inset).
To further demonstrate that EZH2 induces AR expression independently of H3K27me3, we took advantage of catalytic EZH2 inhibitors such as GSK126 and EPZ-6438 (EPZ), which compete with S-adenosyl-methionine (SAM) to prevent H3K27me3. LNCaP cells were treated with increasing doses (0, 0.1, and 1 μM) of GSK126 for 3 days. Western blot analysis demonstrated that AR and PSA levels were not only not decreased but also slightly increased upon catalytic EZH2 inhibition, whereas H3K27me3 showed a dose-dependent reduction, as expected (Figures 4C and S4C). This increase in AR signaling by the enzymatic EZH2 inhibitor is consistent with a recent report (Ku et al., 2017), potentially because of the AR also being an epigenetic target of EZH2. Similar results were also observed in cells treated with EPZ (Figure 4D). As a control, qRT-PCR analysis confirmed restored expression of previously reported EZH2 epigenetic targets such as SLIT2 CNR1 and NOV (Figures 4E, 4F, and S4D).
Because small-molecule inhibitors might have off-target effects, we next examined the regulatory mechanism utilizing an EZH2 catalytically dead mutant, H689A. LNCaP cells were treated with control or EZH2-targeting siRNA to deplete endogenous EZH2, which was then subjected to rescue using wild-type or H689A-mutant EZH2. For this experiment, the siEZH2 that targets the 5′ UTR of the EZH2 region was utilized to prevent it from degrading ectopic EZH2. qRT-PCR analysis showed that both wild-type and H689A-mutant EZH2 restored the AR mRNA level in EZH2-depleted cells, supporting methylation-independent transcriptional activation of the AR gene by EZH2 (Figure 4G). Western blot analysis further confirmed that the AR protein level was decreased upon endogenous EZH2 knockdown, as expected, and could be rescued by re-expression of either wild-type or H689A-mutant EZH2 (Figure 4H). By contrast, H3K27me3 is decreased upon endogenous EZH2 knockdown and, as expected, can only be rescued by re-introduction of wild-type EZH2 but not the H689A catalytically dead mutant. In good agreement with this, HA ChIP-qPCR revealed that, like wild-type EZH2, the ectopically expressed H689A mutant also strongly binds to the AR gene promoter (Figure 4I). Therefore, our data provide strong evidence that EZH2 directly induces AR gene expression through PRC2- and methylation-independent mechanisms that cannot be blocked by enzymatic EZH2 inhibitors.
EZH2 Mediates Dual Transcription Programs in PCa
Our data so far suggest that EZH2 plays dual roles in PCa: as a transcriptional activator, mediated in part by the AR, and as an epigenetic silencer, mediated by H3K27me3. To further examine these dual transcriptional programs on the genome-wide scale, we performed a global expression analysis of LNCaP cells treated with control or EZH2 knockdown in parallel with LNCaP cells treated with the DMSO control or EPZ. All experiments were performed in triplicate. We identified 359 genes that were significantly increased (adjusted p < 0.01) upon EZH2 depletion (Figure 5A). Importantly, 224 (62%) of these EZH2-repressed genes were upregulated by treatment with EPZ, an inhibitor of EZH2 histone methyltransferase function, supporting their being tar gets of EZH2-mediated epigenetic silencing. On the other hand, gene expression analysis revealed 393 genes (adjusted p < 0.0005), including the AR and its target genes, such as TMPRSS2 and KLK2, that were downregulated upon EZH2 depletion. Interestingly, the expression of the majority of these EZH2-activated genes was not changed upon EPZ treatment, supporting a methylation-independent mechanism in EZH2-mediated gene activation (Figure 5A). These dual functions of EZH2 in epigenetic silencing and gene activation were also validated in C4–2B cells (Figure S5A).
Figure 5. Methylation-Dependent and -Independent Transcriptional Programs of EZH2 in Prostate Cancer.

(A) Dual EZH2 transcriptional programs in prostate cancer (PCa). LNCaP cells were treated with either EPZ versus vehicle control or siEZH2 versus siCtrl and then profiled in triplicate microarray experiments. Genes that were significantly up- or downregulated by siEZH2 compared with the control were clustered across all samples and are shown as heatmaps. Each row represents one gene and each column one sample. The siEZH2-induce genes that were also induced by EPZ were termed class I genes and those unchanged by EPZ class II genes. Genes that were activated by EZH2 were defined as class III genes.
(B) EZH2-regulated genes that contain at least one EZH2 ChIP-seq binding site at their promoter regions (±5 kb) were defined as direct targets of EZH2. H3K27ac and H3K27me3 ChIP-seq was performed in LNCaP cells with siCtrl or siEZH2, and their intensities around the three classes of direct EZH2-target genes were analyzed by boxplots. The p values evaluate the differences of ChIP-seq signals in siEZH2 versus siCtrl cells.
(C) All EZH2 binding sites identified in control LNCaP cells were rank-ordered based on EZH2 ChIP-seq intensities. Shown at the top are average intensities, and at the bottom are heatmaps of EZH2, H3K27ac, and H3K27me3 ChIP-seq around all EZH2 binding sites.
(D) Venn diagram showing overlap among EZH2, H3K27ac, and HEK27me3 binding sites. ChIP-seq was performed in control LNCaP cells.
(E) EZH2 target genes marked with H3K27ac are abundantly expressed, whereas those marked by H3K27me3 are repressed. Genes whose promoters (±1 kb to the TSS) contain at least one EZH2 binding site with a peak score greater than 12 were selected. The subset (1,415) marked by H3K27ac, but not H3K27me3, was defined as EZH2-ac genes, whereas the subset (1,294) marked by H3K27me3, but not H3K27ac, was defined as EZH2-me genes. The expression levels (FPKM) of these genes in publicly available RNA-seq data (GSM3018523 and GSM3018524) that were performed in LNCaP cells are shown as boxplots.
(F) EZH2-me genes are enriched for upregulation by EZH2 knockdown or EPZ treatment, whereas EZH2-ac genes are enriched for downregulation by EZH2 knockdown independently of EPZ. About 800 of 1,415 (57%) EZH2-ac genes, but only 60 of 1,294 (4.6%) EZH2-me genes, were detected in microarray experiments. The percentages of the genes that were significantly up- or downregulated by siEZH2 compared with siCtrl or by EPZ treatment compared with DMSO were calculated and plotted.
Next we sought to gain some insights into the mechanisms underlying EZH2-mediated gene regulation. We found that EZH2-repressed and EPZ-induced genes (class I) had the strongest H3K27me3 enrichment at their promoters, whereas EZH2-activated genes (class III) were barely enriched for H3K27me3 (Figure S5B). On the contrary, class III genes were marked with strong H3K27ac, whereas class I genes were marked the weakest. Because our H3K27me3 ChIP-seq intensity was relatively low, we compared it with previously published H3K27me3 ChIP-seq data (Xu et al., 2012). We observed a significant overlap between the datasets, supporting the quality and reproducibility of our data (Figure S5C). To examine how histone modifications on these genes change upon EZH2 knockdown, we selected EZH2 target genes that contained at least one EZH2 binding site at their promoters (Figure S5D). We found that class I and II (EZH2-repressed but EPZ-independent) genes showed increased H3K27ac upon EZH2 knockdown, whereas H3K27ac was decreased on class III genes (Figure 5B), consistent with their respective expressional regulation by EZH2. As a controls H3K27me3 was decreased upon EZH2 knockdown in all three classes of genes, except that it was barely present on class III genes.
To examine whether the local chromatin environment affects the role of EZH2 as an activator or repressor, we rank-ordered all EZH2 binding sites in LNCaP cells by enrichment intensity and examined H3K27ac and H3K27me3 signals at these sites (Figures 5C and S5D). We observed that the strongest EZH2 binding sites were enriched for H3K27me3, as expected. Interestingly, there were many EZH2 binding sites that were marked by strong H3K27ac, which was nearly mutually exclusive with H3K27me3. We noticed that, although EZH2 knockdown decreased the EZH2 enrichment signal as expected, it did not alter H3K27ac and H3K27me3 globally. This is consistent with previous reports of persistent H3K27me3 on many loci upon EZH2 inactivation (Neff et al., 2012), likely because of compensation from EZH1 (Shen et al., 2008). A Venn diagram analysis revealed 8,125 (42%) and 6,449 (34%) EZH2 binding sites that, respectively, overlapped with H3K27me3 (termed EZH2-me) and H3K27ac (termed EZH2-ac), supporting association of EZH2 with both repressed and activated genes (Figure 5D). To examine whether these distinct chromatin patterns are accountable for differential regulation by EZH2, we focused on binding sites with an EZH2 ChIP-seq peak score greater than 12 and that localize within 1 kb of a TSS, leading to 1,294 and 1,415 EZH2-me and EZH2-ac genes, respectively. Analysis of RNA sequencing (RNA-seq) data (Zhang et al., 2018) revealed that genes marked with EZH2-ac were, in general, actively transcribed in LNCaP cells, whereas EZH2-me genes were often repressed, with FPKM (fragments per kilobase million) values of less than 1 (Figure 5E). Integration with microarray data showed that a significantly larger percentage of EZH2-me genes were upregulated than downregulated by EZH2 knockdown, and they were similarly regulated by EPZ, supporting their being epigenetic targets of EZH2 (Figure 5F). On the other hand, more EZH2-ac genes were decreased by EZH2 knockdown but not by EPZ, supporting that these genes are more likely to be activated by EZH2 through methylation-independent pathways. Further, gene ontology (GO) analysis showed that EZH2- ac genes are strongly enriched for cell cycle-related pathways, including mTORC1, MYC, p53, and E2F regulation (Table S2), whereas EZH2-me genes are involved in epithelial-mesenchymal transition (EMT), apical junction complex, and inflamma-tory responses (Table S3). Moreover, a motif analysis demonstrated that the promoters of EZH2-ac genes were enriched for motifs of transcription activators such as SP1 and KLF5, which were also identified in the AR promoter (Figure S5E). By contrast, the promoters of EZH2-me genes were enriched for motifs of transcriptional repressors such as RE1-silencing transcription factor (NRSF) and non-prostate lineage transcription factors such as E2A and LHX2, supporting their repressed state in PCa cells.
Last, we attempted to examine the presence of these dual EZH2 transcription programs in PCa cells. First, we obtained an epigenetic signature composed of genes that were restored following EPZ treatment. GSEA demonstrated that this epigenetic signature was remarkably enriched for higher expression by EZH2 knockdown in both androgen-depleted and androgen-stimulated cells (Figure S5F). These data support that EZH2-mediated epigenetic silencing is a general phenomenon that is independent of AR signaling. We have shown previously that, in the presence of androgen, androgen-induced genes were markedly downregulated upon EZH2 depletion, whereas androgen-repressed genes were upregulated (Figures 1A and 1B). However, in androgen-depleted cells, we found that androgen-induced genes were only marginally reduced by EZH2 knockdown (Figure S5G), suggesting a mechanism dependent on active AR signaling. Androgen-repressed genes, on the other hand, remained significantly upregulated upon EZH2 depletion, which is likely due to many of these genes also being epigenetic targets of EZH2 (Zhao et al., 2012). Further, qRT-PCR analysis of gene expression in hormone-deprived LNCaP cells confirmed that AR-induced genes were no longer regulated by EZH2 in the absence of active androgen signaling, whereas epigenetic EZH2 targets, such as CNR1, SNCA, and AR-repressed genes, continued to be upregulated upon EZH2 knockdown (Figure S5H). In conclusion, our data support an epigenetic role of EZH2 that is present in both androgen-dependent and -independent PCas and an AR-activating role of EZH2 that may be blocked by androgen deprivation therapy.
Complete Blockade of EZH2 Dual Functions Abolishes Prostate Tumorigenesis In vitro
Because EZH2 increases AR transcription, we examined co-expressed patterns of these two genes in human PCa samples and indeed observed that EZH2 and AR expression levels are significantly correlated in a number of publicly available cancer profiling datasets (Figure S6A). Cell growth assays of C4–2B cells demonstrated that EZH2 knockdown showed a much stronger growth-inhibitory effect than knockdown of SUZ12 and blockade of PRC2 epigenetic effects and of AR, blockade of AR signaling alone (Figure S6B). This suggests that full blockade of EZH2 function has stronger tumor-inhibitory effects than blocking either its catalytic function or its non-catalytic gene activation function alone. Because EZH2 degradation is not yet possible, in the present study, we attempted to combine an EZH2 enzymatic inhibitor that blocks its catalytic function with an AR antagonist that targets one key downstream pathway of the EZH2-activating role in PCa. We treated LNCaP cells with vehicle control, 0.5 μM GSK126, 0.5 μM enzalutamide (Enz), or both over a period of 60 days. When reaching 80% confluence, cells were counted, split in proportion, and cultured in media containing the corresponding drugs. Our results demonstrated that Enz-treated cells initially grew at a much slower rate, decreased in cell number at 10 days of treatment, but rapidly gained resistant growth after 15 days of treatment, whereas GSK126-treated cells continued to grow but at a slightly reduced rate. Remarkably, LNCaP cells treated with both drugs were reduced in number after 10 days of treatment and remained unable to grow, highlighting the potential of this drug combination to overcome resistance (Figure 6A). To further test the combinatorial effects of the drugs, we treated LNCaP and C4–2B cells with Enz and EPZ either alone or in combination. Because CRPC cells are much less sensitive to Enz than ADPC cells, a higher dose of Enz was utilized in C4–2B cells. Importantly, our data revealed strong combinatorial effects of EPZ and Enz treatment in suppressing the proliferation of both LNCaP and C4–2B cells (Figures 6B and 6C). Moreover, the drug combination also showed synergy in suppressing LNCaP and C4–2B cell colony formation (and in eliminating their colony formation ability) (Figures 6D and 6E). Cell cycle analysis by flow cytometry revealed that combined use of Enz and EPZ led to global cell cycle arrest at G0 and G1 and G2 and M phases, leading to a marked reduction in S phase cells (Figures 6F and 6G). Taken together, our data suggest that blockade of EZH2 dual functions through combined use of an enzymatic EZH2 inhibitor and an AR antagonist may overcome or delay the onset of drug resistance when treating PCa patients with either drug alone.
Figure 6. Simultaneous EZH2 and AR Targeting Remarkably Inhibited PCa Cell Growth.

(A) Combinatorial GSK126 and enzalutamide (Enz) treatment significantly inhibited LNCaP cell growth and drug resistance. LNCaP cells were maintained in DMSO, GSK126 (0.5uM), Enz (0.5uM), or both for 55 days. Cells were counted and re-plated whenever needed, and accumulated cell numbers were determined. Data shown are for one representative experiment of two.
(B and C) LNCaP (B) or C4–2B (C) cells were treated with DMSO, Enz (1 μM for LNCaP and10 μM for C4–2B), EPZ (1 μM), or both. Cell growth was measured with WST-1 reagent every 2 days. Data shown are mean ± SEM of technical replicates from one representative experiment of three.
(D and E) LNCaP (D) or C4–2B (E) cells were treated with DMSO, Enz (1 μM for LNCaP and 10 μM for C4–2B), EPZ (1 μM), or both for 2 weeks, followed by 0.002% crystal violet staining to assay colony formation. Data shown are technical replicates from one representative experiment of three.
(F and G) Combinatorial Enz and EPZ treatment induced cell cycle arrest. LNCaP (F) or C4–2B (G) cells were treated with DMSO, Enz (1 μM for LNCaP and 10 μM for C4–2B), EPZ (1 μM), or both for 3 days, followed by cell cycle analysis via flow cytometry with propidium iodide staining.
Dual EZH2 Targeting through Combinatorial Use of an Enzymatic EZH2 Inhibitor and AR Antagonist Diminished Xenograft Tumor Growth In vivo
To examine the molecular effects of the drug treatment, we performed RNA-seq analysis of C4–2B cells treated with either Enz or EPZ, alone or in combination, in triplicate experiments. Significantly, we found that EZH2-induced genes were downregulated only partially by either Enz or EPZ alone but were remarkably repressed by combinatorial treatment (Figure 7A). A similar synergy of these two drugs was also observed in their ability to restore EZH2-repressed gene expression. In addition, GO pathway analyses revealed that cancer cell cycle hallmarks, such as E2F_targets, G2M_checkpoint, Mitotic Spindle, and Myc_targets, were remarkably more enriched with drug combination than either EPZ or Enz alone (Table S4). Further, the androgen response gene signature is significantly inhibited by Enz alone but is induced by EPZ as a single agent (Figure S7A), which is consistent with the findings from Ku et al. (2017) and explains at least partially the failure of the enzymatic EZH2 inhibitor in PCa. However, this “side effect” of EPZ was blocked by Enz in the drug combination because the androgen response gene signature remained inhibited. Therefore, Enz and EPZ combination is much more effective in fully blocking the transcriptional activities of EZH2 than either drug alone, justifying further investigation of this combinatorial therapeutic strategy in in vivo models.
Figure 7. Combination of the Enzymatic EZH2 Inhibitor with Enz Markedly Reduced Xenograft Tumor Growth.

(A) EZH2-mediated transcription activities were blocked by combinatorial EPZ and Enz treatment. C4–2B cells were treated with DMSO, EPZ (1 μM), Enz (10 μM), or both for 7 days and then subjected to RNA-seq. FPKM values of EZH2-induced and -repressed gene sets across all samples were clustered and visualized as heatmaps.
(B and C) Enz and EPZ combination greatly reduced C4–2B xenograft tumor growth in vivo. C4–2B cells were implanted subcutaneously in surgically castrated NOD.SCID mice. Upon palpable tumor formation, the mice (n = 7/group) were randomized to receive vehicle (1% carboxymethylcellulose sodium [CMC-Na+] and 1% Tween 30), 10 mg/kg Enz (once a day), 250 mg/kg EPZ (twice a day), or both by oral gavage for 3 weeks. Tumor volume (B) and weight at the endpoint (C) were measured by a second person in a blinded fashion. Statistical differences in tumor volume and tumor weight among groups were determined using two-way repeated-measures ANOVA (p < 0.001) and one-way ANOVA (p < 0.02), respectively.
(D) Western blotting of target genes in C4–2B xenograft tumors at the endpoint.
(E) Representative H3K27me3 and Ki-67 immunohistochemistry images of tumor sections from each treatment group.
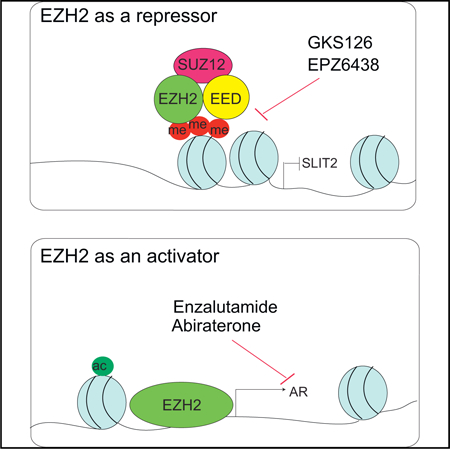
(F) A model depicting dual roles of EZH2 as an epigenetic silencer, a function that can be blocked by enzymatic inhibitors such as GSK126 and EPZ, and as a transcriptional activator of AR, which can be blocked by AR antagonists such as enzalutamide.
To investigate the efficacy of the Enz and EPZ combination in in vivo, CRPC cell line C4–2B cells were inoculated subcutaneously into non-obese diabetic (NOD).severe combined immunodeficiency (SCID) mice that were surgically castrated. When the initial tumor volume reached ~200 mm3, the tumor-bearing mice were randomized to receive vehicle control or Enz or EPZ alone or in combination daily, and the tumor volume was measured every 3 days. Importantly, we observed that combinatorial treatment significantly reduced xenograft tumor growth (ANOVA, p < 0.001), whereas either drug as a single agent had a minimal tumor-suppressive effect (Figures 7B and S7B). The tumor weight at the endpoint was significantly lower in mice treated with the drug combination (ANOVA, p < 0.02), whereas Enz or EPZ alone failed to inhibit CRPC tumor growth (Figures 7C and S7B).
To confirm the on-target effects of the drugs, we dissected out xenograft tumors for molecular analysis. Western blotting showed that EPZ treatment decreased H3K27me3, as expected, but also inadvertently increased AR expression (Figure 7D), which is consistent with our in vitro data and a recent report (Ku et al., 2017). Further, we found that PSA levels in these xeno-graft CRPC tumors, which were grown in castrated mice, were, in general, very low but could be detected by qRT-PCR and showed an on-target suppression by Enz (Figure S7C). Further, although PSA expression was inadvertently increased by EPZ as a single agent, it remained repressed by EPZ and Enz drug combination. In addition, we found that the EPZ and Enz combination strongly decreased the expression of the cell cycle regulator Cyclin D1, consistent with their synergetic roles in regulating global cell cycle arrest. Moreover, immunohistochemistry staining revealed a substantial decrease in Ki67 staining in cells treated with the drug combination (Figures 7E and S7D). Therefore, our data support that combinatorial Enz and EPZ treatment has synergistic effects in completely abolishing dual EZH2 pathways and in inhibiting CRPC tumor growth.
DISCUSSION
EZH2 was first found to be one of the most upregulated genes in aggressive PCa more than a decade ago (Varambally et al., 2002). Ever since, a large body of literature, including by us, has examined the function and molecular mechanisms of EZH2 in PCa, but this is largely limited to epigenetic targets of EZH2 (Yu et al., 2010). However, evidence has accumulated recently suggesting that EZH2 is capable of stimulating or repressing gene expression beyond PRC2 and H3K27me3 (Gonzalez et al., 2011). Of most relevance, Xu et al. (2012) reported that, in CRPC cells, EZH2 activates gene expression independently of PRC2 but still requires methylation activity. They postulated that this could be due to methylation of non-histone substrates that have yet to be characterized. Quite distinct from their study, here, we demonstrate a non-catalytic role of EZH2 in PCa that is independent of both PRC2 and its methyltransferase activity. Extensive analyses of the target AR gene promoter using ChIP-seq, luciferase, and CRISPR-Cas9 assays support that this regulation occurs at the transcription level and involves EZH2 protein occupancy at the AR promoter, a locus previously implicated in AR gene activation (Wang et al., 2016). We speculate that EZH2 binding at the AR promoter may recruit additional transcriptional coactivators, such as SP1 or KLF5, to induce gene expression, which will be interesting lines for future investigation. In support of this, recent studies have reported EZH2 interaction with Elongin A to increase transcription of target genes (Ardehali et al., 2017), and its paralog EZH1 has likewise been shown to associate with H3K4me3, RNA polymerase II, and transcription activation (Mousavi et al., 2012).
Through the use of diverse of PCa cell lines, we show that EZH2 activation of AR gene transcription and AR signaling occurs in both ADPC and CRPC, which is distinct from a previous report of EZH2-AR interaction only in CRPC but not ADPC (Xu et al., 2012). This disparity supports the novelty of our finding and its being a different mechanism. Further, through comparative expression profiling of cells treated with EZH2 knockdown or the enzymatic EZH2 inhibitor EPZ, we showed that a large set of genes that were downregulated upon EZH2 knockdown is not repressed by EPZ, providing a potential list of methylation-independent EZH2-activated genes. Using ChIP-seq, we demonstrated a very interesting pattern of EZH2-occupied genomic loci: about one-third of them are co-occupied by H3K27me3 (potential EZH2-repressed targets) and another one-third are co-occupied by H3K27ac (potential EZH2-activated genes), supporting EZH2 being both a transcriptional repressor and activator. Our data suggest that the local chromatin environment may dictate the function of EZH2 at a specific genomic locus. The EZH2-bound AR promoter locus harbors the features of gene-activating elements, including high H3K27ac but no H3K27me3, and possesses motifs of many transcription activators.
Last, we demonstrate that the role of EZH2 as a transcriptional activator, with AR being a key target, coexists with its conventional catalytic role in gene repression and plays important oncogenic functions in AR-driven PCa (Figure 7F). Enzymatic EZH2 inhibitors such as EPZ and GSK126, although effective in blocking the enzymatic roles of EZH2, are unable to suppress EZH2-mediated activation of the AR. Instead, they inadvertently increase AR expression, as demonstrated in our data and in a recent report (Ku et al., 2017), which may account for their failure in suppressing AR-positive PCa, as noted previously (Dardenne et al., 2016) and also as observed in our study. In addition, these studies have found that enzymatic EZH2 inhibitors are much more effective in AR-negative NEPC cells, which is consistent with our model. Moreover, understanding the molecular mechanisms of EZH2 functions in PCa allowed us to propose a strategy for the use of these clinically available enzymatic EZH2 inhibitors, through combination with AR antagonist, in a subtype of PCa (i.e., CRPC) that is driven by AR and expresses high levels of EZH2. We understand that the AR antagonist will target all ARs, induced either by EZH2 or through other mechanisms such as AR gene amplification. Nevertheless, it is legitimate and a common practice to target a key downstream pathway when the upstream regulator itself is not yet targetable. Our results suggest that compounds capable of degrading EZH2 protein, similar to EZH2 knockdown, might greatly outperform enzymatic EZH2 inhibitors and would have higher specificity in blocking the dual roles of EZH2. It would be important to develop such small-molecule inhibitors in future studies. In summary, our study reports a non-catalytic role of EZH2 in transcriptional activation and provides compelling preclinical data to support clinical applications of combinatorial Enz and EPZ treatment in CRPC.
STAR★METHODS
CONTACT FOR REAGENT AND RESOURCE SHARING
Further information and requests for resources and reagents should be directed to and will be fulfilled by the Lead Contact, Jindan Yu (jindan-yu@northwestern.edu)
EXPERIMENTAL MODEL AND SUBJECT DETAILS
Cell Lines and Chemical Reagents
Human embryonic kidney cell line 293T and PCa cell lines LNCaP and 22RV1 were obtained from American Type Culture Collection (ATCC) and C4–2B cells were a provided by Dr. Arul Chinnaiyan (University of Michigan, Ann Arbor). 293T cells was cultured in DMEM with 10% fetal bovine serum (FBS) and 1× Penicillin Streptomycin and PCa cells were cultured in RPMI1640 with 10% fetal bovine serum (FBS) and 1× Penicillin Streptomycin solution. LAPC4 cells were provided by Dr. C Shad Thaxton (Northwestern University) and cultured in IMEM with 10% FBS and 1nM fresh R1881. All cell lines were authenticated (Genetica DNA Laboratories) and free of mycoplasma. GSK126 was purchased from BioVision (2282–5), Enz (S1250) and EPZ6438 (S7128) were purchased from Selleck Chemicals.
Animal Studies
Animal study were performed with approved protocol #IS00005301 by the Center for Comparative Medicine at Northwestern University. Male NOD.SCID (C.B-17/IcrHS-Prkdcscid) immune-deficient mice of 4 weeks old were purchased from Charles River. Only male, adult mice were utilized for the study as PCas only occur in adult men. Mice were housed (3–4 mice per cage) in sterilized filter-topped cages and maintained in an ABSL-2 immunodeficient animal housing facility at Northwestern University. Mice were randomly assigned to treatment groups.
METHOD DETAILS
Plasmids
AR promoter regions P1 (+1.1kb-1.7kb), P2 (1.7kb-2.5kb), P1+P2 (+1.1kb-2.5kb) and AR promoter fragments (0.4–0.8kb, 0.8–1.2kb, 1.2–1.6kb, 1.6–1.8kb, 1.8–2.3kb) were amplified by PCR from LNCaP genomic DNA. The AR promoter P1, P2 and full length were inserted into pGL4.10 vector (catalog number E6651; Promega) by using XhoI and HindIII sites and AR fragments were cloned into the pRetroX-Tight-Pur-Luc plasmid (Clontech laboratories, Inc.) by using BamHI and BglII. All plasmids were verified by sequencing.
CRISPR-Cas9-mediated editing of AR promoter
sgRNAs targeting indicated AR promoter regions (Table S5) were designed using the MIT CRISPR Design software (crispr.mit.edu). Each sgRNA oligos were synthesized and cloned into lentiCRISPR v2 vector as a gift from Dr. Feng Zhang (Addgene pladmid #52961). Lentiviral particles was produced in 293T with PEI transfecting reagent (VWR). LNCaP cells were then infected with sgRNAs lentiviral particles combination for 48 hours, then split, and transfected with either control or siEZH2 using Lipopectamine 2000 (Invitrogen) for 48 hours. Genomic DNA was prepared using the PureLink Genomic DNA kit (Life Technology). PCR of genomic DNA was performed with indicated primers flanking the sgRNA target sites on AR promoter region (Table S5). PCR products were purified from agarose gel and sequenced to assess the effects of CRISPR-Cas9-mediated editing of AR promoter. Total RNA was isolated from cells with Nucleospin RNA isolation kit (Clonetech) and 250 ug of RNA per sample was used for cDNA synthesis using qscript cDNA synthesis supermix (Quantabio). PCR of cDNA were then performed using specific AR promoter (also exon 1) primers (Primer F2 and R2) and subjected for agarose gel analysis. Protein extracts were subjected for western blot analysis to confirm EZH2 knockdown.
PCR, Quantitative PCR and Western Blot
Genomic DNA was isolated from cells with Blood & Cell culture DNA midi kit (QIAGEN). PCR was performed with indicated primers flanking the sgRNA target sites. PCR products were purified from agarose gel and sequenced. Total RNA was isolated from cells with Nucleospin RNA isolation kit (Clonetech). For cDNA synthesis, 250 ug of RNA per sample was used for cDNA synthesis using qscript cDNA synthesis supermix (Quantabio). qRT-PCRs were performed using 2×Bullseye EvaGreen qPCR MasterMix (MIDSCI) and StepOne Plus (Applied Biosystems). Primers were designed using primer3 and synthesized by Integrated DNA Technologies (Table S5). Western blotting analyses were performed using standard protocols. Briefly, cell lysates were harvested with RIPA buffer and prepared in 1X-SDS sample buffer, boiled for 10 min at 95 °C, separated on a 10% SDS-polyacrylamide gel and transferred to an Amersham Hybond PVDF membrane. The membranes were blocked with either 5% w/v BSA or milk in TBST for 1h at RT, incubated in primary antibody diluted in blocking solution overnight at 4°C, washed 3 times for 5 min with TBST and incubated for 1 h in a secondary antibody (1:10,000). Membranes were washed 3 times for 10 min with TBST and chemiluminesce signal was detected by ECL solution and film (GE Healthcare).
WST-1 Cell Proliferation, Incucyte Cell Confluence Assay and Colony Formation Assay
Cell proliferation assay was measured with WST-1 (promega) reagent according to the manufacturer’s instruction (Clontech). Briefly, cells were treated with WST-1 for 2hours at 37oC incubator prior to absorbance reading at 440nm using the KC4 microplate reader (BioTek). Each absorbance was normalized to the media control without any cells. For the Incucyte cell confluence assay, C4–2B cells were infected with pLKO.1V, shEZH2, shSUZ12 or shAR for 24 hours and harvested by trypsinization. 5,000 cells were counted on a Countess automated cell counter (Life Technologies, Carlsbad, CA) and plated on 24 tissue culture plates in 3 replicates. Photomicrographs were taken every two hours using an Incucyte live cell imager (Essen Biosciences, Ann Arbor, MI). Cell confluence were measured using Incucyte software (Essen Biosciences, Ann Arbor, MI) over 5 days in culture. Data were normalized to the pLKO.1 control cells and analyzed using Incucyte software (Essen Biosciences, Ann Arbor, MI).
For colony formation assay, 1,000–2,000 cells were plated in each well of a 6-well plate and treated with indicated concentration of DMSO, Enz, EPZ or both for 10–14 days, cells were fixed by 4% paraformaldehyde and stained by 0.05% crystal violet.
Cell Cycle Analysis
For cell cycle analysis, LNCaP and C4–2B cells were treated with either DMSO, Enz, EPZ or Enz+EPZ6438 for 72 hours. Cell were harvested and washed with PBS. Cells were fixed with absolute ethanol for 15 min at −20°C. Ethanol fixed cells were rehydrated with PBS at room temperature for 5 min and then stained with 3μM of propodium iodide solution (Thermo Fisher) and subjected for flow cytometry analysis using LSR Fortessa cell analyzer (BD Science). Data were analyzed by ModFit LT (Verity Software).
Luciferase reporter assay
pGL4.1 reporter constructs containing AR promoter fragment were co-transfected with pLVX-HA or pLVX-EZH2 and pRL-TK for internal control. Absorbance reading for luciferase activities were measured in 24 h post transfection at 440nm using the KC4 micro-plate reader (BioTek). Each absorbance was normalized to the renilla internal control values.
Chromatin Immunoprecipitation (ChIP) and ChIP-seq
ChIP and ChIP-seq was performed using previously described protocol with following modifications. 2×10⁷ LNCaP cells were cross-linked with 1% paraformaldehyde for 10 min at room temperature with gentle rotation and then quenched with 0.125 M glycine. After washing, nuclei were sonicated on a Covaris M220 Focused-ultrasonicator, and the supernatant was used for immunoprecipitation with the indicated antibody (Table S2). ChIP-qPCR primers used in the ChIP assays were listed in Table S5. For EZH2 ChIP on AR promoter fragment in 293T cells. 293T cells were transfected with pRetroX-Tight-Pur-Luc vector containing AR promoter fragments, after 7 days puromycin selection, ChIP was performed as above. ChIP-qPCR using a forward primer that targets the plasmid backbone and a reverse primer that targets the inserted AR promoter fragment.
ChIP-seq data analysis
ChIP-seq reads were aligned to the Human Reference Genome (assembly hg19) using Burrows-Wheeler Alignment (BWA) Tool Version 0.6.1. ChIP-seq peak identification, overlapping, subtraction and feature annotation of enriched regions were performed using HOMER (Hypergeometric Optimization of Motif EnRichment) suite. Weighted Venn diagrams were created by R package Vennerable. Transcription factor motif analysis on the AR promoter sequence was performed with JASPAR. Heatmap views of ChIP-seq were generated by deepTools.
RNA-seq and analysis
For RNA-seq, total RNA was isolated from cells using PureLinkTM RNA Mini Kit (Life Tech). RNA-seq libraries were prepared from 0.5 μg high-quality DNA-free total RNA by using NEBNext® Ultra RNA Library Prep Kit, according to the manufacturer’s instructions. The libraries were sequenced using Illumina Hi-Seq platform. RNA-seq reads were mapped to NCBI human genome GRCh38 using STAR version 1.5.2. Raw counts of genes were calculated by STAR. FPKM values (Fragments Per Kilobase of transcript per Million mapped reads) were calculated by in house perl script. Differential gene expression was analyzed by R Bioconductor DESeq2 package, which uses shrinkage estimation for dispersions and fold changes to improve stability and interpretability of estimates.
Microarray and expression analysis
Microarray expression profiling was performed using HumanHT-12 v 4.0 Expression BeadChip (Illumina). Bead-level data were preprocessed and normalized by GenomeStudio. Differentially expressed genes were identified by Bioconductor limma package (cutoff p < 0.005). Clustering and heatmap view of differentially expressed genes were performed using Cluster and Java Treeview 7. GSEA was performed as previously described.
Xenograft Experiments
For Xenograft, 2 × 10⁶ of C4–2B cells were suspended in 200 μL PBS with 50% Matrigel (BD Science) and injected subcutaneously into the dorsal flank of the mice one week after surgical castration. Mice were randomly divided into four different groups and treated with 200 μL of vehicle control, Enz (10mg/kg), EPZ6438 (250mg/kg), or combination of Enz (10mg/kg) and EPZ6438 (250mg/kg) by oral gavage. Enz were administered once a day and EPZ6438 were given twice a day. Tumor volumes were measured with digital caliper once a week in a blinded fashion and calculated with the formula, V = π/6 (length × width2). When tumor size reached ~1,000mm3, mice were euthanized, tumors were excised and weighed. The effects of drug treatment in suppressing target pathways were examined via western blot and immunohistochemistry analysis. For western blot analysis, dissected tumor were homogenized with standard glass beads (1.0mm) using BeadBug homogenizer (Benchmark) in RIPA buffer supplemented with protease inhibitor and protein were subjected for western blot analysis. For immunohistochemistry analysis, tumor sections were fixed with formalin and embedded in paraffin. Formalin-fixed and paraffin embedded tumor section were then stained with Ki-67 and H3K27me3.
QUANTIFICATION AND STATISTICAL ANALYSIS
Statistics for qPCR, WST-1 cell Proliferation, Incucyte cell confluence assay, luciferase reporter assay (n = 3) and the xenograft tumor growth curves (n = 7) were reported as mean ± standard deviation and graphs were generated using Microsoft Excel. The results were considered significant if the p value is less than 0.05. Analysis of cell cycle upon drug treatments were performed with Modfit FT software (Verity Software, Santa Clara, CA). All the quantification and statistical analysis for the high-throughput data including microarray, RNA-seq and motif analysis were performed using R package Vennerable. R Bioconductor DESeq2 package.
DATA AND SOFTWARE AVAILABILITY
The accession number for microarray, ChIP-seq, and RNA-seq data reported in this paper is in the GEO database: GSE107782. Raw image data of western blots were deposited to Mendeley Data with URL: https://data.mendeley.com/datasets/jxptxx985d/1
Supplementary Material
KEY RESOURCES TABLE
| REAGENT or RESOURCE | SOURCE | IDENTIFIER |
|---|---|---|
| Antibodies | ||
| Rabbit monoclonal anti-Ezh2 | Cell Signaling Technology | Cat# 5246S; RRID:AB_10694683 |
| Rabbit polyclonal anti-AR | Millipore | Cat# 06–680; RRID:AB_310214 |
| Rabbit monoclonal anti-SUZ12 | Cell Signaling Technology | Cat#3737S; RRID:AB_2196850 |
| Rabbit monoclonal anti-H3K27me3 | Cell Signaling Technology | Cat# 9733S; RRID:AB_2616029 |
| Rabbit polyclonal anti-H3K27me3 | Millipore | Cat# ABE44; RRID:AB_10563660 |
| Rabbit monoclonal anti-Ki67 | Cell Signaling Technology | Cat# 9027S; RRID:AB_2636984 |
| Rabbit polyclonal anti-Cyclin D1 | Abeam | Cat# ab24249–100; RRID:AB_447956 |
| Rabbit polyclonal anti-H3 | Abeam | Cat# ab1791–100; RRID:AB_302613 |
| Rabbit monoclonal anti-PSA | Cell Signaling Technology | Cat# 2475S; N/A |
| Rabbit polyclonal anti-H3K27ac | Abeam | Cat# ab4729; RRID:AB_2118291 |
| Rabbit polyclonal anti-HA | Abeam | Cat# ab9110; RRID:AB_307019 |
| Rabbit polyclonal anti-HA | Santa Cruz Biotechnology | Cat# sc-805×; RRID:AB_631618 |
| Normal Rabbit unconjugated-IgG | Santa Cruz Biotechnology | Cat# sc-2027; RRID:AB_737197 |
| Chemicals, Peptides, and Recombinant Proteins | ||
| Tazemetostat (EPZ-6438) Ezh2 inhibitor | Selleck Chemicals | Cat# S7128 |
| Enz (MDV3100) AR antagonist | Selleck Chemicals | Cat# S1250 |
| GSK 126 Ezh2 inhibitor | BioVision | Cat# 2282–5 |
| Critical Commercial Assays | ||
| Cell Proliferation Reagent WST-1 | Clonetech | Cat# MK400 |
| ECL prime Western Blotting Detection Reagent | Amersham | N/A |
| ECL Western Blotting Detection Reagent | Amersham | Cat# RPN2106 |
| Nucleospin RNA isolation kit | Takara | Cat# 740955.25 |
| qscript CDNA synthesis supermix | Qunatabio | Cat# 95048–25 |
| 2× bullseye EvaGreen qPCR mastermix | Midsci | Cat# BEQPCR-IC |
| Propidium iodide solution | ThermoFisher Scientific | Cat# P1304MP |
| Lipopectamine 2000 | ThermoFisher Scientific | Cat# 11668019 |
| Dual-Luciferase Reporter Assay System | Promega | Cat# E1910 |
| NEBNext Ultra RNA Library Prep Kit | NEB | Cat# E7530S |
| Deposited Data | ||
| https://data.mendeley.com/datasets/jxptxx985d/1 | Unprocessed imaging data | N/A |
| https://www.ncbi.nlm.nih.gov/geo/query/acc.cgi?acc=GSE107782 | High-throughput genomics data | N/A |
| Experimental Models: Cell Lines | ||
| Human: Passage 10–20 LNCaP | ATCC | Cat# CRL-1740; RRID:CVCL_1379 |
| Human: Passage 39–50 C4–2B | Laboratory of Dr. Arul Chinnaiyan (University of Michigan, Ann Harbor) | N/A |
| Human: Passage 10–20 22Rv1 | ATCC | Cat# CRL-2505; RRID:CVCL_1045 |
| Human: Passage 10–20 LAPC4 | Laboratory of Dr. C Shad Thaxton (Northwestern University) | N/A |
| Human: Passage 5–10 293T | ATCC | Cat# CRL-3216; RRID:CVCL_0063 |
| Experimental Models: Organisms/Strains | ||
| Mouse: NOD.CB17-Prkdcscid/NCrCrl 4–6 weeks old male | Charles river | Cat# 394 |
| Oligonucleotides | ||
| See Table S5. | ||
| Recombinant DNA | ||
| pLKO.1V | Addgene | Cat# 10878; RRID:Addgene_10878 |
| LentiCRISPR v2 | Addgene | Cat# 52961; RRID:Addgene_52961 |
| pGL4.10 | Promega | Cat# E6651 |
| HAF-GFP | This paper | N/A |
| HAF-EZH2 | This paper | N/A |
| HAF-EZH2H689A | This paper | N/A |
| pAd-GFP control | This paper | N/A |
| pAd-EZH2 | This paper | N/A |
| Software and Algorithms | ||
| Incucyte softeware | Essen Biosoience | https://www.essenbioscience.com/en/products/software/incucyte-base-software/ |
| ModFit LT | Verity Software | http://www.vsh.com/products/mflt/index.asp |
| Cluster | http://bonsai.hgc.jp/~mdehoon/software/cluster/software.htm | |
| TreeView | https://sourceforge.net/projects/jtreeview/ | |
| GSEA | http://software.broadinstitute.org/gsea/index.jsp | |
| BWA | http://bio-bwa.sourceforge.net/ | |
| STAR | https://github.com/alexdobin/STAR/releases | |
| JASPAR2014 | http://jaspar2014.genereg.net/ | |
| HOMER (Hypergeometric Optimization of Motif EnRichment) suite | http://homer.ucsd.edu/homer/ | |
| deepTools | https://deeptools.readthedocs.io/en/develop/ | |
| DESeq2 | R Bioconductor package | https://bioconductor.org/packages/release/bioc/html/DESeq2.html |
| Vennerable | R package | https://github.com/js229/Vennerable |
Highlights.
EZH2 directly activates androgen receptor (AR) gene transcription
EZH2 induces AR through Polycomb- and methylation-independent mechanisms
Local chromatin environment dictates the roles of EZH2 as an activator or repressor
Prostate cancer depends on both catalytic and non-catalytic activities of EZH2
ACKNOWLEDGMENTS
We thank Dr. Ming Hu (Cleveland Clinic) for discussions regarding statistical analysis and Bin Zheng and Galina Gritsina for technical help. This work was supported in part by National Cancer Institute R01CA172384 (to J.Y.), P50CA180995 (pilot project, to J.Y.), and R50CA211271 (to J.C.Z.); American Cancer Society Research Scholar Award RSG-12-085-01 (to J.Y.); Department of Defense PC160328 (to J.Y.); and an institutional Ruth L. Kirschstein National Research Service award from the National Institute of Diabetes and Digestive and Kidney Diseases T32 DK007169 (to J.K.).
Footnotes
SUPPLEMENTAL INFORMATION
Supplemental Information includes seven figures and five tables and can be found with this article online at https://doi.org/10.1016/j.celrep.2018.11.035.
DECLARATION OF INTERESTS
The authors declare no competing interests.
REFERENCES
- Ardehali MB, Anselmo A, Cochrane JC, Kundu S, Sadreyev RI, and Kingston RE (2017). Polycomb Repressive Complex 2 Methylates Elongin A to Regulate Transcription. Mol Cell 68, 872–884.e6. [DOI] [PMC free article] [PubMed] [Google Scholar]
- Dardenne E, Beltran H, Benelli M, Gayvert K, Berger A, Puca L, Cyrta J, Sboner A, Noorzad Z, MacDonald T, et al. (2016). N-Myc Induces an EZH2-Mediated Transcriptional Program Driving Neuroendocrine Prostate Cancer. Cancer Cell 30, 563–577. [DOI] [PMC free article] [PubMed] [Google Scholar]
- Gonzalez ME, DuPrie ML, Krueger H, Merajver SD, Ventura AC, Toy KA, and Kleer CG (2011). Histone methyltransferase EZH2 induces Akt-dependent genomic instability and BRCA1 inhibition in breast cancer. Cancer Res. 71, 2360–2370. [DOI] [PMC free article] [PubMed] [Google Scholar]
- He A, Shen X, Ma Q, Cao J, von Gise A, Zhou P, Wang G, Marquez VE, Orkin SH, and Pu WT (2012). PRC2 directly methylates GATA4 and represses its transcriptional activity. Genes Dev. 26, 37–42. [DOI] [PMC free article] [PubMed] [Google Scholar]
- Höller M, Westin G, Jiricny J, and Schaffner W (1988). Sp1 transcription factor binds DNA and activates transcription even when the binding site is CpG methylated. Genes Dev. 2, 1127–1135. [DOI] [PubMed] [Google Scholar]
- Kim KH, Kim W, Howard TP, Vazquez F, Tsherniak A, Wu JN, Wang W, Haswell JR, Walensky LD, Hahn WC, et al. (2015). SWI/SNF-mutant cancers depend on catalytic and non-catalytic activity of EZH2. Nat. Med 21, 1491–1496. [DOI] [PMC free article] [PubMed] [Google Scholar]
- Ku SY, Rosario S, Wang Y, Mu P, Seshadri M, Goodrich ZW, Goodrich MM, Labbé DP, Gomez EC, Wang J, et al. (2017). Rb1 and Trp53 cooperate to suppress prostate cancer lineage plasticity, metastasis, and anti-androgen resistance. Science 355, 78–83. [DOI] [PMC free article] [PubMed] [Google Scholar]
- Lee JM, Lee JS, Kim H, Kim K, Park H, Kim JY, Lee SH, Kim IS, Kim J, Lee M, et al. (2012). EZH2 generates a methyl degron that is recognized by the DCAF1/DDB1/CUL4 E3 ubiquitin ligase complex. Mol. Cell 48, 572–586. [DOI] [PubMed] [Google Scholar]
- Mousavi K, Zare H, Wang AH, and Sartorelli V (2012). Polycomb protein Ezh1 promotes RNA polymerase II elongation. Mol. Cell 45, 255–262. [DOI] [PubMed] [Google Scholar]
- Neff T, Sinha AU, Kluk MJ, Zhu N, Khattab MH, Stein L, Xie H, Orkin SH, and Armstrong SA (2012). Polycomb repressive complex 2 is required for MLL-AF9 leukemia. Proc. Natl. Acad. Sci. USA 109, 5028–5033. [DOI] [PMC free article] [PubMed] [Google Scholar]
- Pasini D, Bracken AP, Jensen MR, Lazzerini Denchi E, and Helin K (2004). Suz12 is essential for mouse development and for EZH2 histone methyltransferase activity. EMBO J. 23, 4061–4071. [DOI] [PMC free article] [PubMed] [Google Scholar]
- Sanulli S, Justin N, Teissandier A, Ancelin K, Portoso M, Caron M, Michaud A, Lombard B, da Rocha ST, Offer J, et al. (2015). Jarid2 Methylation via the PRC2 Complex Regulates H3K27me3 Deposition during Cell Differentiation. Mol. Cell 57, 769–783. [DOI] [PMC free article] [PubMed] [Google Scholar]
- Shen X, Liu Y, Hsu YJ, Fujiwara Y, Kim J, Mao X, Yuan GC, and Orkin SH (2008). EZH1 mediates methylation on histone H3 lysine 27 and complements EZH2 in maintaining stem cell identity and executing pluripotency. Mol. Cell 32, 491–502. [DOI] [PMC free article] [PubMed] [Google Scholar]
- Siegel RL, Miller KD, and Jemal A (2015). Cancer statistics, 2015. CA Cancer J. Clin 65, 5–29. [DOI] [PubMed] [Google Scholar]
- Varambally S, Dhanasekaran SM, Zhou M, Barrette TR, Kumar-Sinha C, Sanda MG, Ghosh D, Pienta KJ, Sewalt RG, Otte AP, et al. (2002). The polycomb group protein EZH2 is involved in progression of prostate cancer. Nature 419, 624–629. [DOI] [PubMed] [Google Scholar]
- Vasanthakumar A, Xu D, Lun AT, Kueh AJ, van Gisbergen KP, Iannar-ella N, Li X, Yu L, Wang D, Williams BR, et al. (2017). A non-canonical function of Ezh2 preserves immune homeostasis. EMBO Rep. 18, 619–631. [DOI] [PMC free article] [PubMed] [Google Scholar]
- Wang J, Zou JX, Xue X, Cai D, Zhang Y, Duan Z, Xiang Q, Yang JC, Louie MC, Borowsky AD, et al. (2016). ROR-g drives androgen receptor expression and represents a therapeutic target in castration-resistant prostate cancer. Nat. Med 22, 488–496. [DOI] [PMC free article] [PubMed] [Google Scholar]
- Wei B, Jolma A, Sahu B, Orre LM, Zhong F, Zhu F, Kivioja T, Sur I, Lehtiö J, Taipale M, and Taipale J (2018). A protein activity assay to measure global transcription factor activity reveals determinants of chromatin accessibility. Nat. Biotechnol 36, 521–529. [DOI] [PubMed] [Google Scholar]
- Xu K, Wu ZJ, Groner AC, He HH, Cai C, Lis RT, Wu X, Stack EC, Loda M, Liu T, et al. (2012). EZH2 oncogenic activity in castration-resistant prostate cancer cells is Polycomb-independent. Science 338, 1465–1469. [DOI] [PMC free article] [PubMed] [Google Scholar]
- Yu J, Yu J, Mani RS, Cao Q, Brenner CJ, Cao X, Wang X, Wu L, Li J, Hu M, et al. (2010). An integrated network of androgen receptor, poly-comb, and TMPRSS2-ERG gene fusions in prostate cancer progression. Cancer Cell 17, 443–454. [DOI] [PMC free article] [PubMed] [Google Scholar]
- Zhang W, Bojorquez-Gomez A, Velez DO, Xu G, Sanchez KS, Shen JP, Chen K, Licon K, Melton C, Olson KM, et al. (2018). A global transcriptional network connecting noncoding mutations to changes in tumor gene expression. Nat. Genet 50, 613–620. [DOI] [PMC free article] [PubMed] [Google Scholar]
- Zhao JC, Yu J, Runkle C, Wu L, Hu M, Wu D, Liu JS, Wang Q, Qin ZS, and Yu J (2012). Cooperation between Polycomb and androgen receptor during oncogenic transformation. Genome Res. 22, 322–331. [DOI] [PMC free article] [PubMed] [Google Scholar]
Associated Data
This section collects any data citations, data availability statements, or supplementary materials included in this article.
Supplementary Materials
Data Availability Statement
The accession number for microarray, ChIP-seq, and RNA-seq data reported in this paper is in the GEO database: GSE107782. Raw image data of western blots were deposited to Mendeley Data with URL: https://data.mendeley.com/datasets/jxptxx985d/1