Figure 4. Chemogenetic hyperpolarization of TRN cells mimics the NREMS phenotype of the CaV3.3 KO mice.
(A) Representative membrane voltage recording of a whole-cell patch-clamped TRN cell in vitro exposed to CNO (10 μM, bath application indicated by horizontal bar) recorded in a slice from a mouse injected with AAV8-hM4D(Gi)_IRES_mCitrine. The cell was injected every 10 s with brief negative current pulses to elicit rebound discharge. The application of CNO hyperpolarized the membrane potential, suppressed rebound bursting and decreased membrane input resistance, as evident by the smaller voltage deflection in response to the negative current step (−80 pA). Current step size was increased to −120 pA to compensate for the decreased membrane resistance. Subsequent injection of direct current (d.c.) to counteract membrane hyperpolarization then reinstated burst discharge. Numbers indicate portions of the trace shown expanded below. Horizontal dotted lines indicate mean membrane potential before and during CNO application. (B) Box-and-whisker plot of membrane hyperpolarization in vitro (ΔV, calculated as the difference before and during CNO) for fluorescent (hM4+, n = 10, ΔV = −13.9 ± 1.5 mV, paired t-test, p=6×10⁻⁶) and non-fluorescent cells (hM4-, n = 4, ΔV = 0.0 ± 0.9 mV, paired t-test, p=0.97). The CNO-effects between the two-cell groups differed significantly (unpaired t-test, p=1.1×10⁻⁴). (C) Representative traces in vivo during NREMS 30 min after the injection of NaCl (left) or CNO (right) in the same animal, showing (from top to bottom) the EMG, EEG and S1-LFP (ipsilateral and contralateral to EEG) signals. (D) Mean ±S.E.M. power spectra of the S1-LFPs for NaCl and CNO injections in vivo during the NREMS periods 20 to 65 min after injection. Expanded portion is shown below in log-log scale to emphasize the sigma band (10–15 Hz). (E) Mean total power for the three frequency bands of interest. Diamonds and error bars show the Mean ±S.E.M. across subjects. Gray lines represent individual animals. Repeated-measures ANOVA for factors ‘frequency’ and ‘treatment’, p=7.7×10⁻⁵ was followed by paired t-tests for individual frequency bands, with values given above the bars. Bonferroni-corrected, α threshold was 0.017.
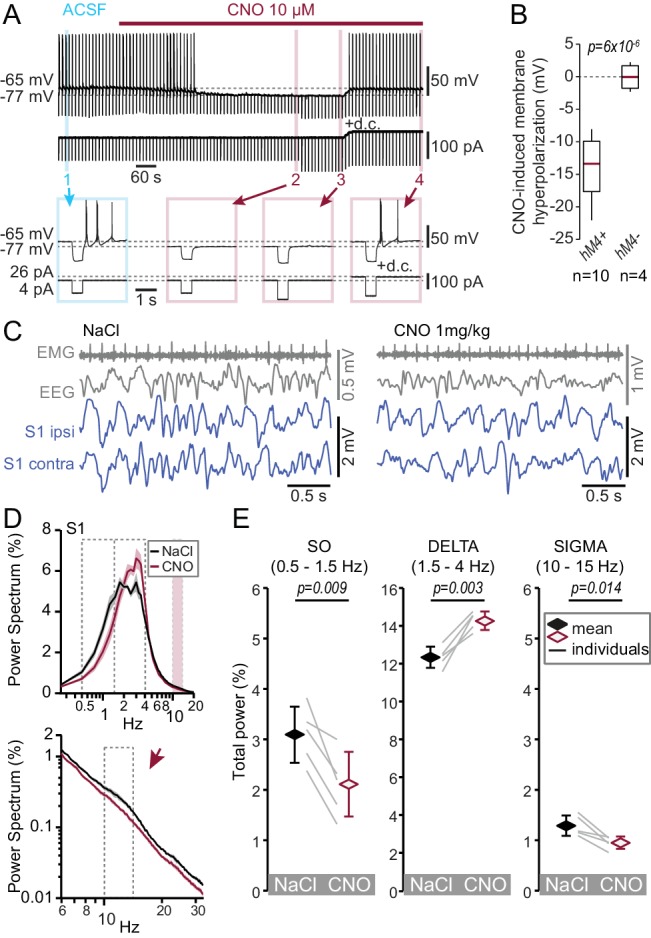
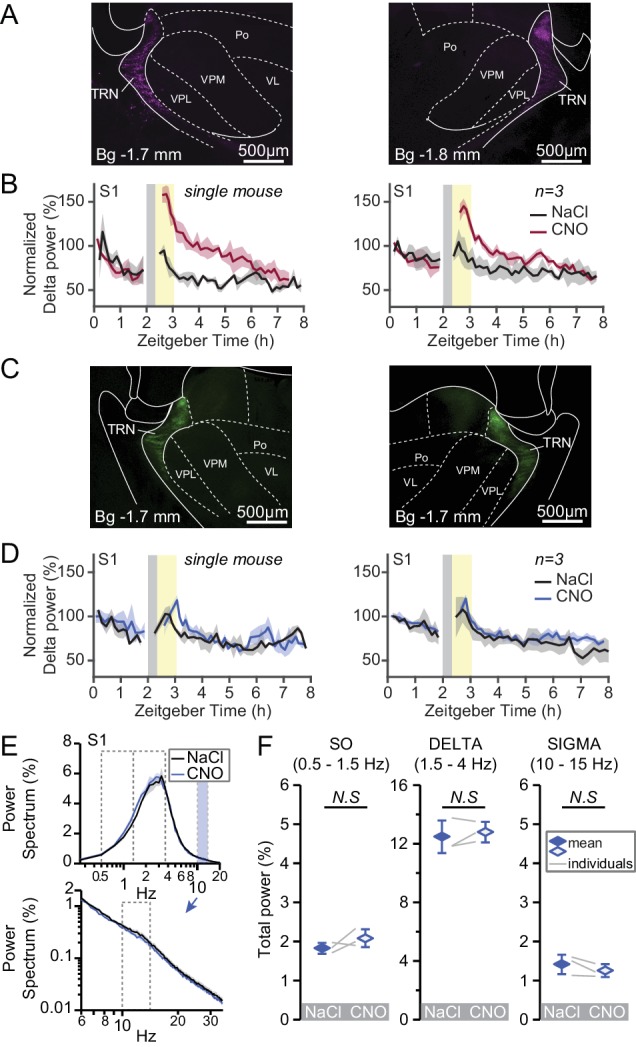
Figure 4—figure supplement 1. Chemogenetic inhibition of TRN cells acutely increases delta activity in a DREADD-dependent expression.