. 2019 Jan 22;8:e39298. doi: 10.7554/eLife.39298

Figure 2. Distribution of DII/mDII ratio intensities within initiating leaf primordia (first and second).

(A and M) Confocal projections of Arabidopsis seedlings aged 3 and 4 DAS (days after stratification) showing DII/mDII ratio intensity distributions (magenta) along with PIN1-GFP expression (green) in the first two leaves. (B, C, N) Corresponding median longitudinal optical sections of first two leaves in (A) (B and C) and in (M) (N). Note no obvious asymmetry in DII/mDII ratio intensities on the adaxial vs abaxial sides of the leaves at 3DAS or 4DAS. (D–L) Optical reconstructions of cross-sections of leaves in (A) along the distal (D) to proximal axis (L). (O–S) Optical reconstructions of cross-sections of leaves in (M) along the distal (O) to proximal axis (S). Note variability in DII/mDII ratio intensities h associated with nuclei within the adaxial and abaxial domains of individual leaves. Scale bars 15 μm (A), 10 μm(B-L), 20 μm (M–S). M marks the meristem.

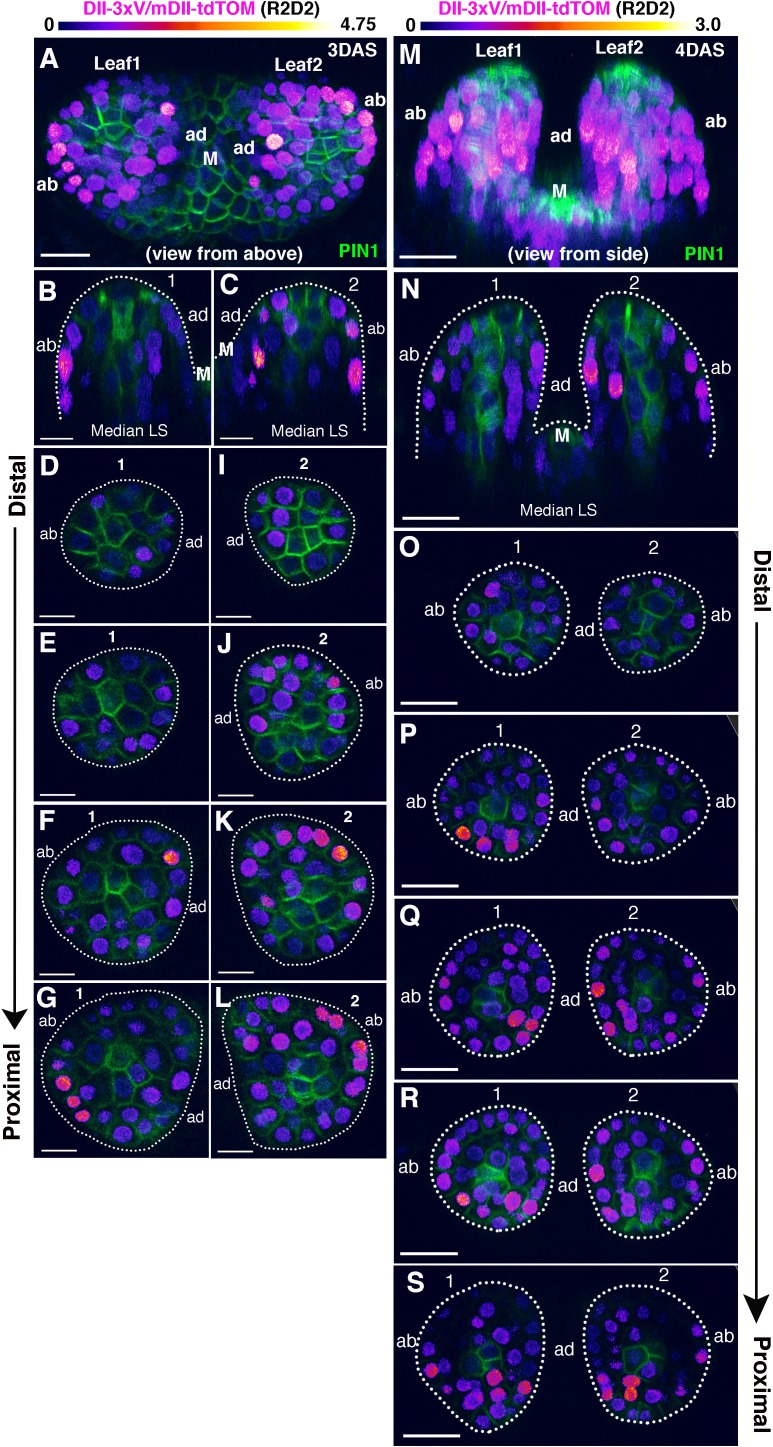
Figure 2.

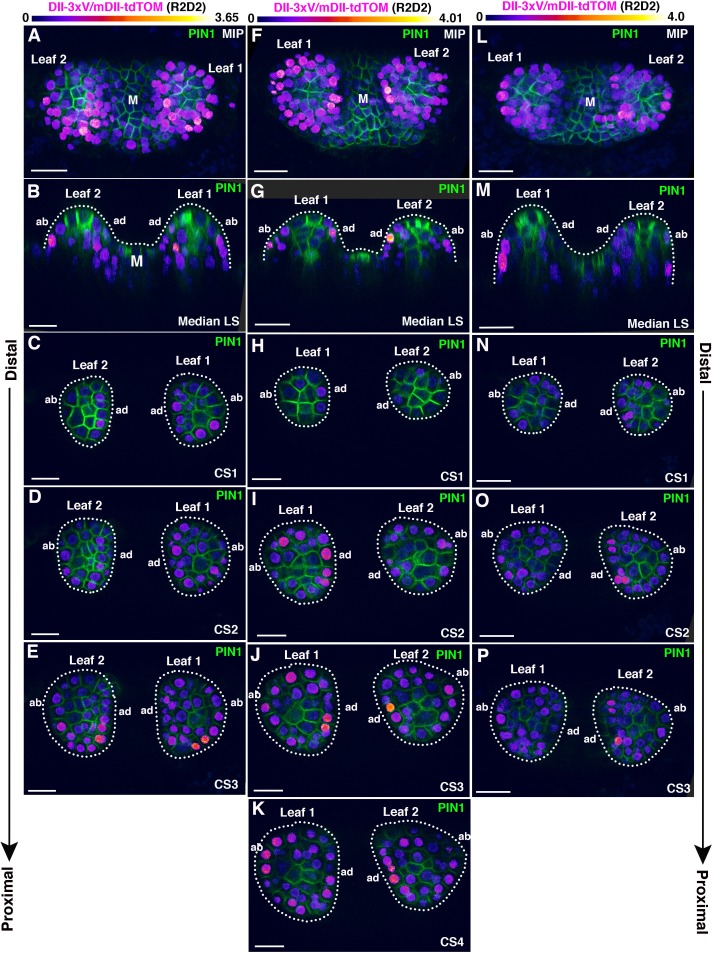
Figure 2—figure supplement 1. Additional examples of 3DAS old seedlings showing Distribution of DII/mDII ratio intensities within initiating leaf primordia (first and second).

Figure 2—figure supplement 1.

(A, F, L) Confocal projections (view from above) of Arabidopsis seedlings aged 3 DAS showing DII/mDII ratio intensity distributions (magenta) along with PIN1-GFP expression (green) in the first two leaves. (B, G, M) Corresponding median longitudinal optical sections of first two leaves in (A), (F) and (L) respectively. (C–E) Optical reconstructions of cross-sections of leaves in (A) along the distal to proximal axis. (H–K) Optical reconstructions of cross-sections of leaves in (F) along the distal to proximal axis. (N–P) Optical reconstructions of cross-sections of leaves in (L) along the distal to proximal axis. Note variability in DII/mDII ratio intensities associated with nuclei within the adaxial and abaxial domains of individual leaves. Scale bars 20 μm (A, F, L,G, M–P), 15 μm(B-E), (H–K). M marks the meristem.

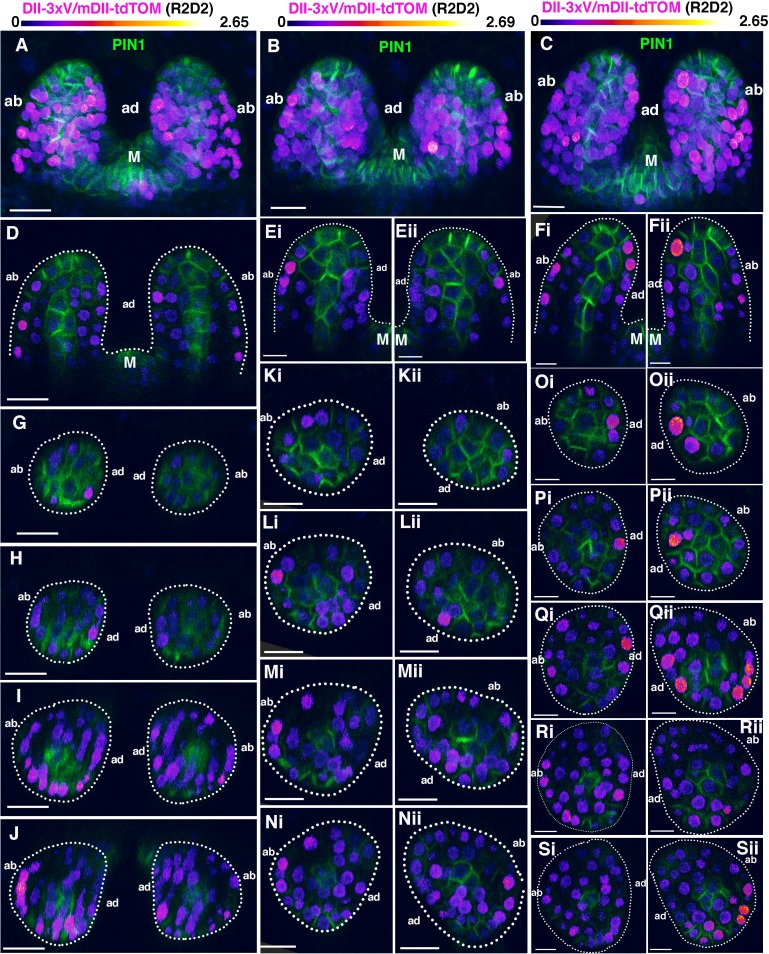
Figure 2—figure supplement 2. Additional examples of 4DAS old seedlings showing the distribution of DII/mDII ratio intensities within initiating leaf primordia (first and second).

Figure 2—figure supplement 2.

(A–C) Confocal projections (view from side) of Arabidopsis seedlings aged 4DAS showing DII/mDII ratio intensitiy distributions (magenta) along with PIN1-GFP expression (green) in first two leaves. (D, Ei-Eii and Fi-Fii) Corresponding median longitudinal optical sections of first two leaves in (A), (B) and (C) respectively. (G-J) Optical reconstructions of cross sections of leaves in (A) along the distal to proximal axis. (Ki-Nii) Optical reconstructions of cross-sections of leaves in (B) along the distal to proximal axis. (Oi-Sii) Optical reconstructions of cross-sections of leaves in (C) along the distal to proximal axis. Note variability in DII/mDII ratio intensities ass-ociated with nuclei within the adaxial and abaxial domains of individual leaves. Scale bars 20 μm (A, D, G–J), 15 μm(B, (C, K–N), 10 μm (E, F, O–S). M marks the meristem.

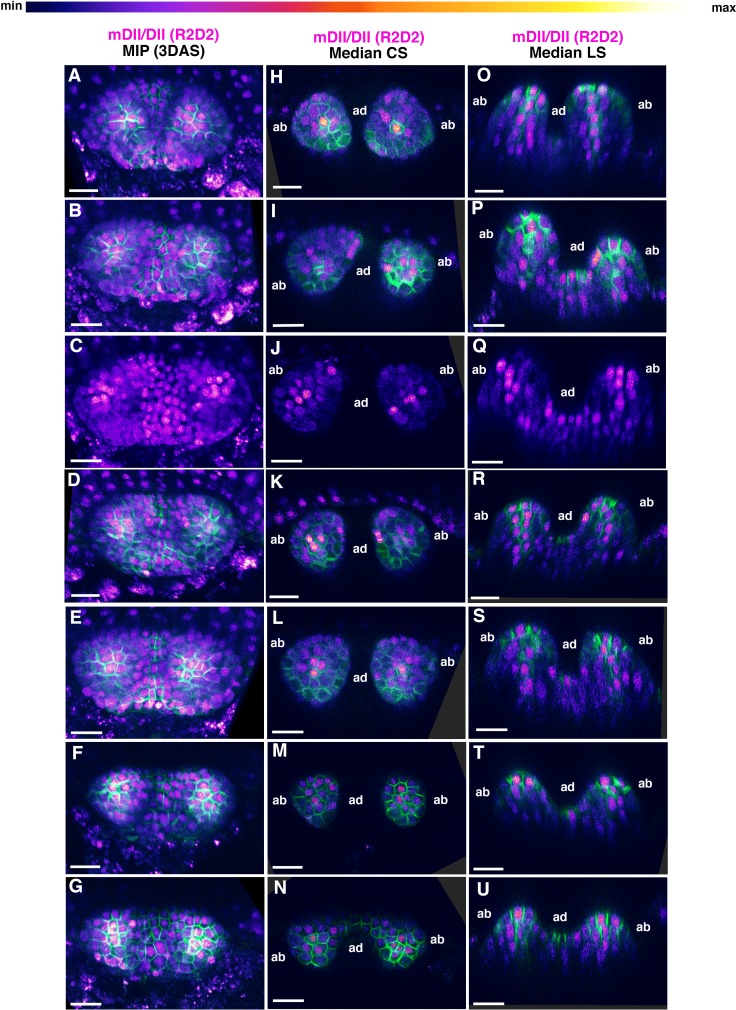
Figure 2—figure supplement 3. Examples of mDII/DII ratio intensity distributions in the first two leaves of 3DAS old Arabidopsis seedlings.

Figure 2—figure supplement 3.

(A–G) Confocal projections of Arabidopsis seedlings aged 3DAS (days after stratification) showing mDII/DII ratio intensity distributions (magenta) along with PIN1-GFP expression (green). (H–N) Median transverse optical sections of (A–G). (O–U) Median longitudinal optical sections of (A–G). Scale bars 20 μm (A–U).