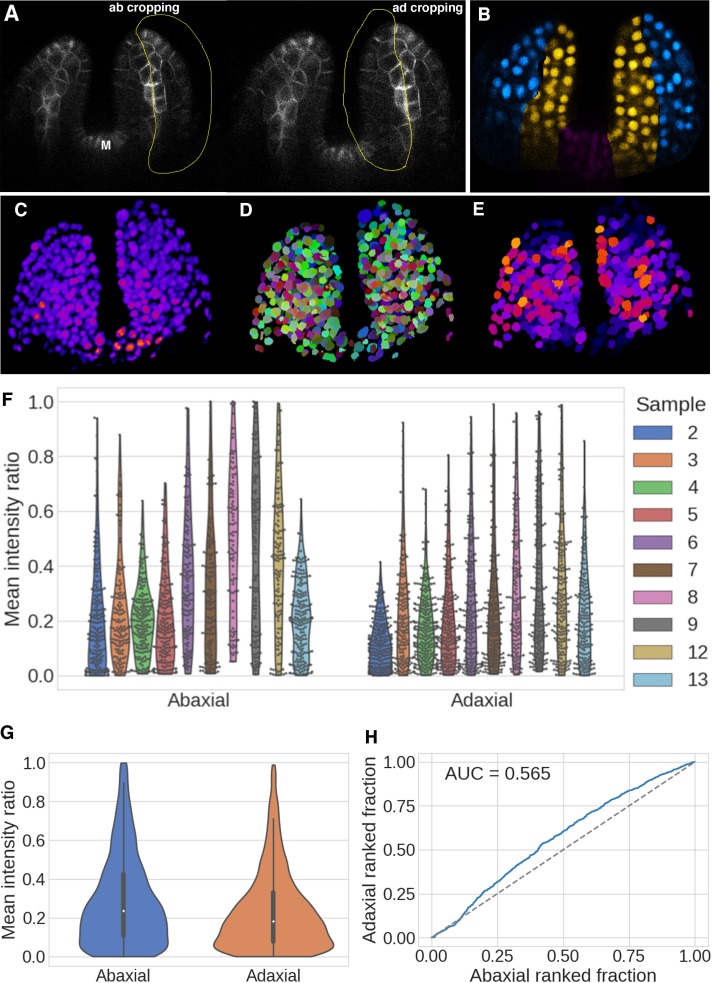
Figure 3. Quantification of DII/mDII ratio intensities within the nuclei of the first two leaves in 4DAS old seedlings.
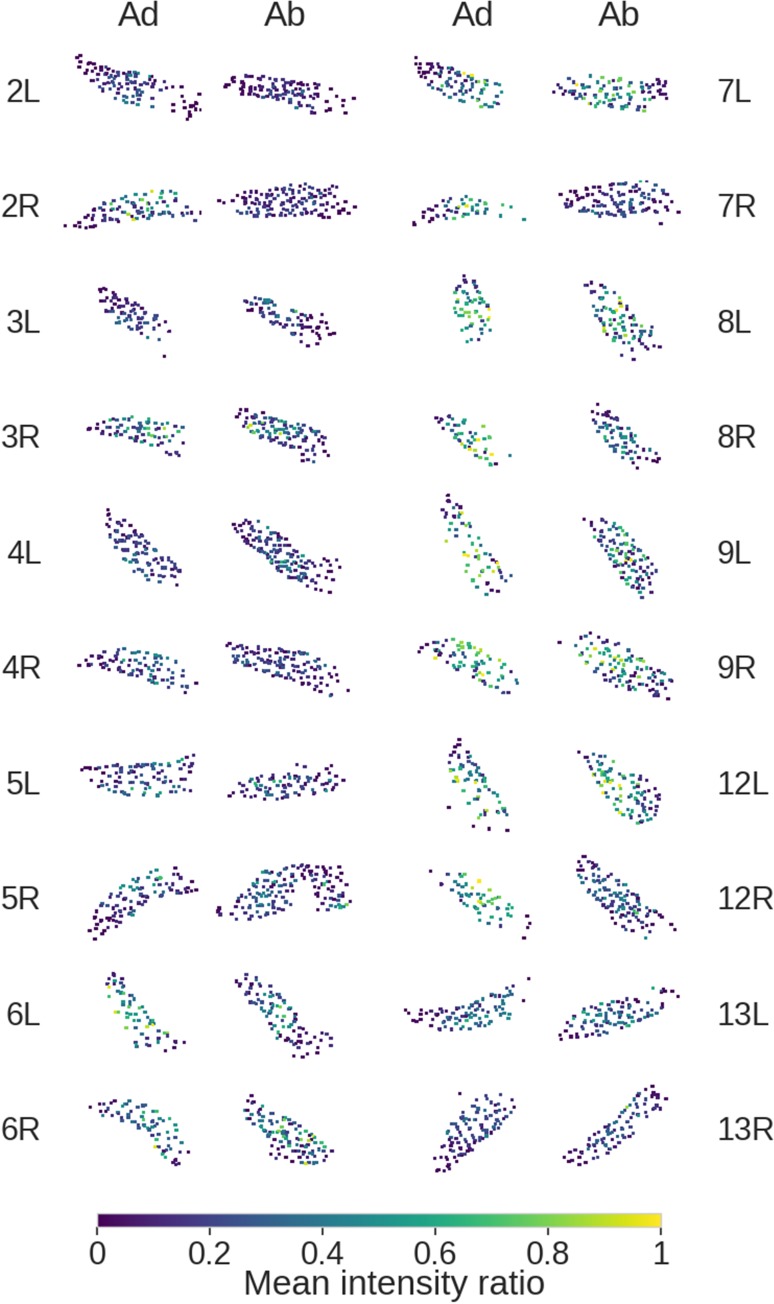
(A) Representative example of adaxial and abaxial volume estimation and cropping. Snapshot of a single optical slice from a z stack of 4DAS old seedlings showing manual demarcation of adaxial and abaxial cells for cropping (yellow outlines) along the domain of PIN1-GFP expression (gray) in the vasculature. (B) Example of resulting nuclear categorisation after cropping, grouped by abaxial (blue), adaxial (yellow), and discarded tissue (magenta). (C–E) Quantification steps in 3D nuclei, illustrating the initial signal (C), subsequent nuclear segmentation (D), and the resulting DII/mDII ratio within the nuclear volumes (E). (F and G) Violin plots of the distributions of the ratios of mean expressions for abaxial and adaxial nuclei after quality filtering, per seedling and all data pooled together. Jitters show the individual data points (F), and internal boxplots the median values and distribution quartiles, with whiskers extending to 1.5 times the interquartile range (IQR) (G). (H) Ranked ratio Area Under the Curve (AUC) plot and score for the distributions. Abaxial n = 1475, adaxial n = 2006, accumulated over 10 seedlings (20 leaves). Distribution values are given as the ratio of normalised mean DII-3xVENUS-N7 over mean mDII- tdTomato (R2D2) expression within the segmented nuclear volumes.


