Abstract
Objectives.
Chipping fractures of the veneering porcelain are frequently reported for veneered all-ceramic crowns. In the present study, the edge chipping test is used to measure the toughness and the edge chipping resistance of veneered zirconia and porcelain-fused-to-metal (PFM). The aim is to describe an edge chipping method developed with the use of a universal testing machine and to verify the accuracy of this method to determine the influence of residual thermal stresses on the chipping fracture resistance of veneering porcelain. A finite element analysis (FEA) was used to study the residual stress profiles within the veneering porcelain.
Methods.
Veneered zirconia and PFM bars specimens were submitted to either a fast or a slow cooling protocol. The chipping resistances were measured using the edge chipping method. The load was applied in two different directions, in which the Vickers indenter was placed in the veneering porcelain either parallel or perpendicular to the veneer/framework interface. The mean edge chipping resistance (ReA) and fracture toughness values were analysed. ReA was calculated by dividing the critical force to cause the chip by the edge distance. Kc was given by a fracture analysis that correlates the critical chipping load (Fc) regarding edge distance (d) and material toughness via Kc = Fc/(βd1.5).
Results.
The ReA revealed similar values (p>0.005) of chipping resistance for loads applied in the parallel direction regardless of framework material and cooling protocol. The most chip resistant materials were slow cooled veneered zirconia (251.0 N/mm) and the PFM fast cooled (190.1 N/mm) for loads applied in the perpendicular direction to the veneer/framework interface. Kc values are similar to that for monolithic porcelain (0.9 MPa.√m), with slightly higher values (1.2 MPa.√m) for thermally stressed PFM fast cooled and veneered zirconia slow cooled groups.
Significance.
The developed and reported edge chipping method allows for the precise alignment of the indenter in any specified distance from the edge. The edge chipping method could be useful in determining the different states of residual thermal stresses on the veneering porcelain.
Keywords: Edge chipping, Chipping resistance, Fracture toughness, Dental restorative materials, Porcelain, Zirconia, Residual thermal stresses, Finite element analysis
Introduction
Chipping of the veneering porcelain remains the main reason for the failure of veneered zirconia restorations [1, 2]. Chipping fracture is a typical contact damage failure mode that starts from a wear facet on the occlusal surface [3]. As a consequence, microcracks developed under the contact zone will propagate as a single crack within the veneer material [4]. Chipping fracture is usually limited to the veneering ceramic layer [5, 6] due to the lower fracture toughness and, to a lesser extent, lower modulus of the porcelain relative to the framework material. As a result, even when large chipping occurs the core material remains largely unexposed, usually with a thin veneer ceramic layer attached to the core surface.
The association between contact damage and residual thermal stresses has been pointed out as the cause of the excessively high frequency of clinically observed chipping [7]. Residual thermal stresses are generated to the veneer material during cooling at the end of the last cooling cycle, and variables such as cooling rate, the coefficient of thermal expansion of the materials, and the thickness ratio between core and veneer are known to play an important role [8, 9]. The fast cooling after the last firing cycle is known to introduce high tensile stresses in the veneer layer, which will assist the crack to propagate [10].
In vitro studies that can reproduce and understand the fracture mechanisms and how they are related to the material microstructure are essential to design strategies to prevent fracture and improve dental ceramics as restorative materials [11]. The edge chipping method, for example, has been proposed to evaluate the chipping resistance and fracture toughness of different dental materials [12-21]. The methodology consists of indenting the specimen edge until a chip spalls off. The critical force (Fc) to cause fracture is analyzed as a function of the distance from the edge (d).
The difficulties faced when using the edge chipping method are that the test results are significantly affected by variations in sample preparation, and the determination of edge distance post fracture is also challenging [12]. Also, the type and shape of the indenter may indeed introduce different crack patterns. For example, sharp indenters (e.g. Vickers, Knoop) produce ideal, well-developed radial cracks immediately below the penetrating indenter tip, which extends on median planes containing the load axis and an impression diagonal. Blunt indenters (e.g. Rockwell, Conical), on the other hand, produce significant amounts of extraneous surface damage just outside the contact area (cone cracking) and median-radial cracks are developed only at higher loads and at large indentation distances [22, 23]. There are also divergences in the literature regarding the meaning of the collected values: some authors believe the test results report the strength of the material [14], while others think the results reveal the toughness of the material [21]. The standardization of the edge chipping methods has been suggested so that results from different studies can be compared [12]. However, the discontinuity of the production of an edge chipping testing machine (Engineering Systems Model CK 10, Nottingham, UK) presents a further challenge for the standardisation of this test. An early study by Quinn [12] previously commented on the difficulties to reproduce the test using conventional microhardness indentation or universal testing machines.
Therefore, the objectives of this research study are: (1) to describe an edge chipping method developed with the use of a universal testing machine, and (2) to verify the accuracy of this method to determine the influence of residual thermal stress on chipping resistance of bilayer structures. In addition, finite element analysis (FEA) will be used to study the residual stress profiles within the veneering porcelain. The null hypotheses of the study are that the edge chipping method is not able to distinguish the various residual thermal stresses state on the veneering material and that the bilayer systems have similar chipping resistance.
1. Material and Methods
1.1. Specimen Preparation
The bilayer specimens were prepared in two stages: framework preparation and veneering application.
Pre-sintered bars of zirconia (Y-TZP) were cut from CAD-CAM blocks (VITA In-Ceram YZ-65/40S – 65 mm × 40 mm × 17 mm) using a low-speed diamond saw, and then the surface that would receive the porcelain was ground with a silicon carbide abrasive paper (30 μm, Grit 600/P1200, CarbiMet, Buehler, IL, USA). The specimens were sintered in a box furnace (Lindberg/Blue M, Thermo Fisher Scientific Inc., MA, USA) according to the manufacturer's recommendations. After sintering, the final dimensions of the bar were 32 mm × 4.4 mm × 0.7 mm.
For the porcelain fused to metal (PFM) specimens, the nickel-chromium alloy frameworks were produced using the lost-wax casting technique (Remanium® Cse) in a refractory dye. An oxidation firing of 10 minutes at 600°C (Table 1) was applied according to the manufacturer’s recommendations. Following the oxidation firing, the surface that would receive the porcelain was sandblasted with 50 μm aluminium oxide particles at 4 bars of pressure. The prepared frameworks were cleaned for 5 minutes in ultrasonic bath with distilled water.
Table 1.
Firing chart for the porcelain used to veneering zirconia (VM9) and alloy (VM13) frameworks. Sintering and oxidation firing for zirconia and NiCr alloy frameworks, respectively.
| Material | Start temp. (°C) |
Predrying time (min) |
Heating time (min) |
Heating rate (°C/min) |
Final temp. (°C) |
Holding time for final temp. (min) |
Long- term cooling |
Vacuum holding time |
|
|---|---|---|---|---|---|---|---|---|---|
| VM9 | Base dentine Wash | 500 | 2 | 8.11 | 55 | 950 | 1 | - | 8.11 |
| 1° dentine firing | 500 | 6 | 7.27 | 55 | 910 | 1 | 600 | 7.27 | |
| 2° dentine firing | 500 | 6 | 7.16 | 55 | 900 | 1 | 600 | 7.16 | |
| Glaze firing | 500 | 0 | 5.00 | 80 | 900 | 1 | 600 | - | |
| Zirconia | -- | -- | -- | -- | 1450 | 120 | |||
| VM13 | Base dentine Wash | 500 | 2 | 5.52 | 75 | 940 | 2 | 5.52 | |
| 1° dentine firing | 500 | 6 | 6.55 | 55 | 880 | 1 | 6.55 | ||
| 2° dentine firing | 500 | 6 | 6.44 | 55 | 870 | 1 | 6.44 | ||
| Glaze firing | 500 | 0 | 4.45 | 80 | 880 | 2 | - | ||
| NiCr Alloy | Oxidation firing | 600 | 1 | 7.45 | 55 | 1010 | 10 | 17.45 | |
Then, zirconia and metal frameworks were veneered with their recommended porcelains (VM9 and VM13, respectively - Vita-Zahnfabrik, Germany).
For the veneering procedure, the green bodies were prepared by mixing the porcelain powder with distilled water, pouring the slurry into a stainless steel mould where the framework was sitting on the bottom. The porcelain slurry was condensed with manual vibration, and excess water was removed from the slurry with absorbent paper. Ceramic veneering was sintered according to the manufacturer's recommendations (Table 1). Although the same porcelain powder was used throughout the thickness of the veneer layer, the four dental crown firing protocols were reproduced: base dentine wash, first dentine, second dentine and glaze firing. The final thickness of the porcelain was 1.5 mm.
Ten specimens of veneered zirconia and ten of PFM bar specimens were randomly divided into two groups (fast or slow) according to the last cooling protocol after the glaze firing. For fast cooling, the furnace door was opened immediately at the end of the firing cycle (~ 900 ° C), and the specimen was transferred to an auxiliary tray located next to the furnace for cooling at room temperature (~ 25 ° C). For the slow cooling, the specimen was kept inside the furnace until it reached its glass transition temperature (Tg-VM13 - 570 °C and VM9 - 600 °C), and then it was removed from the furnace.
After sintering, the lateral and tested surfaces were successively polished with diamond suspensions (15, 9, 6, 3 and 1 μm) to obtain a 90° edge suitable for applying the edge chipping force and measuring the chip size.
1.2. The Edge Chipping Test System
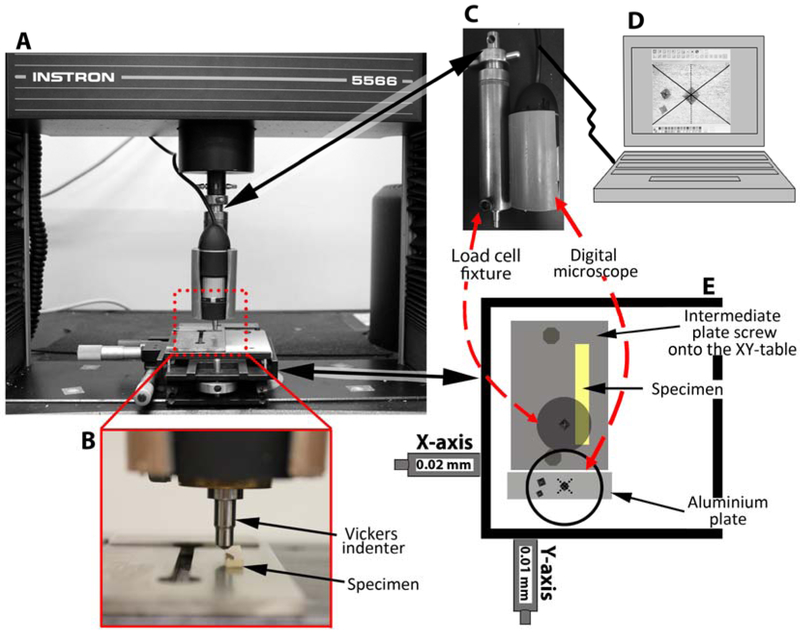
A universal testing machine (Instron 4501, Instron Corp., Canton, MA) was used to perform the edge chipping test. To ensure an accurate distance between the edge and the point of load application, an XY stage was attached to the base of the universal testing machine (Figure 1). A brass customised bar fixture (∅26 mm) was attached with a 6 mm clevis pin to the 500N load cell. At the opposite end of the bar, there was a specific slot (∅6.35 mm) for fixing the Vickers indenter (Shanghai Toyo Diamond Tools Co., LTD, China) for the load application. A digital microscope (USB 400× digital microscope) was also fixed to the bar as shown in Figure 1.
Figure 1.
Edge chipping method. A: Universal testing machine setup. B: Enlarged specimen view. C: Side view of the load cell fixture coupled with the digital microscope. D: The digital microscope software view used to verify the indenter alignment setup. E: Top view of the XY-table coupled to the universal testing machine.
An acetate sheet with reference lines was placed on top of the computer screen. The solid X-shaped lines were coinciding with the diagonals of the software window, and the central meeting point was exactly in the image centre given by the microscope. A reference line (dotted) was drawn passing through the image centre. The dotted line guaranteed the parallelism between the specimen edge and one of the Vickers diagonal (Figure 1).
A sequence of alignments was performed before the start of the test. First, the XY stage was assembled in a way that its X and Y displacements coincided with the X and Y directions shown in the microscope image.
The specimen, which was glued to a stainless steel plate, had to have its edges parallel to the table Y-axis, and the parallelism needed to be verified by the alignment between the specimen edge and the dashed line (Figure 1). This alignment should be maintained along the Y-table offset. Once the specimen was aligned, the stainless steel plate was screwed and locked into the XY-table.
The next step was to align one of the Vickers diagonals with the stage Y-direction (Figure 1).
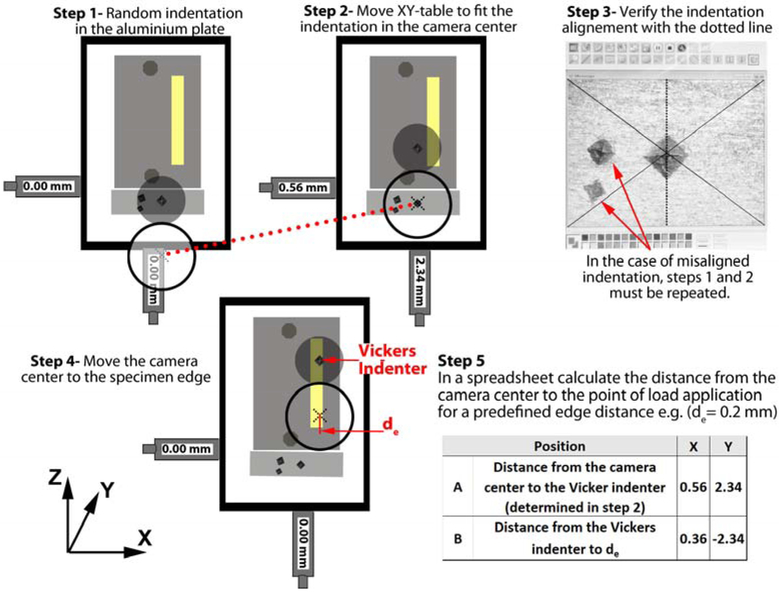
This process was accomplished via four steps as described below:
STEP 1: A random indentation was made in an aluminium plate attached to the XY table.
STEP 2: The stage was moved in both directions (X-Y) towards the camera until the indentation impression was centred in the computer screen.
STEP 3: Once the indentation image was shown on the computer screen, the next step was to ensure that one of the Vickers diagonals coincided with the central dashed line.
In case of misalignment, a slight turn on the indenter was made, and the steps 1 to 3 were repeated until perfect alignment was achieved (Figure 2).
Figure 2.
Steps to align the Vickers indenter with the specimen edge for the edge chipping procedure.
Once the indenter was adjusted, an additional step was taken to ensure the alignment between the specimen edge and the Vickers indenter.
STEP 4: The camera centre was moved to the specimen edge.
STEP 5: The X and Y-axis movements required to position the Vickers indenter to the predefined edge distance where the load was applied were calculated in a spreadsheet.
1.3. Test Procedure
A set up for compressive testing was used to apply the indentation load, at a speed rate of 0.1 mm/min, until fracture. A 10% drop in the applied loading could be detected by the machine, stopping the test automatically. The specimens were tested in two ways: the load was applied parallel or perpendicular to the core/veneer interface.
Edge distance (d) was defined as the point of the load applied to the specimen edge. The edge chipping resistance (ReA) was calculated (Eq. 1) for each chip produced by dividing the Fc (in N), by the edge distance (d, in mm) (CEN/TS 843-9:2010).
| (1) |
The mean edge chipping resistance was analysed by three-way analysis of variance (ANOVA) to determine the interaction effect between cooling protocol, framework material and load direction. A significance level of 5% was pre-defined for all tests.
The apparent toughness (Kc) was calculated based on the fracture mechanics analysis [21] that correlates the critical chipping load (Fc) regarding edge distance (d) and material toughness Kc (Eq. 2).
| (2) |
where β = 9.3 is a dimensionless coefficient.
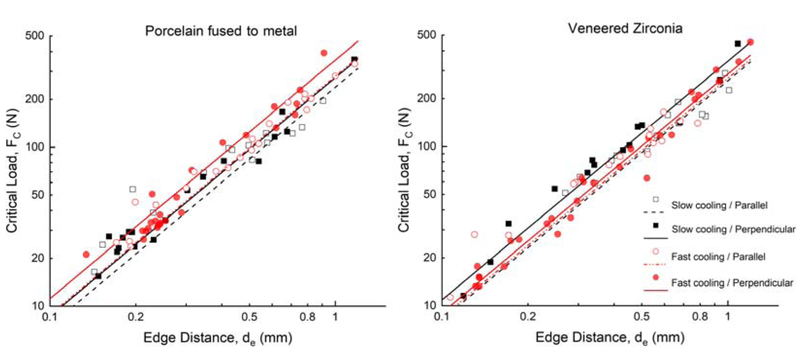
The data of each indentation was plotted as a function of critical load (Fc) versus the edge distance (Figure 6). The best fit to the chipping data was obtained by a regression fit of Eq. 2 with a fixed slope of 1.5 [21].
Figure 6.
Plot of chipping load Fc versus indentation edge distance d. The lines represent the best fits of Eq. (2).
1.4. Finite Element Analysis
Four three-dimensional (3D) FEA models were built based on the experimental design. Only a quarter of the specimen’s geometry was represented, due to its symmetrical nature (Figure 3). After a convergence test, the final model consisted of 9000 eight-node hexahedral elements. The numerical analyses were performed with MSC.Marc (MSC Software, Santa Ana, CA, USA) and consisted of two steps: heat transfer analysis (element 123 of the Marc.Mentat program) and residual thermal stress analysis (element 117 of the Marc.Mentat program).
Figure 3.
(A) Experimental sample design with an indication of the two possible loading directions. (B) FEA model: Geometry and mesh of the quarter model, showing the boundary conditions of fixed displacements in x- and Z-directions, due to geometrical symmetry.
a. Heat transfer analysis
The two cooling protocols, fast and slow, were simulated by convective heat transfer, from the last firing cycle until reaching the thermal equilibrium with the environment (25° C). Convective cooling was simulated using constant heat transfer coefficients (Table 2) applied at the external veneering porcelain surfaces.
Table 2.
Thermal and mechanical properties of the materials.
| Material | Conductivity (W/mm°C) |
Specific heat (J/kg°C) |
Density (kg/mm3) |
Elastic modulus (GPa) |
Poisson’s ratio |
α solid (ppm°C−1) |
Ref# |
|---|---|---|---|---|---|---|---|
| NiCr alloy | 40 × 10−3 | 500 | 8,0 × 10⁻⁶ | 204 | 0,3 | 14,0 | [22] |
| VM13 | 1,5 × 10⁻³ | 840 | 2,4 × 10⁻⁶ | Fig. 4 | 0,21 | 13,1 | [22,23] |
| Y-TZP | 2,0 × 10⁻³ | 450 | 6,0 × 10⁻⁶ | 210 | 0,3 | 10,5 | [24,25] |
| VM9 | 1,5 × 10⁻³ | 840 | 2,4 × 10⁻⁶ | Fig. 4 | 0,21 | 9,3 | [22,23] |
For the slow cooling, an initial temperature corresponding to the porcelain Tg (Tg VM9 - 600°C; Tg VM13 - 570°C) was applied, assuming that all the stresses generated above the glass transition temperature (Tg) were relieved due to the viscoelastic behaviour of the porcelain. Therefore, to simulate the fast cooling process, it was assumed that there was no time for stress relaxation between the softening temperature (Ts) and Tg. Thus, an initial temperature corresponding to the porcelains Ts (Ts VM9 - 670°C; Ts VM13 - 635°C) was used.
b. Residual thermal stress analysis
A corresponding mechanical model was created for each thermal model, using the thermal profile outputs of the heat transfer analysis of input data so that the transient and residual thermal stresses could be calculated.
Fast cooling models simulated changes in the coefficient of thermal expansion and elastic modulus of the porcelain as the cooling temperature passed through the glass transition zone (Figure 4), between the softening temperature (Ts) and the glass transition temperature (Tg). Slow cooling models used constant values of elastic modulus and CTE. Thus, for slowly cooled models, the residual thermal stresses generated were solely due to the coefficient mismatch between the porcelain and the infrastructure material.
Figure 4.
Graph of elastic modulus and coefficient of thermal expansion of the veneering porcelain for alloy (VM13) and zirconia (VM9) framework as a function of temperature. Glass transition temperature (Tg) for VM9=600°C, VM13=570°C and softening temperature (Ts) for VM9=670°C and VM13=635°C
The nodes of symmetry planes were fixed in x or z directions (Figure 3) and a single node at the intersection of these two planes was restricted in the y-direction to avoid rigid body motion.
The Y and Z stress components were the criteria used to analyze the residual thermal stresses in the veneering porcelain for loads applied either parallel or perpendicular to the interface, respectively.
The positive values of these components corresponded to tensile stresses at each region, in which high tensile stresses tend to facilitate crack propagation, while the negative values correspond to the compressive stresses. High negative tends to close critical flaws, protecting the veneer layer.[24-27]
2. Results
2.1. Edge Chipping Test
The results of the edge chip resistance and fracture toughness (Kc) are presented in Table 3.
Table 3.
Edge chipping results for an edge distance values ranging between 0.1 and 1.2 mm.
| Material | Cooling | Load direction |
Edge chipping resistance, ReA, (N/mm) |
Fracture Toughness, Kc |
|---|---|---|---|---|
| MPa.m1/2 | ||||
| PFM | Slow | Parallel | 193.3 ab | 0.8 |
| Perpendicular | 163.3 b | 0.9 | ||
| Fast | Parallel | 211.8 ab | 1.0 | |
| Perpendicular | 190.1 ab | 1.2 | ||
| Veneered zirconia | Slow | Parallel | 205.9 ab | 0.9 |
| Perpendicular | 251.0 a | 1.2 | ||
| Fast | Parallel | 197.8 ab | 0.9 | |
| Perpendicular | 184.3 ab | 1.0 |
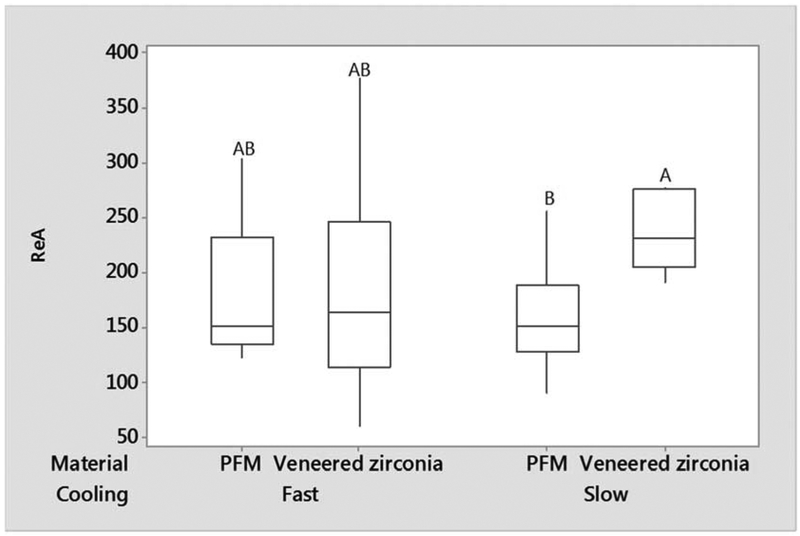
The statistical analysis revealed similar ReA values for groups in which loads were applied parallel to the porcelain-framework interface regardless of framework material and cooling protocol. A significant difference (p = 0.005) was found in the groups where the load was applied perpendicularly to the porcelain-framework interface (Figure 5), in which slowly cooled veneered zirconia showed the highest chipping resistance (251.0 N/mm) while slow cooled PFM presented the lowest chipping resistance (ReA= 163.3 N/mm).
Figure 5.
Boxplot of ReA data for the perpendicularly loaded groups, as a function of materials and cooling rate.
A similar outcome was obtained in the regression fit (Figure 6) analysis of the Kc. The mean fracture toughness was 0.95 MPa.√m ± 0.14, with a slightly higher toughness value for the slow cooled veneered zirconia and fast cooled PFM loaded perpendicularly.
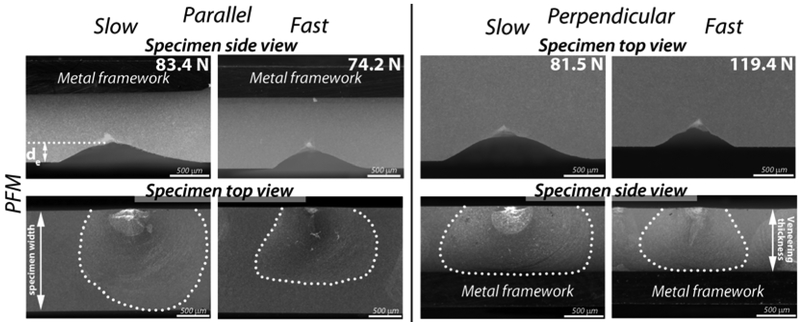
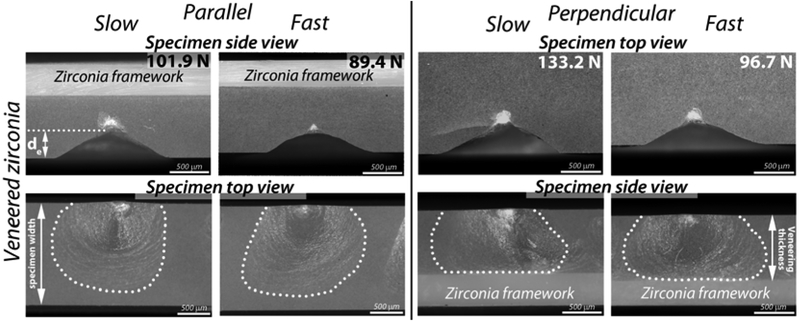
Figs. 7 and 8 show the chipping pattern for specimens loaded with an edge distance of 0.5 mm. The chipping outline in parallel load directions runs unrestricted through the specimen width. In the perpendicular loading direction, once the chip reaches the veneer/framework interface, the veneer material spalled off, and the crack does not penetrate the framework material. There is a chipping geometry similarity regardless of the cooling protocol and the different framework materials.
Figure 7.
Chipping pattern for PFM specimens loaded with an edge distance of 0.5 mm. The dotted line delineates the chip outline in the top view for parallel loaded specimens and in the side view for perpendicularly loaded ones.
Figure 8.
Chipping pattern for veneered zirconia specimens loaded with an edge distance of 0.5 mm. The dotted line delineates the chip outline in the top view for parallel loaded specimens and the side view for perpendicularly loaded ones.
2.2. Finite Element Analysis
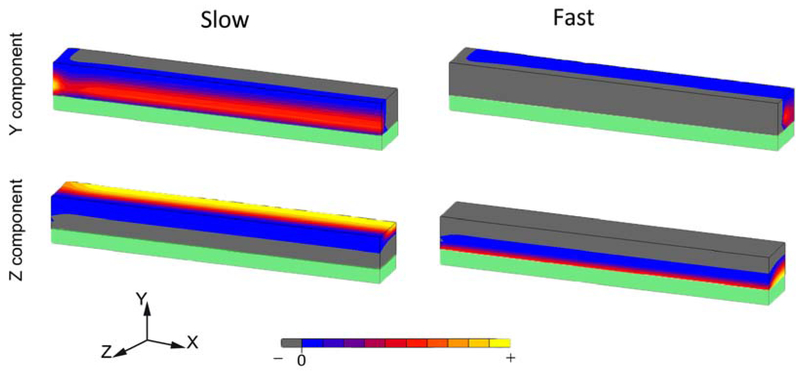
The stress distribution pattern shown in Figure 9 applies for both metal and zirconia frameworks. It was observed that the thermal residual stress distribution of Y and Z components at the veneering porcelain were not affected by the infrastructure materials. An inversion of the stress distribution pattern was observed between slow and fast cooling: the locations with negative values (compression stress) in the slowly cooled porcelain presented positive (tensile) values for the fast cooled samples, and vice-versa.
Figure 9.
Thermal residual stress distribution, Y and Z components, in porcelain veneers cooled with the slow or fast protocol. Representation of ¼ the specimen.
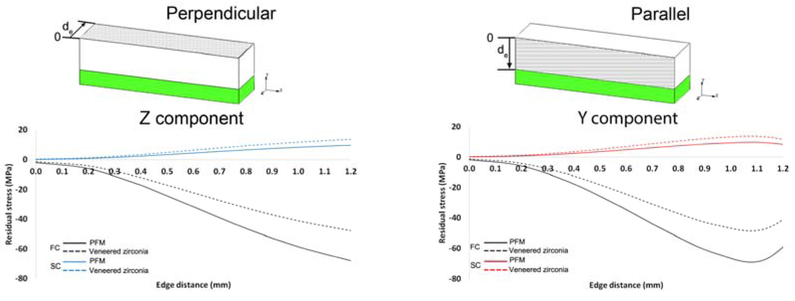
The values of Z and Y-component were presented in graphs of the residual stresses as a function of the edge distance (Figure 10). Z component results were used to evaluate the stress profile that was relevant when loads were applied to the top veneer surface (perpendicular direction), while Y-component stress profile was analyzed for loads applied to the veneer side walls (parallel direction).
Figure 10.
Y and Z components of the residual thermal stresses as a function of edge distance.
The PFM specimens showed the same stress profile as the corresponding veneered zirconia ones, but with stresses values nearly three times greater stresses than those for veneered zirconia. The Y-component values for slowly cooled specimens loaded in a parallel direction presented values near to zero at the edge. These values increased gradually until reaching a peak at a distance of 1.1 mm from the edge. A similar profile was observed for Z-components, with the highest stresses for larger values of edge distance.
Simultaneously, an inversion of stress distribution was observed for the two different cooling protocols regardless of load direction (Figure 9). Predominantly compressive stresses (negative values) were observed for fast cooling and tensile stresses (positive values) for the slow cooled ones.
3. Discussion
This study presented an alternative method for the edge chipping test using a universal tester. Although edge chipping test has been described by numerous authors, this set-up provides an original, precise and accurate way to measure the edge distance (d) previous to the test, using a universal test machine.
We have shown that the Instron universal testing machine can be adapted with an XY- table and a digital camera to provide precise alignment between the indenter and the specimen edge before the test. Although this system does not allow a direct view of the microscope image to the load application point, it was possible to establish a correlation between the first indentation made in the alignment process and the central point of the microscope image.
Such device prevents the overchipping problem described by Quinn [14]. An error due to an overestimated edge distance occurs in the result interpretation when the measurements are done in a post-test examination.
Using a correlation system between the X and Y coordinates, it was possible to move the XY-table to the exact point previously chosen under the microscope. The present study is a step forward for standardising the edge chipping method as a new tool for the characterisation of dental restorative materials [12]. Once the testing device becomes largely available, it will allow reproduction of the edge chipping data in different laboratories around the world.
The edge chipping method using a Vickers indenter allows the measurement of the fracture toughness and chipping resistance under controlled conditions in a well-defined testing configuration. In the case of a sharp indenter, the crack nuclei propagate immediately below the indenter tip. This initial crack then propagates through the material, and the fracture chips present a certain geometrical similarity. Thus, the edge chipping method allows applying basic fracture mechanics analysis to investigate the chipping resistance and the fracture toughness of ceramics materials [20, 21, 28]. The edge chipping mechanical tests were complemented by a finite element analysis to illustrate better the relationship between residual thermal stresses and edge chipping resistance.
Edge chipping resistance values were similar when the load was applied in a parallel direction for all the groups evaluated. This indicates that the chipping process for parallel loading is exclusively driven by the properties of the veneered porcelain, not being significantly affected by the framework properties or the thermal residual stresses. On the other hand, when the samples were loaded in the perpendicular direction, the edge chipping method was useful in determining the influence of the residual stresses of different materials system.
A significant difference in the chipping resistance was observed between the two bilayer systems when the samples were subjected to the slow cooling protocol. The veneered zirconia samples loaded perpendicularly presented the highest edge chipping resistance and the PFM samples under the same conditions showed the lowest edge chipping resistance values.
Indeed large pieces of the veneer porcelain spontaneously detached from the metal framework for the slow cooled PFM samples during load application. The lower edge chipping resistance for these samples can be related to the thermal effects on the NiCr Alloy. Lin et al. [29] have shown an increase of the oxides on the surface of NiCr alloys after a firing protocol similar to the one applied in the present study (Table 1). Although the manufacturer recommends an oxidation process before the veneer application, the slow cooling may have formed new surface oxides, which may have affected the bonding between core/veneer.
However, the perpendicular loading direction enhanced the fracture load over that of the parallel direction. On the other hand, the apparent fracture toughness was less affected by the different load directions. Kc values are similar to those of monolithic porcelain samples (0.9 MPa.√m) reported in a previous study [21]. This seems to be because when the crack approaches the interface, the crack is much larger than the initial crack length. At this point, crack growth unstably and the chipping failure will occur catastrophically [30]. In addition, a large amount of strain energy was released during the propagation process, and the stress intensity factor at the crack tip was not sufficient for the crack penetrate the high modulus framework material [31].
The slightly higher Kc value for PFM fast cooled and veneered zirconia slow cooled (1.2 MPa.√m) could be due to residual compressive stresses that can increase the load necessary to initiate the median cracks or modify the crack growth velocity [32]. The finite element analysis (Figure 9) confirmed the presence of a superficial and an internal compressive zone for the fast and slow cooling protocols, respectively.
An unexpected similar chipping resistance of the veneered zirconia samples was observed. The chipping resistance of the veneered zirconia was not greatly affected by differences in the cooling protocols when loaded in perpendicular orientation. Fast and slow cooled veneered zirconia behaved similarly. This is different from clinical outcomes in which a higher chipping incidence is associated with the fast cooling protocol [2, 33]. The larger data scatter of fast cooled veneered zirconia suggests that the different chipping resistance might be due to the heterogeneous stress distribution in the layered systems.
The different fracture resistance between veneered zirconia and PFM could also be attributed to the different porcelains used. The traditional feldspathic porcelain was initially developed as a veneering material for metallic frameworks with the primary goal of adjusting the coefficient of thermal expansion (CTE) between the porcelain and the metal frameworks in PFMs [34]. In order to achieve a lower coefficient of thermal expansion and produce veneering porcelain compatible with zirconia frameworks, the manufacturers have to reduce the leucite crystals. In that case, it should be expected that PFM veneering porcelain would present higher chipping resistance since it contains a higher amount of leucite [35]. However, the leucite particle improves the mechanical properties up to certain amount. Studies [36, 37] have shown that an amount of leucite over 20 wt.% can significantly reduce the mechanical properties due to residual thermal stresses associated with the large mismatch of CTE between the leucite crystals and the surrounding glass matrix.
Porcelains are a complex composite of 1 to 30% leucite crystals and oxides distributed in a glass matrix [35]. These materials are often referred to as a homogeneous glass material. However, due to the leucite particles, the dental porcelain has a non-linear thermal expansion when compared with other glasses. The leucite crystal has a coefficient of thermal expansion of 25 × 10−6 °C−1 at 450 °C and reduces to 15 × 10−6 °C−1 at temperatures above 580°C. Simultaneously with the CTE change, leucite exhibits a reversible displacive (martensitic) transformation. The leucite crystals go from the tetragonal phase at room temperature to the cubic phase at 600°C [38]. During the porcelain cooling the cubic leucite returns to tetragonal and both phases coexist at approximately 400°C [38]. The leucite presents a nonlinear volume change which occurs during the tetragonal to cubic transformation at approximately 400°C [39], which is a temperature well below the glass transition of porcelain (TgVM9= 600°C, TgVM13=570°C). The leucite crystal’s discontinuous volume change happens while it is embedded in a rigid glass matrix. As a result, stresses are generated in the glass matrix around the leucite particles, which could facilitate crack propagation.
However, there is no consensus in the literature about the effect of leucite crystals on the mechanical properties of dental porcelains. There are studies [35, 40] showing that the leucite particles can improve the material fracture toughness, due to microcracks and crack deflection mechanism. Another study [36] mentioned that if the leucite content is larger than 30% in volume, it can result in high residual stresses between the glass matrix and the leucite particles, generating initial flaws that can subsequently propagate through the material. Another possibility is that the presence of leucite has no effect on the mechanical properties of the material and that the fracture strength of the porcelain depends solely upon the glass properties [41].
The chipping resistance of PFM was greatly affected by the slow cooling protocol. The FEA models presented two distinct patterns of thermal residual stress distribution when slow or fast cooling protocol was applied. However, the thermal residual stress distribution pattern did not change with the framework material; only its magnitude was higher for the metal framework (Figure 9). The thermal residual stresses present in the veneering porcelains plays an important role in the crack propagation. The stresses oriented perpendicular to the crack is known to assist or prevent the crack propagation (Figure 9) depending on whether they are tensile or compressive, respectively. Therefore, Y and Z-components were chosen due to its orientation being perpendicular to the radial cracks formed along the indenter diagonal. FEA analysis showed that the cooling rate inverted the thermal residual stress distribution profile. Locations with negative values (compression stresses) in the slowly cooled veneering porcelain showed to be positive for fast cooling, and vice-versa (Figure 9). This inversion occurred due to the large change in CETL of the porcelain at the glass transition zone. The overall mismatch between the CETL of the framework and the veneering porcelain (Figure 4) is negative (αinfrastructure <αporcelain) for temperatures above Tg (which corresponds to the fast cooling simulation), but it is positive (αinfrastructure > αporcelain) when only temperatures below Tg are included (which represents the slow cooling simulation).
Slow cooling models considered that all thermal stresses generated above porcelain Tg are relieved due to either the viscoelastic behaviour of the porcelain between its Tg and Ts or the viscous behaviour above its Ts. Thus, no additional stresses are taken into account for the determination of the resultant residual stresses besides the α mismatch between core and veneer porcelain below Tg. Therefore, the slow cooling models assumed that the porcelain glass transition temperature was the initial temperature and the CTE mismatch was positive during the whole cooling simulation. In this case, porcelain on zirconia presented slightly higher stresses than porcelain on metal for two reasons: (1) greater thermal jump between the Tg of the zirconia (Tg zirconia 600 °C and Tg metal 570 °C) and room temperature (25 °C) and (2) larger CETL mismatch between the framework and the veneering materials (αzirconia - αPorcelain = 1, 2 °C−1 / αmetal - αPorcelain = 0,9 C−1).
For fast cooling, it was assumed that the high viscosity porcelain did not have sufficient time for stress relaxation in the temperature range between the liquid and the glass state. The stress generated due to the lack of molecular rearrangement additionally to α mismatch was taken into account for the fast cooling simulation [42]. In the temperature interval between porcelain Ts and Tg, the CTE mismatch between framework and porcelain was mostly negative, and the thermal stresses generated below the Tg did not compensate the overall thermal stress generated by the negative mismatch. It explains the inversion in the thermal residual stress pattern.
Thereafter, a higher chipping resistance in fast cooled specimens would be expected, since the point of load application is in the compressive stress region. In that case, the load applied would need to exceed the compressive stresses to initiate a crack that would subsequently propagate [42]. However, this finding is not in agreement with our experimental results, since slow cooled veneered zirconia presented the higher ReA values.
A few assumptions may explain the differences between the results of finite element analysis and the experimental approach. Firstly, the stress distribution is not uniform, so residual stresses are almost zero near the edge and become larger away from the edge (Figure 10). Since most indentations were performed with small d, a less stress-prone region would have been tested and therefore its effect would not be predominant. Additionally, a superficial release of residual stress may have occurred during the polishing required to generate specimens with a flat surface. It may have removed a few microns of the superficial layer; however, it should not have affected the comparison between the groups, as all were equally grinded. Fig. 10 shows that changes in the stress states start to occur at a distance ~0.2 mm from the edge.
Another limitation of the FEA method is the simulation of the real viscoelastic behaviour of porcelain at high temperatures. In the present study, a complete stress relief above Tg was assumed for both slow cooling and fast cooling groups. No stress relaxation due to the viscoelasticity of porcelain was simulated. This element may be crucial for determining residual stresses in porcelain veneers.
Finally, the difference found between the present experimental results and clinical reports is most likely due to the geometric difference between a bar specimen and a complex geometry specimen, such as a dental crown. The positive mismatch between the framework CTE and the veneering porcelain is recommended due to the hoop stresses that arise in the porcelain with geometry similar to the cylindrical configuration [43]. Future studies with a crown-like geometry are important to understand the role of residual thermal stress on the chipping fracture problems of zirconia-based restorations in daily clinical practice.
4. Conclusion
The null hypothesis was rejected, and the PFM and veneered zirconia specimens had different chipping resistance. The slow cooled veneered zirconia presented significantly higher chipping resistance. Our findings revealed that the edge chipping method could be useful in determining the different states of residual thermal stresses on the veneering porcelain. The device developed with a digital microscope and an XY-table allows a precisely align between the indenter and a specified distance from the edge.
Highlights:
Describe an edge chipping method developed with the use of a universal testing machine
Residual thermal stresses reduced the chipping resistance of veneering porcelain
The edge chipping method could be useful in determining the different states of residual thermal stresses on the veneering porcelain
Acknowledgements
This work was supported by the Brazilian agencies FAPESP (2012/17094-5; 2013/06988-8); CAPES (BEX 4909/13-5); and in part, by the United States National Institutes of Health, National Institute of Dental and Craniofacial Research (grant number. R01DE026772 and R01DE026279).
Footnotes
Publisher's Disclaimer: This is a PDF file of an unedited manuscript that has been accepted for publication. As a service to our customers we are providing this early version of the manuscript. The manuscript will undergo copyediting, typesetting, and review of the resulting proof before it is published in its final citable form. Please note that during the production process errors may be discovered which could affect the content, and all legal disclaimers that apply to the journal pertain.
References
- [1].Sailer I, Makarov NA, Thoma DS, Zwahlen M, Pjetursson BE. All-ceramic or metal-ceramic tooth-supported fixed dental prostheses (FDPs)? A systematic review of the survival and complication rates. Part I: Single crowns (SCs). Dent Mater. 2015;31:603–23. [DOI] [PubMed] [Google Scholar]
- [2].Pjetursson BE, Sailer I, Makarov NA, Zwahlen M, Thoma DS. All-ceramic or metal-ceramic tooth-supported fixed dental prostheses (FDPs)? A systematic review of the survival and complication rates. Part II: Multiple-unit FDPs. Dent Mater. 2015;31:624–39. [DOI] [PubMed] [Google Scholar]
- [3].Pang Z, Chughtai A, Sailer I, Zhang Y. A fractographic study of clinically retrieved zirconia-ceramic and metal-ceramic fixed dental prostheses. Dent Mater. 2015;31:1198–206. [DOI] [PMC free article] [PubMed] [Google Scholar]
- [4].Scherrer SS, Quinn JB, Quinn GD, Kelly JR. Failure analysis of ceramic clinical cases using qualitative fractography. Int J Prosthodont. 2006;19:185–92. [PubMed] [Google Scholar]
- [5].Belli R, Petschelt A, Lohbauer U. Thermal-induced residual stresses affect the fractographic patterns of zirconia-veneer dental prostheses. J Mech Behav Biomed Mater. 2013;21:167–77. [DOI] [PubMed] [Google Scholar]
- [6].Guess PC, Zavanelli RA, Silva NR, Bonfante EA, Coelho PG, Thompson VP. Monolithic CAD/CAM lithium disilicate versus veneered Y-TZP crowns: comparison of failure modes and reliability after fatigue. Int J Prosthodont. 2010;23:434–42. [PubMed] [Google Scholar]
- [7].Holst S, Geiselhoringer H, Nkenke E, Blatz MB, Holst AI. Updated implant-retained restorative solutions in patients with hypodontia. Quintessence Int. 2008;39:797–802. [PubMed] [Google Scholar]
- [8].Swain MV. Unstable cracking (chipping) of veneering porcelain on all-ceramic dental crowns and fixed partial dentures. Acta Biomater. 2009. [DOI] [PubMed] [Google Scholar]
- [9].Kim J, Dhital S, Zhivago P, Kaizer MR, Zhang Y. Viscoelastic finite element analysis of residual stresses in porcelain-veneered zirconia dental crowns. J Mech Behav Biomed Mater. 2018;82:202–9. [DOI] [PMC free article] [PubMed] [Google Scholar]
- [10].Paula VG, Lorenzoni FC, Bonfante EA, Silva NRFA, Thompson V, Bonfante G. Slow cooling protocol improves fatigue life of zirconia crowns. Dental Materials. 2015;31:77–87. [DOI] [PubMed] [Google Scholar]
- [11].Shah MB, Ferracane JL, Kruzic JJ. R-curve behavior and micromechanisms of fracture in resin based dental restorative composites. Journal of the Mechanical Behavior of Biomedical Materials. 2009;2:502–11. [DOI] [PubMed] [Google Scholar]
- [12].Quinn GD. On edge chipping testing and some personal perspectives on the state of the art of mechanical testing. Dent Mater. 2015;31:26–36. [DOI] [PMC free article] [PubMed] [Google Scholar]
- [13].Quinn GD, Giuseppetti AA, Hoffman KH. Chipping fracture resistance of dental CAD/CAM restorative materials: part 2. Phenomenological model and the effect of indenter type. Dent Mater. 2014;30:e112–23. [DOI] [PMC free article] [PubMed] [Google Scholar]
- [14].Quinn GD, Giuseppetti AA, Hoffman KH. Chipping fracture resistance of dental CAD/CAM restorative materials: part I--procedures and results. Dent Mater. 2014;30:e99–e111. [DOI] [PMC free article] [PubMed] [Google Scholar]
- [15].Quinn JB, Quinn GD, Hoffman KM. Edge Chip Fracture Resistance of Dental Materials. Mechanical Properties and Performance of Engineering Ceramics and Composites Vii. 2013:71–84. [Google Scholar]
- [16].Quinn JB, Sundar V, Parry EE, Quinn GD. Comparison of edge chipping resistance of PFM and veneered zirconia specimens. Dental Materials. 2010;26:13–20. [DOI] [PMC free article] [PubMed] [Google Scholar]
- [17].Watts DC, Issa M, Ibrahim A, Wakiaga J, Al-Samadani K, Al-Azraqi M, et al. Edge strength of resin-composite margins. Dent Mater. 2008;24:129–33. [DOI] [PubMed] [Google Scholar]
- [18].Zhang Y, Chai H, Lee JJ, Lawn BR. Chipping resistance of graded zirconia ceramics for dental crowns. J Dent Res. 2012;91:311–5. [DOI] [PMC free article] [PubMed] [Google Scholar]
- [19].Zhang Y, Lee JJW, Srikanth R, Lawn BR. Edge chipping and flexural resistance of monolithic ceramics. Dental Materials. 2013;29:1201–8. [DOI] [PMC free article] [PubMed] [Google Scholar]
- [20].Ilie N, Hilton TJ, Heintze SD, Hickel R, Watts DC, Silikas N, et al. Academy of Dental Materials guidance—Resin composites: Part I—Mechanical properties. Dental Materials. 2017;33:880–94. [DOI] [PubMed] [Google Scholar]
- [21].Chai H, Lawn BR. A universal relation for edge chipping from sharp contacts in brittle materials: A simple means of toughness evaluation. Acta Materialia. 2007;55:2555–61. [Google Scholar]
- [22].Zhang Y, Bhowmick S, Lawn BR. Competing fracture modes in brittle materials subject to concentrated cyclic loading in liquid environments: Monoliths. J Mater Res. 2005;20:2021–9. [Google Scholar]
- [23].Chai H. On the mechanics of edge chipping from spherical indentation. International Journal of Fracture. 2011;169:85–95. [Google Scholar]
- [24].Suansuwan N, Swain MV. Determination of elastic properties of metal alloys and dental porcelains. J Oral Rehabil. 2001;28:133–9. [DOI] [PubMed] [Google Scholar]
- [25].Anusavice KJ, Hojjatie B. Effect of thermal tempering on strength and crack propagation behavior of feldspathic porcelains. J Dent Res. 1991;70:1009–13. [DOI] [PubMed] [Google Scholar]
- [26].Gostemeyer G, Jendras M, Dittmer MP, Bach FW, Stiesch M, Kohorst P. Influence of cooling rate on zirconia/veneer interfacial adhesion. Acta Biomater. 2010;6:4532–8. [DOI] [PubMed] [Google Scholar]
- [27].Tholey MJ, Swain MV, Thiel N. Thermal gradients and residual stresses in veneered Y-TZP frameworks. Dent Mater. 2011;27:1102–10. [DOI] [PubMed] [Google Scholar]
- [28].Flanders LA, Quinn JB, Wilson OC, Lloyd IK. Scratch hardness and chipping of dental ceramics under different environments. Dental Materials. 2003;19:716–24. [DOI] [PubMed] [Google Scholar]
- [29].Quinn JB, Sundar V, Parry EE, Quinn GD. Comparison of edge chipping resistance of PFM and veneered zirconia specimens. Dent Mater. 2010;26:13–20. [DOI] [PMC free article] [PubMed] [Google Scholar]
- [30].Kruzic JJ, Arsecularatne JA, Tanaka CB, Hoffman MJ, Cesar PF. Recent advances in understanding the fatigue and wear behavior of dental composites and ceramics. Journal of the Mechanical Behavior of Biomedical Materials. 2018;88:504–33. [DOI] [PubMed] [Google Scholar]
- [31].Chen CR, Pascual J, Fischer FD, Kolednik O, Danzer R. Prediction of the fracture toughness of a ceramic multilayer composite – Modeling and experiments. Acta Materialia. 2007;55:409–21. [Google Scholar]
- [32].Belli R, Frankenberger R, Appelt A, Schmitt J, Baratieri LN, Greil P, et al. Thermal-induced residual stresses affect the lifetime of zirconia-veneer crowns. Dent Mater. 2013;29:181–90. [DOI] [PubMed] [Google Scholar]
- [33].Rathmann F, Bomicke W, Rammelsberg P, Ohlmann B. Veneered zirconia inlay-retained fixed dental prostheses: 10-Year results from a prospective clinical study. Journal of dentistry. 2017;64:68–72. [DOI] [PubMed] [Google Scholar]
- [34].Denry IL. Recent advances in ceramics for dentistry. Crit Rev Oral Biol M. 1996;7:134–43. [DOI] [PubMed] [Google Scholar]
- [35].Cesar PF, Yoshimura HN, Miranda WG, Okada CY. Correlation between fracture toughness and leucite content in dental porcelains. Journal of dentistry. 2005;33:721–9. [DOI] [PubMed] [Google Scholar]
- [36].Kon M, Kawano F, Asaoka K, Matsumoto N. Effect of leucite crystals on the strength of glassy porcelain. Dent Mater J. 1994;13:138–47. [DOI] [PubMed] [Google Scholar]
- [37].Lee HH, Kon M, Asaoka K. Influence of modification of Na2O in a glass matrix on the strength of leucite-containing porcelains. Dent Mater J. 1997;16:134–43. [DOI] [PubMed] [Google Scholar]
- [38].Mackert JR, Butts MB, Morena R, Fairhurst CW. Phase-Changes in a Leucite-Containing Dental Porcelain Frit. Journal of the American Ceramic Society. 1986;69:C69–C72. [Google Scholar]
- [39].Ong JL, Farley DW, Norling BK. Quantification of leucite concentration using X-ray diffraction. Dental Materials. 2000;16:20–5. [DOI] [PubMed] [Google Scholar]
- [40].Quinn JB, Quinn GD, Sundar V. Fracture Toughness of Veneering Ceramics for Fused to Metal (PFM) and Zirconia Dental Restorative Materials. J Res Natl Inst Stand Technol. 2010;115:343–52. [DOI] [PMC free article] [PubMed] [Google Scholar]
- [41].Meirelles PD, Spigolon YO, Borba M, Benetti P. Leucite and cooling rate effect on porcelain-zirconia mechanical behavior. Dent Mater. 2016;32:e382–e8. [DOI] [PubMed] [Google Scholar]
- [42].Meira JBC, Reis BR, Tanaka CB, Ballester RY, Cesar PF, Versluis A, et al. Residual stresses in Y-TZP crowns due to changes in the thermal contraction coefficient of veneers. Dental Materials. 2013;29:594–601. [DOI] [PubMed] [Google Scholar]
- [43].Rekow ED, Zhang GM, Thompson V, Kim JW, Coehlo P, Zhang Y. Effects of Geometry on Fracture Initiation and Propagation in All-Ceramic Crowns. Journal of Biomedical Materials Research Part B-Applied Biomaterials. 2009;88b:436–46. [DOI] [PubMed] [Google Scholar]


