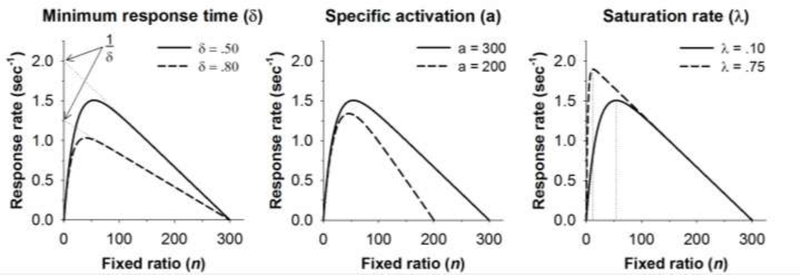
Figure 1.

The effects of changes in minimum response time (δ), specific activation (a), and saturation rate (λ) on the shape of the MPR function drawn by Eq. 1. The base function (solid line) in each panel is drawn with δ = .50, a = 300, and λ = .10. An increase in minimum response time to δ = .80 (left panel) is evident in a reduction in the maximum response rate (1/δ), which is the extrapolated Y-intercept of the descending limb of the function (dotted lines, left panel). A reduction in specific activation to a = 200 (middle panel) is reflected as a decrease in the X-intercept of the descending limb of the function. Finally, an increase in saturation rate to λ = .75 shifts the peak of the function to the left. The vertical dotted lines (right panel) indicate that an FR 54 maximizes response rates when λ = .10 whereas an FR 12 maximizes response rates when λ = .75.
