

Summary
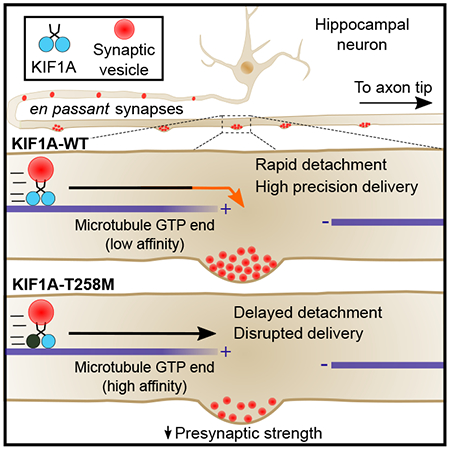
Neurons in the central nervous system establish thousands of en passant synapses along their axons. Robust neurotransmission depends on the replenishment of synaptic components in a spatially precise manner. Using live-cell microscopy and single-molecule reconstitution assays, we find that the delivery of synaptic vesicle precursors (SVPs) to en passant synapses in hippocampal neurons is specified by an interplay between the kinesin-3 KIF1A motor and presynaptic microtubules. Presynaptic sites are hotspots of dynamic microtubules rich in GTP-tubulin. KIF1A binds more weakly to GTP-tubulin than GDP-tubulin and competes with EB proteins for binding to the microtubule plus-end. A disease-causing mutation within KIF1A that reduces preferential binding to GDP- vs. GTP-rich microtubules disrupts SVP delivery and reduces presynaptic release upon neuronal stimulation. Thus, the localized enrichment of dynamic microtubules along the axon specifies a localized unloading zone that ensures the accurate delivery of SVPs, controlling presynaptic strength in hippocampal neurons.
Graphical Abstract
In Brief
Guedes-Dias et al., combine live and single-molecule imaging to show that local enrichment of microtubule GTP plus-ends at en passant synapses specifies high-precision delivery of synaptic vesicles by KIF1A. Intrinsic weak binding of KIF1A to GTP-tubulin induces motor detachment at presynapses and regulates synaptic strength in hippocampal neurons.
Introduction
Presynaptic sites are specialized regions in the axon that are packed with synaptic vesicles containing neurotransmitters; their maintenance is essential for neuronal function [1]. Action potentials induce Ca2+ influx that triggers synaptic vesicle fusion with the plasma membrane at the active zone. After fusion, synaptic vesicles are endocytosed, refilled with neurotransmitter and may undergo another round of fusion. Synaptic vesicles are estimated to recycle 200 times and remain in use for ~18 hours, after which they are targeted for degradation [2]. Central nervous system neurons can establish thousands of synaptic contacts en passant along their extensive axonal arbor [3]. Thus, the replenishment of presynaptic sites with new synaptic vesicles in a timely and spatially-precise manner is of critical importance to ensure sustained and reliable neurotransmission.
Synaptic vesicle precursors (SVPs) are synthesized in the soma, transported along the axon, and eventually captured at presynaptic sites where they mature to synaptic vesicles [4]. The transport of SVPs along microtubules is mediated by the kinesin-3 motor KIF1A [5] and cytoplasmic dynein [6]. SVP transport can be further controlled by KIF1Bβ [7] and regulatory proteins that interact with KIF1A and modulate motor activity, including DENN/MADD [7], liprin-α/SYD-2 and CASK/LIN-2 [8], SAM-4/Myrlysin, the BORC complex, and Arl-8 [9]. Regulation of SVP transport is critical for presynapse formation [10], but it remains unclear how the localized delivery of SVPs is specified and sustained.
En passant synapses sit in close juxtaposition to microtubules [11], which form a polarized, tiled array along the length of the axon [12]. Proper organization of the microtubule array at presynapses has been shown to be important for presynaptic function in Drosophila motor neurons [13] and a recent study has shown that moving cargo pause frequently at microtubule ends along the axons of C.elegans motor neurons [14]. Together, these observations raise the interesting possibility that the microtubule network displays particular organizational features at presynaptic sites that act as a code to specify local cargo delivery.
Here, we elucidate the mechanisms specifying SVP delivery to presynaptic sites. En passant synapses are hotspots enriched for dynamic microtubule plus-ends; SVPs preferentially pause at these sites. In vitro reconstitution studies indicate that KIF1A binds more weakly to GTP-enriched microtubule plus-ends relative to the GDP-rich lattice. Thus, the local enrichment of GTP-rich microtubules plus-ends significantly increases the probability of SVP pausing at the presynapse. Quantitative analysis indicates that this mechanism ensures a supply rate of SVPs at the presynapse that is in tune with the estimated synaptic vesicle lifetime. To test our model, we identified a disease-causing mutation within KIF1A loop 11 that inhibits the lattice selectivity of KIF1A, and found this mutation specifically disrupts SVP delivery and reduces presynaptic strength. Our studies provide evidence that microtubule organization and the intrinsic properties of the KIF1A motor cooperate to achieve the specific and precise delivery of presynaptic cargo required to sustain synaptic vesicle replenishment at en passant synapses.
Results
Anterograde-moving SVPs are specifically delivered to presynaptic sites with high precision
We first assessed whether retention of SVPs along axons occurs preferentially for cargo moving in one direction, since this could provide evidence for a motor-specific mechanism. We imaged fluorescently-labeled synaptophysin (Syp) in synaptically connected 14-15 days in vitro (DIV) primary rat hippocampal neurons. Imaging of whole-axon-collaterals showed that the anterograde flux of SVPs steadily decreases along the length of each collateral (Figure 1A and 1B). In contrast, retrograde flux is consistently lower and more uniform along the axon (Figure 1C). This observation indicates that retention occurs preferentially when SVPs are transiting in the anterograde direction.
Figure 1. Retention of anterograde-moving axonal SVPs at presynaptic sites is preceded by highly precise pausing.
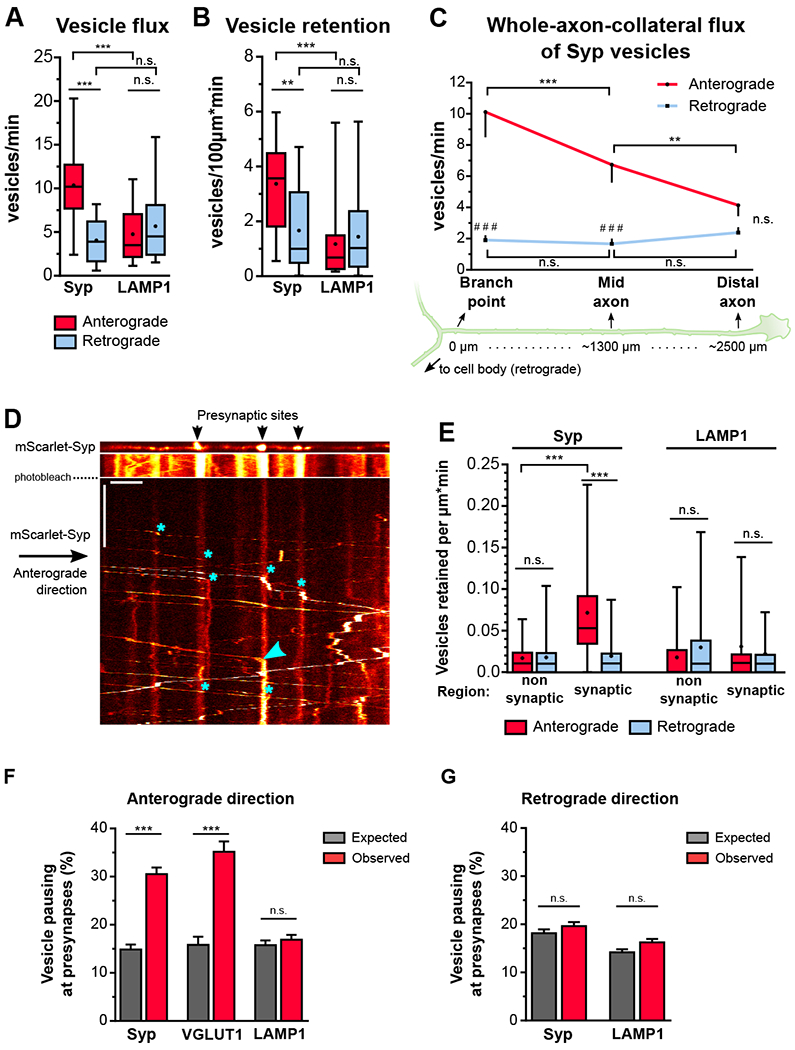
A) Flux and retention (B) of axonal SVPs and LAMP1 vesicles (n=18-21 axons from 5 independent cultures; n.s., not significant, **p<0.01, ***p<0.001; two-way ANOVA with Sidak’s post-hoc test). C) Flux of SVPs along non-branching whole-axon collaterals (n=8 axons from 3 independent cultures; (*) compares between axonal regions, (#) compares between directions; n.s., not significant, **p<0.01, ***/###p<0.001; two-way ANOVA with Sidak’s post-hoc test). D) Motility of SVPs along an axonal section of an mScarlet-Syp expressing neuron. Upper panel: still showing presynaptic sites (Syp clusters); lower panels: kymograph of Syp-positive vesicles. The axonal section was photobleached to allow the clear visualization and tracking of the SVP motile fraction. Asterisks show seven representative pausing sites of anterograde-moving Syp-vesicles and the arrowhead points to a retention event. E) Retention of axonal SVPs and LAMP1 vesicles at synaptic and non-synaptic regions (n=31-46 regions per group from 14-18 axons from 3-4 independent cultures; n.s., not significant, ***p<0.001; two-way ANOVA with Tukey’s post-hoc test). F) Relative frequency of anterograde- and (G) retrograde-moving Syp, VGLUT1 and LAMP1 vesicle pauses within 1μm of presynapse centroid (Syp: 1139 anterograde pauses, 2322 retrograde pauses and 40 presynaptic sites observed in 6 axons from 3 independent cultures; average±SEM spacing between presynapses=18.3±4.0μm; VGLUT1: 465 anterograde pauses, and 38 presynaptic sites observed in 7 axons from 2 independent cultures; spacing between presynapses=12.1±1.3μm; LAMP1: 1469 anterograde pauses, 2905 retrograde pauses, and 56 presynaptic sites detected in 10 axons from 4 independent cultures; spacing between presynapses=21.8±7.3μm; average±SD; n.s. not significant, ***p<0.0001; oneway ANOVA with Sidak’s post-hoc test. See also Figure S1, S2, and S3.
Next, we asked whether retention of mobile SVPs occurs specifically at presynapses (Figure 1D). Anterograde-moving SVPs were retained within 1 μm of the synaptic region at an average rate of 0.07 vesicles/min, ~5-fold higher than in non-synaptic regions (Figure 1E). In contrast, and despite their slower velocity and higher frequency of pausing (Figure S1A-B), the retention rate of retrograde-moving SVPs was relatively low and region-independent (Figure 1E).
To determine whether the bias for presynaptic retention of anterograde-moving vesicles was specific to SVPs, we expressed fluorescently-labeled LAMP1 to visualize late endosomes/lysosomes, an organelle population that is primarily transported by KIF5 in the axon [15]. In contrast to SVPs, LAMP1 vesicles exhibited similar fluxes in both anterograde and retrograde directions (Figures 1A). Furthermore, retention of LAMP1 vesicles was low and independent of movement direction and axonal region (Figures 1B and 1E).
Next, we asked whether the preferential retention of SVPs at presynaptic regions occurs via a stochastic or a targeted mechanism. In a stochastic model, SVPs may pause randomly along the axon but vesicles pausing closer to presynaptic sites are more likely to be retained. In a targeted model, the processive transport of SVPs is preferentially interrupted at presynapses, thus increasing the local SVP pool available for retention. To assess which model best fit the data, we measured the distance of each SVP pause to the nearest presynapse and compared the resulting distribution to one that was computationally generated to represent a stochastic model of vesicle pausing (see Methods). Strikingly, a higher frequency of pausing close to presynaptic sites was detected specifically for SVPs moving in the anterograde direction. Our measurements performed in axonal sections with long presynaptic spacing (average: 12-21 μm), reveal that the probability of a single anterograde-moving Syp vesicle pausing within 1 μm of any given presynaptic site is about 30%, effectively 2-fold higher than chance would predict (Figure 1F and S3A). These results were confirmed using a second SVP marker (VGLUT1) and strongly support a targeted-pausing model of SVPs at presynaptic sites (Figure 1F and S3B). In contrast, retrograde-moving SVPs, and both anterograde and retrograde LAMP1 vesicles, displayed a random pausing pattern along the axon, supporting the model of stochastic pausing for these populations (Figure 1F-G, S3A and S3C).
These observations can be compared to dense-core vesicles (DCVs; Figure S1), a vesicle population involved in neuropeptidergic signaling that is relatively enriched at presynaptic sites in hippocampal neurons [16]. Studies have shown that the anterograde transport of DCVs in neurons is primarily mediated by KIF1A [17]. Expressing neuropeptide-Y (NPY) to visualize this cargo, we found that anterograde-moving DCVs are 1.5-fold more likely to pause within 1 μm of a presynapse than would be predicted by chance (Figures S2E and S2F). This likelihood is intermediate between our observations for SVPs and LAMP1 vesicles and might reflect the coupled control of DCV anterograde transport by both KIF1 and KIF5, as recently reported [17, 18]. Retrograde-moving DCVs tended to pause 1.25-fold closer than expected to presynaptic sites, but DCV retention was higher in the anterograde direction and occurred specifically at presynaptic sites (Figures S2A-F). These data from synaptically active primary neurons are consistent with previous observations in Drosophila motor neurons. There, presynaptic delivery of DCVs was shown to occur in both anterograde and retrograde directions [19] however, upon activity, DCVs are replenished preferentially by anterograde transport [20].
In sum, our measurements reveal that the probability of a single anterograde-moving SVP pausing within 1 μm of any given presynaptic site is around 30%, and effectively 2-fold higher than chance would predict (Figure 1F, S3A-B). This sustains a retention rate of 0.055 SVPs per 1 μm of synaptic region each minute for a total of 0.11 SVPs retained within ± 1 μm of the center of a presynaptic site (Figure 1E). Based on the observation of an average flux of 10 SVPs per minute (Figure 1A) we estimate an average SVP retention probability of 1.1% for any given en passant synapse. As proof of concept, we determined whether these estimations could accurately predict presynapse number and spacing in whole-axon collaterals. In these measurements, we observed a decrease of 3 SVPs per minute in sections separated by about 1250 μm (Figure 1C). If on average 1.1 SVPs are retained per 100 presynapses every minute, this indicates that along each section there were 272 en passant synapses spaced on average by 4.6 μm – a number which is in good agreement with the presynapse spacing found in rat hippocampal axons in vivo [3].
Dynamic microtubules specify anterograde SVP delivery at en passant synapses
Microtubule organization is an important determinant of axonal transport [13, 14]. For example, microtubule termini were identified as points of pausing for transiting cargoes in C. elegans [14]. We hypothesized that if microtubule termini are a limiting factor in the anterograde transport of SVPs, the increased frequency of SVP pausing observed at en passant synapses could potentially be explained by a local enrichment of microtubule plus-ends at these sites. To test this, we imaged the dynamics of fluorescently-labeled end-binding protein 3 (EB3) in mature hippocampal neurons (Figure S4A). Neuronal microtubules are dynamic, exhibiting cycles of growth and shrinkage at plus-ends. EB3 is a microtubule plus-end binding protein (+TIP) that is recruited to the growing plus-end of microtubules and forms a comet-like pattern in live-cell imaging that can be used to visualize microtubule dynamics in live neurons [21]. Although information on microtubule length, number or spacing cannot be deduced from monitoring EB3 dynamics, the appearance of an EB3 comet necessarily reflects the presence of a polymerizing microtubule plus-end at that site and the disappearance of the comet indicates where microtubule polymerization terminates. We mapped the spatial location of each initiation and termination event of EB3-mScarlet comets along the axon and performed a nearest neighbor analysis to assess whether these events occurred closer to each other than expected. This analysis showed that both initiation and termination events spatially clustered along the axon (Figure S4B), as if specific points along the axon act as hotspots for the initiation and termination of microtubule polymerization.
Co-expression of EB3-mScarlet with either of the presynaptic markers EGFP-Syp or EGFP-VGLUT1 revealed that EB3 hotspots closely overlap with en passant synapses (Figure 2A). The distance of each comet initiation or termination event to the nearest presynapse was determined and the resulting distributions were compared to the distributions expected if these events occurred randomly along the axon. Our measurements showed that EB3 comet initiation and termination occurred significantly more frequently within 1 μm of en passant synapses than predicted by chance (Figure 2B). Moreover, while presynaptic regions covered just 19% of axonal length, the density of EB3 comet initiation and termination events within this area was 50% higher compared to non-synaptic regions (Figure 2C), indicating that presynapses are sites of high microtubule dynamicity. Consistent with these observations, immunostaining revealed a marked enrichment of GTP-tubulin, also a marker for dynamic microtubule plus-ends, at presynaptic sites (Figure 2D and S4D-E).
Figure 2. Enrichment of dynamic microtubule plus-ends at presynaptic sites specifies SVP delivery and retention.
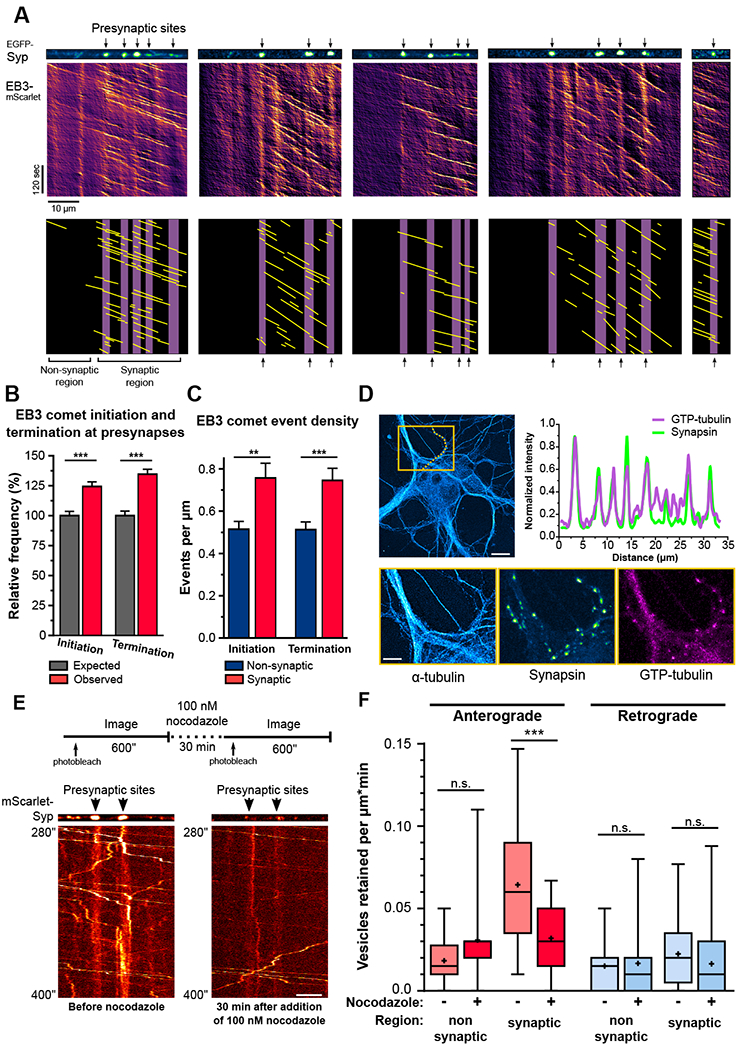
A) Microtubule dynamics on five different axonal sections co-expressing EGFP-Syp and EB3-mScarlet. Lower panels are the annotated kymographs with purple bars representing the presynaptic area and the yellow lines the trajectories of EB3 comets. B) Relative frequency of EB3 comet initiation and termination events within 1μm of presynapse centroids. (n=3211 EB3 initiation events, 3169 EB3 termination events, and 554 presynaptic sites observed in 57 axons from 5 independent cultures; average±SEM spacing between presynapses=14.1±1.4μm; average±SD; ***p<0.0001; one-way ANOVA with Sidak’s post-hoc test. C) Density of EB3 initiation and termination events in synaptic and non-synaptic regions (n=57 axons from 5 independent cultures; average±SEM; **p<0.01, ***p<0.001; Mann-Whitney U test). D) Enrichment of GTP-tubulin at presynaptic sites.. Upper panels: orange box represents inset area; line scan (orange dotted line) shows the synapsin and GTP-tubulin intensity plots along a synaptically connected axon. Lower panels: insets of the α-tubulin, synapsin, and GTP-tubulin channels. E) Experimental design for imaging SVP delivery in the same axonal section before and after nocodazole addition and representative kymographs. F) SVP retention before and after 30 min of 100nM nocodazole treatment (n=25 synaptic and 12 non-synaptic regions from 7 axons from 3 independent cultures; n.s., not significant, ***p<0.001; two-way ANOVA with Sidak’s post-hoc test). See also Figure S4.
To test whether local microtubule organization and dynamics are critical determinants for precise SVP delivery to en passant synapses, we treated neurons with low-dose nocodazole. This treatment dampens microtubule dynamics and increases the catastrophe frequency of dynamic microtubules without inducing general disassembly of the microtubule network [22]. Given the high microtubule dynamicity at en passant synapses, we predicted that local microtubule organization would particularly be affected by drug treatment. The same axonal regions of mature hippocampal neurons expressing mScarlet-Syp were imaged before, and 30 min after, the addition of 100 nM nocodazole, a treatment protocol that successfully dampened microtubule dynamics without affecting microtubule-dependent fast axonal transport (Figure 2E and S4F). Strikingly, low-dose nocodazole was sufficient to curtail the retention rate of anterograde-moving SVPs at presynaptic sites, effectively reducing SVP replenishment to en passant synapses (Figure 2F and S4G-H).
Overall, these results indicate that local microtubule dynamics and the enrichment of microtubule plus-ends specify delivery of presynaptic cargo at en passant synapses and provide the mechanistic basis for why long-term low-dose nocodazole treatment was observed to decrease presynaptic density in cortical neurons [23].
KIF1A runs preferentially terminate at dynamic microtubule plus-ends
Like the kinesin-1 motor KIF5, evidence suggests that the kinesin-3 motor KIF1A transports cargo as a dimer [24, 25], but KIF1A is faster and more processive than KIF5 in assays using taxol-stabilized microtubules in vitro [25]. In light of the enrichment of dynamic microtubule plus-ends at presynapses, we asked whether the motor proprieties of KIF1A are tuned to promote rapid navigation along the length of the microtubule while also ensuring that run termination occurs preferentially at the microtubule plus-end.
To investigate this hypothesis, we used an in vitro TIRF assay to reconstitute and visualize kinesin motility on dynamic microtubules. This system allows for the direct assessment of how kinesin binding and motility are affected on a single dynamic microtubule composed of a primarily GDP-tubulin lattice terminating in a GTP-tubulin-enriched plus-end region, under different growth states. Dimeric tetramethylrhodamine (TMR) ligand-labeled HaloTag KIF1A(1-393) or KIF5C(1-560) obtained from cell lysates were flowed together with fluorescently-labeled tubulin heterodimers into chambers containing surface-immobilized GMPCPP-stabilized microtubule seeds, which act as templates for microtubule elongation. In addition to the expected higher velocity and processivity of KIF1A over KIF5C (Figure S5), we observed intriguing differences in the motility behavior of the two motors on dynamic microtubules. The initiation and termination of KIF5C runs occurred randomly along microtubules (Figure 3A and S6E-F). In contrast, KIF1A runs rarely initiated within 1.8 μm of the microtubule plus-end tip (Figure 3C), a section that lies within the predicted ~1-2 μm-long GTP-tubulin-enriched region at the microtubule plus-end [26]. Also, the majority of KIF1A runs terminated within this region of the microtubule (Figure 3D). Preferential termination of KIF1A runs within 1.8 μm of the plus-end region persisted even when microtubules doubled in size from ~15 μm to 30-40 μm and KIF1A runs increased to 20-30 μm in length (Figure 3B). As microtubules as long as 40 μm have been described in axons of young rat hippocampal neurons in culture [12], we imaged KIF1A motility along microtubules up to 55 μm-long and consistently observed 30-50 μm-long runs that terminated within the GTP-rich region at the microtubule plus-end (Figure S6A). This indicates that KIF1A tends to cover the entire distance from the point of run initiation to the microtubule plus-end region (Figure S6B-C). In agreement, we found KIF1A run length to be closely coupled with the length of the microtubule (Figure 3E).
Figure 3. Processive runs of the SVP motor KIF1A terminate preferentially at dynamic microtubule plus-ends and their length is coupled to the microtubule length.
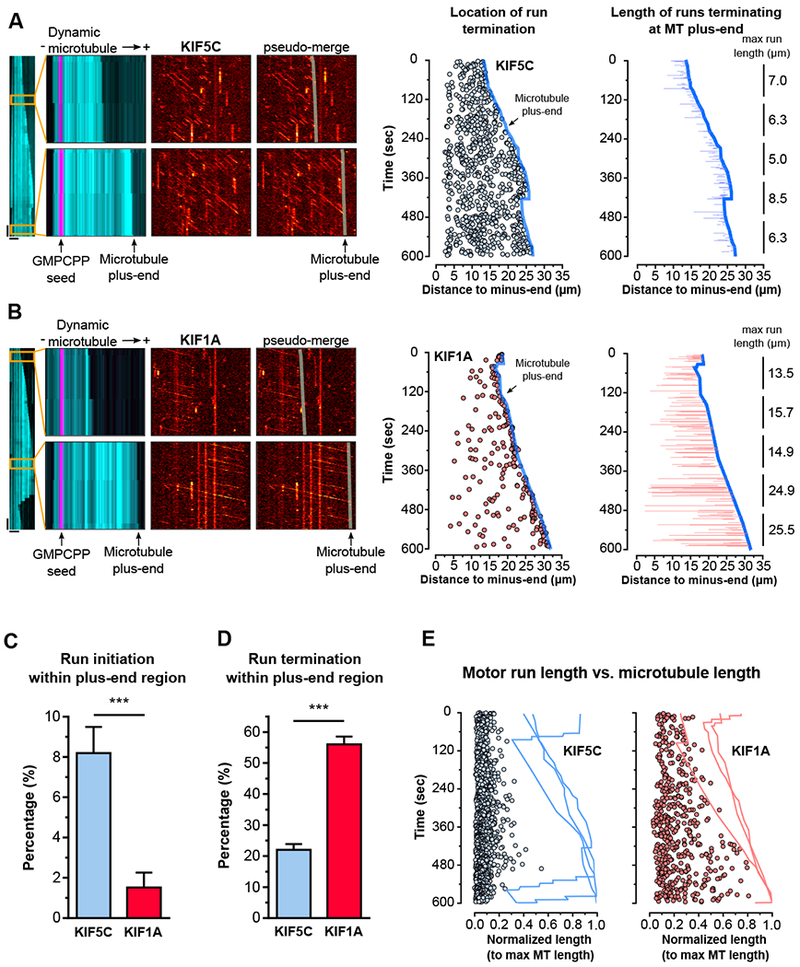
A) KIF5C(1-560)-HaloTag motility on dynamic microtubules. Left panel shows full kymograph of dynamic microtubule channel. Insets: upper panel shows early time point when the microtubule is short; Left, overlay of dynamic microtubule (cyan) and GMPCPP-stabilized microtubule seed (magenta) channels, (−) and (+) represent the microtubule minus- and plus-end; Center, KIF5C channel; Right, overlay of a line representing the growing microtubule plus-end on the KIF5C channel. Horizontal scale bars: 10 μm; Vertical scale bars: 30 sec. The plot in the middle represents the location of KIF5C run terminations (blue circles) along a growing dynamic microtubule (dark blue line; microtubule plus-end), respective to the distance to the minus-end of that microtubule. The plot on the right shows the length of KIF5C runs (blue lines) that terminated at the plus-end (dark blue line). The numbers refer to the maximum KIF5C run-length observed in 120 seconds periods over 10 minutes. B) same as (A), but for KIF1A(1-393)-HaloTag. C) Percentage of runs initiating and D) terminating within 2μm of a microtubule plus-end (n=1035-1755 runs from 4-6 microtubules; average±95%CI). E) Circles represent KIF1A (red) and KIF5C (blue) run lengths observed on three representative microtubules and normalized to the maximum length of the microtubule they were observed on. The line traces show the dynamic profile of the representative microtubules along time. See also Figure S5 and S6.
Together, these data show that microtubule length is a critical limiting factor for the processivity of KIF1A, but not for KIF5C. Once KIF1A binds to the microtubule lattice it engages in fast, super-processive motility from the initiation point to the microtubule plus-end, where it is rapidly released. This supports a model in which KIF1A cargo transport is particularly prone to halt at sites enriched in microtubule plus-ends, such as presynaptic sites. In contrast, less processive axonal motors, such as KIF5C, more frequently detach and switch tracks along the axonal microtubule array and are less influenced by microtubule length.
Binding of KIF1A to the microtubule lattice is negatively modified by GTP-tubulin and EB proteins, but not tubulin tyrosination
One defining characteristic of the growing microtubule plus-end is the recruitment of multiple microtubule plus-end tracking proteins (+TIPs), including the end-binding protein (EB) family. +TIP recruitment is mediated by the preferential binding of EB proteins to the GTP/GDP-Pi lattice [27, 28] and the local enrichment of tyrosinated α-tubulin [29]. While previous work has suggested that KIF1A remains stably associated with the microtubule once it reaches the plus-end region [30], this behavior was only seen at high expression levels of exogenous motors, conditions that lead to the formation of prominent patches near the cell cortex [31]. Given the very low frequency of KIF1A run initiation detected within the 1.8 μm-long plus-end region of dynamic microtubules (Figure 3C) and the observation that the frequency of KIF1A run termination steeply increased within that region (Figure 3D), we asked how the nucleotide state of tubulin, as well as the tyrosination state of α-tubulin and the presence of plus-end binding proteins might influence the affinity of KIF1A for microtubules.
First, we turned to a minimal in vitro TIRF assay where kinesin binding to GTP- and GDP-like microtubules can be compared directly. Annealing of GTP- and GDP-like microtubules can induce lattice defects that result in frequent motor detachments [32]. Thus, we generated distinct populations of GMPCPP-bound and taxol-stabilized microtubules (considered GDP- and GTP-microtubule analogs; [33], but see [34]) labeled with different fluorophores and then immobilized within the same flow chambers. We introduced dimeric TMR-labeled HaloTag KIF1A(1-393) or KIF5C(1-560) and compared the extent of motor binding in the presence of AMP-PNP, a non-hydrolyzable ATP analog that induces tight binding of kinesins to microtubules. KIF1A bound significantly more strongly to GDP-taxol- than to GMPCPP-stabilized microtubules (Figure 4A and 4B). Stronger binding to GDP-taxol-stabilized microtubules was also observed with purified recombinant KIF1A (Figure S6D) and persisted even at increasing ionic strength (Figure 4C and 4D). In contrast, the neuron-specific kinesin motor KIF5C bound equally well to both microtubule types, as did KIF5B, a ubiquitously-expressed isoform of the same kinesin-1 family (Figure 4A and 4B). While this observation contrasts with a previous report [35], it is supported by recent work using native KIF5 [36].
Figure 4. Binding of KIF1A to the microtubule lattice is negatively affected by GTP-tubulin and EB proteins, but not tubulin tyrosination.
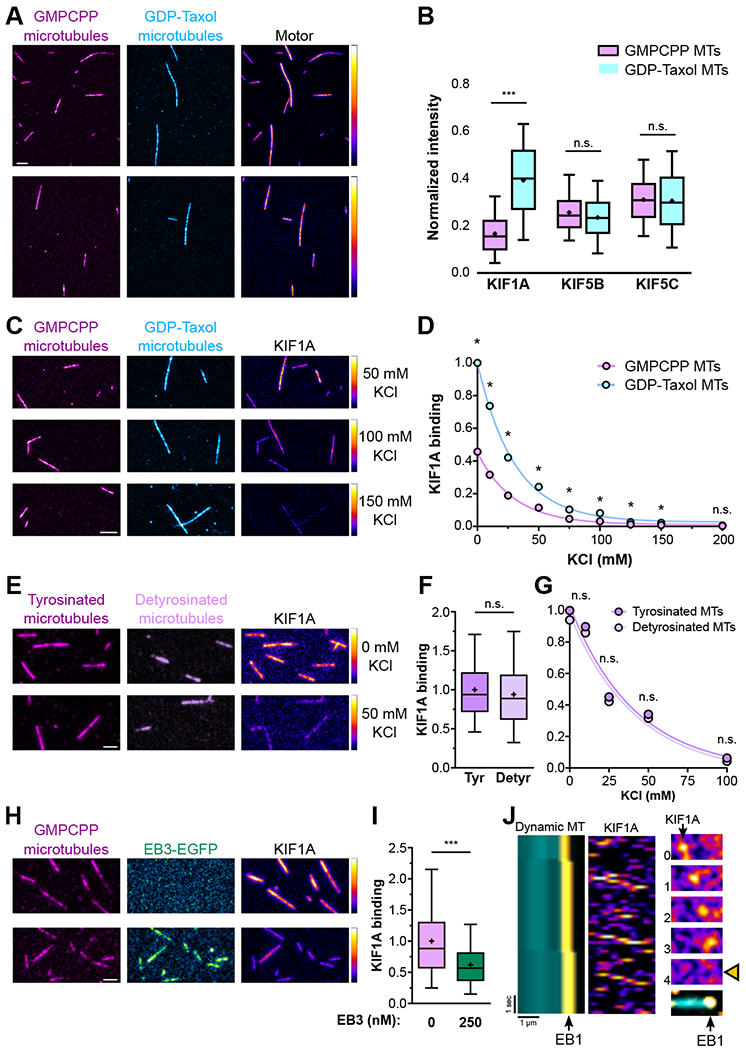
A) Binding and B) quantification of KIF1A, KIF5B, and KIF5C to GMPCPP- and GDP-taxol-stabilized microtubules in the presence of AMP-PNP (n=1004-5855 microtubules per condition; n.s., non-significant, ***p<0.0001; one-way ANOVA with Sidak’s post-hoc test). C) Binding and D) quantification of KIF1A binding to GMPCPP- and GDP-taxol-stabilized microtubules under increasing ionic strength. Circles show mean intensity values; the 95% confidence intervals are too narrow and not visible in the graph. (n=398-2491 microtubules). E) Binding and F) quantification of KIF1A binding to fully tyrosinated and detyrosinated GMPCPP-stabilized microtubules G) under increasing ionic strength. Circles show mean intensity values; the 95% confidence intervals are too narrow and not visible in the graph. (n=2709-6737 microtubules). H) Binding and I) quantification of KIF1A binding to GMPCPP-stabilized microtubules in the presence or absence of EB3 (n=13569-14309 microtubules). J) Representative kymographs and stills depictingKIF1A motors rapidly detaching from a microtubule at the EB1 comet region (asterisks). The stills on the right show one of these events (each time point integrates a 150 msec interval).
Next, we tested whether KIF1A binding to microtubules is directly affected by the α-tubulin tyrosination state by flowing dimeric Oregon Green ligand-labeled HaloTag KIF1A(1–393) into TIRF chambers containing differently labeled GMPCPP-stabilized microtubules that were either fully tyrosinated or detyrosinated [37]. Our results show that KIF1A displays no binding preference to either tyrosinated or detyrosinated microtubules over a wide-range of KCI concentrations (Figure 4E-G). Based on these findings, we propose that the apparent preferential association of KIF1A with tyrosinated microtubules observed in HeLa cells [38] is likely an indirect effect caused by the interaction of KIF1A with other MAPs, as proposed by Lipka et al [39].
Lastly, we tested whether the binding of EB proteins to the dynamic plus-end region affects KIF1A binding to microtubules. Dimeric TMR ligand-labeled HaloTag KIF1A (1–393) was flowed into chambers containing surface-immobilized GMPCPP-stabilized microtubules with or without EB3-EGFP. We noted that EB3 significantly reduced KIF1A binding to microtubules (Figure 4H and 4I). Next, we reconstituted microtubule dynamics in the presence of Rhodamine Red-X-labeled EB1; under these conditions we observed that once KIF1A reaches the EB1-bound microtubule plus-end it rapidly detaches from the microtubule and does not track EB comets (Figure 4J).
Overall, these results suggest that the lower binding affinity of KIF1A motor for GTP-like microtubules and enrichment of EB proteins at the microtubule plus-end act collectively to promote rapid detachment of KIF1A from the microtubule plus-end region.
The KIF1A-T258M mutation abrogates selective binding to the GDP-bound lattice leading to delayed detachment from dynamic microtubule plus-ends
An increasing number of point mutations in the KIF1A gene have been identified in human subjects (see Table S1). These mutations are associated with a variety of neurological symptoms, including spastic paraplegia, intellectual impairment and epilepsy. Most of these mutations map within the KIF1A motor domain, but their effects on the motor activity of KIF1A are largely unknown. In an effort to identify the determinants mediating preferential binding to the GDP-lattice, we screened 18 mutations in KIF1A using our in vitro TIRF assay. Half the disease mutants tested showed loss of ability to bind to microtubules in the presence of AMP-PNP (Table S1). Of the nine mutants capable of microtubule binding, KIF1A-T258M displayed the strongest reduction in preferential binding to GDP-microtubules (Figure 5A and 5B). We further characterized the behavior of this mutant on dynamic microtubules. We found that KIF1A-T258M underwent processive runs, but at a reduced velocity compared to KIF1A-WT (Figure 5C-D and S5). Importantly, while KIF1A-WT runs rarely initiated within 1.8 μm of the microtubule plus-end (Figure 5E; x-intercept = 1.8), we observed that KIF1A-T258M runs were equally likely to initiate anywhere along the microtubule, including the plus-end (Figure 5E; x-intercept = 0). This suggested that a loss of tubulin nucleotide-state recognition in KIF1A-T258M leads to increased motor binding to the GTP-tubulin-rich region at the microtubule plus-end. Supporting this interpretation, when we assessed the motility behavior of two KIF1A disease mutants that, similarly to the WT, showed weaker affinity to GTP-over GDP-like microtubules (A255V and R350G; Figure S5 and Table S1), their runs rarely initiated near the microtubule plus-end (Figure 5F and S6H-K; x-intercept = 1.53 and 1.21).
Figure 5. Weak binding to GTP-tubulin is mediated by the Loop 11 region of the KIF1A motor domain and is important for rapid KIF1A detachment from microtubules.
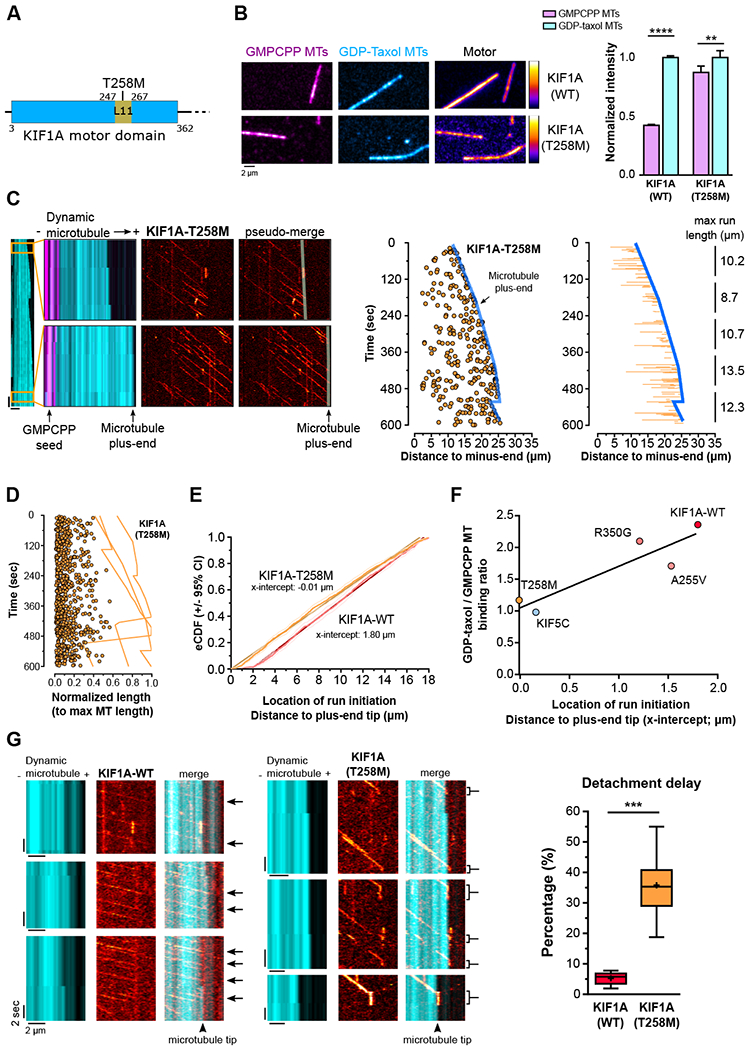
A) KIF1A motor domain. The T258M mutation affects a residue located in KIF1A motor domain loop 11. B) Panels and quantification showing KIF1A-WT and -T258M(1-393)-HaloTag binding to GMPCPP- and GDP-taxol-stabilized microtubules. (n=2303-2351 microtubles per group; average±95%CI; **p<0.01,****p<0.0001; Kruskal-Wallis with Dunn’s post-hoc test). C) same as Figure 3A-B and D) same as Figure 3E but for KIF1A-T258M(1-393)-HaloTag, which is represented in orange. E) eCDF showing the location of KIF1A-WT (red) and KIF1A-T258M (orange) run initiation, respective to the plus-end tip. X-intercepts represent the location on the microtubule where run initiations starts to follow a random pattern. (KIF1A-WT, n=1035 runs from 6 microtubules; KIF1A-T258M, n=1628 runs from 5 microtubules). F) Correlation between GDP-taxol/GMPCPP microtubules binding ratio and distance of run initiation to the plus-end tip. (KIF5C: n=1755 runs from 4 microtubules; KIF1A-WT: n=1035 runs from 6 microtubules; KIF1A-A255V: n=702 runs from 4 microtubules; KIF1A-T258M: n=1628 runs from 5 microtubules; KIF1A-R350G: n=596 runs from 4 microtubules; GDP/GMPCPP MT binding ratio – KIF5C-WT: n=5855/4000; KIF1A-WT: n=2491/2303; KIF1A-A255V: n=2130/1046; KIF1A-T258M: n=2351/2351; KIF1A-R350G: n=2106/1162). G) KIF1A-WT rapidly detaches from microtubules once it reaches the microtubule plus-end, whereas KIF1A-T258M frequently lingers at the microtubule plus-end before detaching. See also Figure S5, S6, and Table S1.
Finally, we also found that KIF1A-T258M runs were shorter compared to KIF1A-WT runs, and generally terminated before reaching the plus-end of the microtubule (Figure S5 and S6G). Yet, in contrast to KIF1A-WT motors, which rapidly detached once within a 1.8 μm-long region at the microtubule plus-end, KIF1A-T258M motors entering this region generally terminated their runs only at the very tip of the microtubule where they would frequently remain attached (Figure 5G). Overall, these data indicate that the intrinsic weak affinity of KIF1A to GTP-like lattices not only limits binding of KIF1A to the microtubule plus-end, but also promotes motor release.
The KIF1A-T258M mutation disrupts presynaptic SVP delivery and reduces presynaptic strength in hippocampal neurons
The KIF1A-T258M mutation is transmitted in an autosomal dominant manner, so affected individuals are heterozygotes [40]. We thus investigated the downstream effects of this mutant on presynaptic function by expressing full-length EGFP-labeled KIF1A-T258M in wild-type hippocampal neurons. To assess SVP delivery to presynaptic sites, neurons were co-transfected with mScarlet-Syp and either KIF1A-WT-EGFP or KIF1A-T258M-EGFP, and the distance to the nearest synapse was measured for each pause observed. Flux, velocity and pause frequencies were identical for KIF1A-WT-EGFP- and KIF1A-T258M-EGFP-positive neurons (Figure S6L-M). However, SVPs in KIF1A-T258M-expressing neurons were significantly less likely to pause at presynaptic sites than SVPs in neurons expressing, in KIF1A-WT (Figure 6A). This suggests that disrupted targeting of SVPs to presynaptic sites in KIF1A-T258M-expressing neurons is a specific consequence of defective fine motor navigation along the axonal microtubule array. The disrupted targeting of SVPs to presynapses eliminated the preferential retention of SVPs at presynapses in KIF1A-T258M neurons by significantly decreasing SVP retention at those sites and increasing SVP retention at non-synaptic regions (Figure 6B).
Figure 6. The KIF1A-T258M disease mutant disturbs presynaptic SVP delivery and decreases presynaptic strength in hippocampal neurons.
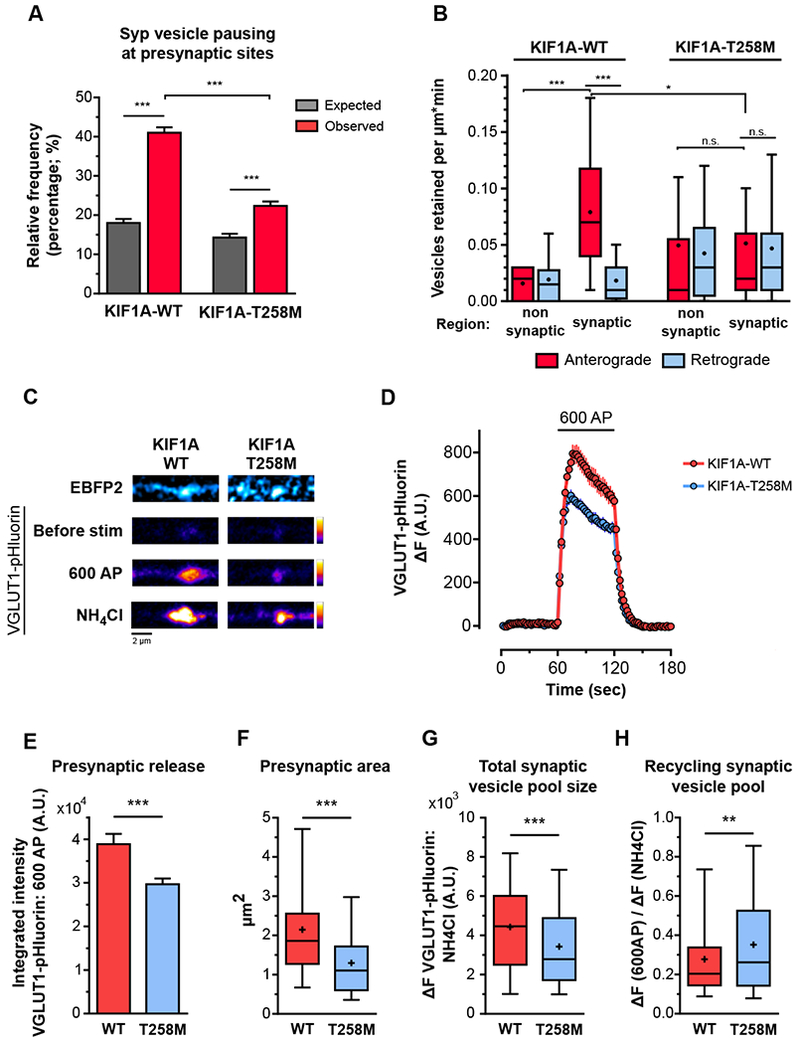
A) Relative frequency of anterograde-moving Syp vesicle pauses within 1μm of presynapse centroid in KIF1A-WT-EGFP- and KIF1A-T258M-EGFP-positive neurons. (KIF1A-WT: 1249 anterograde pauses and 32 presynaptic sites observed in 5 axons from 2 independent cultures; average±SEM spacing between presynapses=12.6±1.9 μm; KIF1A-T258M: 1321 anterograde pauses, and 25 presynaptic sites observed in 6 axons from 2 independent cultures; average±SEM spacing between presynapses=25.2±7.4 μm; average±SD; ***p<0.0001; one-way ANOVA with Sidak’s post-hoc test). B) Retention of anterograde- and retrograde-moving SVPs at synaptic and non-synaptic regions along the axons of KIF1A-WT and KIF1A-T258M-positive neurons (n=14-34 regions per group from 8 axons from 2-3 independent cultures; n.s., not significant, *p<0.05, ***p<0.001; Kruskal-Wallis with Dunn’s post-hoc test). C) Representative images of presynaptic sites of KIF1A-WT-EBFP2- (left) and KIF1A-T258M-EBFP2-positive neurons (right) co-expressing VGLUT1-pHluorin. The EBFP2 signal is shown on the upper panel. The lower panels show the VGLUT1-pHluorin signal at baseline, under electric field stimulation, and after luminal alkalinization with NH4Cl. Plot of VGLUT1-pHluorin signal in KIF1A-WT-EBFP2- and KIF1A-T258M-EBFP2-positive neurons before, during, and after a train of 600 action potential (AP) at 10 Hz. Integrated intensity of the VGLUT1-pHluorin signal during the 600 AP stimulation paradigm (average±SD). F) Area of the presynaptic VGLUT1-pHluorin signal, under stimulation. G) VGLUTI-pHluorin signal intensity at active presynapses after alkalinization with NH4Cl. H) Recycling pool of synaptic vesicles. (n=233-245 presynaptic sites from 3 independent cultures; **p<0.01, ***p<0.0001; Mann-Whitney U test). See also Figure S6.
To determine the consequences of disrupted SVP presynaptic delivery on synaptic function, we visualized synaptic vesicle release using the pH-sensitive probe pHluorin tagged to the luminal domain of VGLUT1. Neurons co-expressing VGLUT1-pHluorin and either full-length KIF1A-WT-EBFP2 or KIF1A-T258M-EBFP2 were stimulated at 10 Hz for 60 sec and alkalinized with NH4Cl once the pHluorin signal returned to baseline (Figure 6C). KIF1A-T258M expression induced a significant reduction in presynaptic release, as the integrated pHluorin intensity over the stimulation period (an indirect measure of neurotransmitter release) was significantly lower in KIF1A-T258M-compared to KIF1A-WT-expressing neurons (Figure 6D and 6E). In accordance with decreased delivery of SVPs to presynapses, we found that the presynaptic site area and the size of the synaptic vesicle pool at presynapses were significantly lower in KIF1A-T258M neurons (Figure 6F and 6G). The reduced synaptic vesicle pool available at KIF1A-T258M synapses resulted in a larger proportion of synaptic vesicles participating in release and recycling (Figure 6H). Importantly, the small influence on synaptic vesicle exo- and endocytosis rates (Figure S6N) indicate that reduced presynaptic strength in KIF1A-T258M neurons is specifically due to impaired synaptic vesicle replenishment rather than major defects on the synaptic vesicle release machinery.
Discussion
Local microtubule dynamics sustain precise anterograde delivery of SVPs at en passant synapses
We propose a model whereby presynaptic replenishment of SVPs is achieved in a highly precise and specific manner by KIF1A. Rapidly-moving anterograde SVPs were 5-fold more likely to be retained at synaptic rather than non-synaptic regions.
How is the local delivery of anterograde-moving SVPs at presynapses sustained? Two mechanisms can be proposed to explain the preferential retention of anterograde-moving SVPs at presynaptic sites: 1) SVPs pause stochastically along the axon and SVPs that happen to pause closer to presynapses have a higher probability of retention; or 2) delivery of SVPs is specified at presynaptic sites by a local mechanism that increases the probability of KIF1A-SVP detachment from microtubules, leading in turn to retention. By assessing the distance of SVP pausing sites to their nearest presynapse, we determined that anterograde-moving SVPs pause within 1 μm of a presynaptic site center point with a probability 2-fold higher than that expected by chance. These observations favor a model of local transport arrest of anterograde-moving synaptic cargo that ensures reliable presynapse replenishment with high precision.
How is the local transport arrest of SVPs at presynaptic sites specified? We identified presynapses as hotspots of high microtubule dynamicity, sites where microtubule polymerization preferentially initiates and terminates. Importantly, dampening microtubule dynamics is sufficient to curtail the anterograde delivery of SVPs to presynapses. The direct visualization of cargo pausing at microtubule termini in vivo [14] supports our model that enrichment of microtubule plus-end tips at presynaptic sites establishes a platform that specifies local anterograde cargo delivery. Because KIF1A tends to run the entire length of the microtubule, the enrichment of microtubule plus-ends at presynaptic sites effectively acts as an unloading zone for KIF1A cargo that is made even more effective by the low affinity of KIF1A for the GTP-rich lattice found at microtubule plus-ends. In contrast, the less processive KIF5 motor likely navigates the axonal microtubule array by switching tracks more often and thus is as likely to pause at synaptic and non-synaptic regions.
Several additional mechanisms contribute to the regulation of KIF1A motor activity. For example, GTP binding to the GTPase Arl-8 induces the release of KIF1A from its autoinhibited state and promotes SVP movement [41]; this mechanism has been implicated in the presynaptic retention of SVPs at en passant synapses in C.elegans [41, 42]. The targeted delivery mechanism we describe here likely acts in concert with Arl-8-dependent motor regulation to achieve efficient synaptic vesicle replenishment at presynapses in the following way: 1) the high density of dynamic microtubule plus-ends increases the probability of KIF1A-SVP pausing at presynaptic sites; 2) Arl8-dependent hydrolysis of bound GTP leads to motor inactivation; 3) inactivated KIF1A releases from the SVP membrane, allowing the SVP to enter the local synaptic vesicle pool.
What controls microtubule organization at presynapses? In Drosophila motor neurons, two Ankyrin2 (Ank2) isoforms were shown to provide synaptic stability by maintaining microtubule organization at presynaptic sites [13]. Loss of Ank2-XL and Futsch/MAP1 decreased the spacing between individual microtubules across synaptic regions, leading to defective presynaptic cargo transport and presynaptic release properties [13]. In C.elegans, factors including EB1 have been implicated in the regulation of the axonal microtubule organization [14]. Additionally, microtubule severing enzymes including spastin may act locally to generate plus-ends, and microtubule-end tethers such as dynein may be important for maintaining microtubule plus-ends in place [23, 43]. Our observations show that microtubules in synaptic regions are highly dynamic; we hypothesize that control of this dynamicity is fluid and can be locally regulated to tune SVP delivery to facilitate synaptic plasticity.
The weak binding affinity of KIF1A to the GTP lattice determines its rapid release from the microtubule plus-end
Structural work has resolved the distinct conformations that αβ-tubulin dimers adopt within either the GTP-enriched lattice at the microtubule plus-end or the GDP-rich lattice throughout the remainder of the microtubule [44]. The GTP-state is characterized by an expanded conformation of αβ-tubulin, while post-GTP hydrolysis states are associated with the compaction of tubulin dimers within the microtubule lattice. The nucleotide state of tubulin is known to influence interactions with binding partners such as EBs, leading to their enrichment on actively growing microtubules [27, 28, 45]. We found that the SVP motor KIF1A binds more weakly to GTP-like than GDP-like lattices. This binding selectivity is inhibited by the T258M mutation, predicted to both disrupt the conformation and neutralize the positive electrostatic charge of KIF1A Loop 11 [40]. A low binding affinity for GTP lattices facilitates KIF1A detachment from microtubule plus-ends, which are enriched at en passant synapses.
Selective lattice binding by KIF1A is important for efficient SVP delivery, and critical for the regulation of presynaptic strength in hippocampal neurons. While KIF1A is not directly affected by the tubulin tyrosination state, KIF1A binding is affected by EB proteins. Both the intrinsic low affinity of KIF1A for the GTP lattice, along with competition for binding to the plus-end with +TIP complexes, may act synergistically to promote KIF1A detachment from the microtubule at presynapses. KIF1A carrying synaptotagmin-IV (syt-IV) cargo has been observed to move on microtubules transiently invading dendritic spines [46], suggesting that the weak binding of KIF1A to dynamic microtubules we report here may also have important implications for synapse homeostasis at the post-synaptic level. Underscoring the physiological significance of this mechanism, individuals carrying the KIF1A-T258M mutation display a complicated form of hereditary spastic paraplegia with mild to severe intellectual disability, thinning of the corpus callosum, and epilepsy [40].
A platform for efficiently matching supply to demand
The interplay between specific microtubule organization features and different molecular motors will have important implications for the delivery of synaptic cargo to presynapses. While SVP transport to presynapses is primarily mediated by KIF1A [5], other crucial presynaptic components, including the active zone proteins bassoon and piccolo, are transported by KIF5 motors [47]. While both KIF1A and KIF5 motors convey cargo to presynaptic sites, the relative efficiency of delivery by these two motors differs greatly. It is estimated that presynaptic boutons contain on average 7,000 to 22,000 individual copies of proteins delivered to the synapse by KIF1A, including Syp, VGLUT1, and synaptobrevin [1, 48]. In contrast, there are many fewer molecules of KIF5-cargos such as bassoon (~450) and piccolo (~75) per presynaptic bouton [1].
Given that the lifetime of multiple active zone and synaptic vesicle components are within the same order of magnitude [49], the demand for replenishing the much more numerous synaptic vesicle components is necessarily higher. Thus, we posit that efficient replenishment of synaptic vesicles relies on a platform through which SVP delivery is specifically targeted to presynapses, while the replenishment of less numerous active zone components may be successfully achieved without a specific targeting mechanism. In support of this, syntaxin-1 and SNAP-25, two plasma membrane proteins that mediate synaptic vesicle fusion and are carried in vesicles transported by KIF5 [50] are not enriched in active zones, but distributed throughout the plasma membrane [51].
Our measurements predict that the median retention probability of a SVP within 1 μm of a presynaptic site center point is 1.1 %. Using this value, we estimated the median spacing of presynaptic sites in whole-axon collaterals of cultured mature rat hippocampal neurons at ~4.6 μm, which is close to the average spacing of 4.3 μm reported for axons originating from various regions of the rat hippocampus [3]. Furthermore, our measurements allow the estimation of how long it takes for a presynaptic site to be fully replenished with new synaptic vesicles. We measured a median retention rate at steady state of 0.11 SVPs per synapse per minute, which predicts a supply of 6.6 SVPs per hour, or 198 SVPs each 30 hours per presynaptic site. This number is strikingly close to the average number of synaptic vesicles found in synaptic boutons of rat hippocampal neurons (195; [52]). Given recent studies estimating that the half-life of synaptic vesicles at presynaptic sites is below 30 hours [2], our results indicate that a typical synapse can be fully supplied with new synaptic vesicles approximately at the same rate that older synaptic vesicles are targeted for degradation.
Conclusion
Synaptic vesicles accumulate at presynaptic sites where they mediate synaptic transmission. Sustained delivery of SVPs to the presynapse is required to replenish synaptic vesicle pools and ensure reliable neurotransmission. Our study gives new insight into the mechanisms regulating this important step of the synaptic vesicle life cycle by showing that local microtubule dynamics and organization define an unloading zone for precise KIFIA-mediated SVP delivery at en passant synapses (Figure 7). It is becoming increasingly clear that microtubules can tune motor activity through their nucleotide state, post-translational modification profile, and association with other MAPs. Here, we show that microtubule dynamics and organization along the axon provide a spatial code that specifies presynaptic delivery of KIF1A-SVPs and controls presynaptic strength in hippocampal neurons.
Figure 7. Weak binding affinity to GTP-like microtubules facilitates KIF1A detachment from dynamic microtubule plus-ends and efficient local delivery of presynaptic cargo.
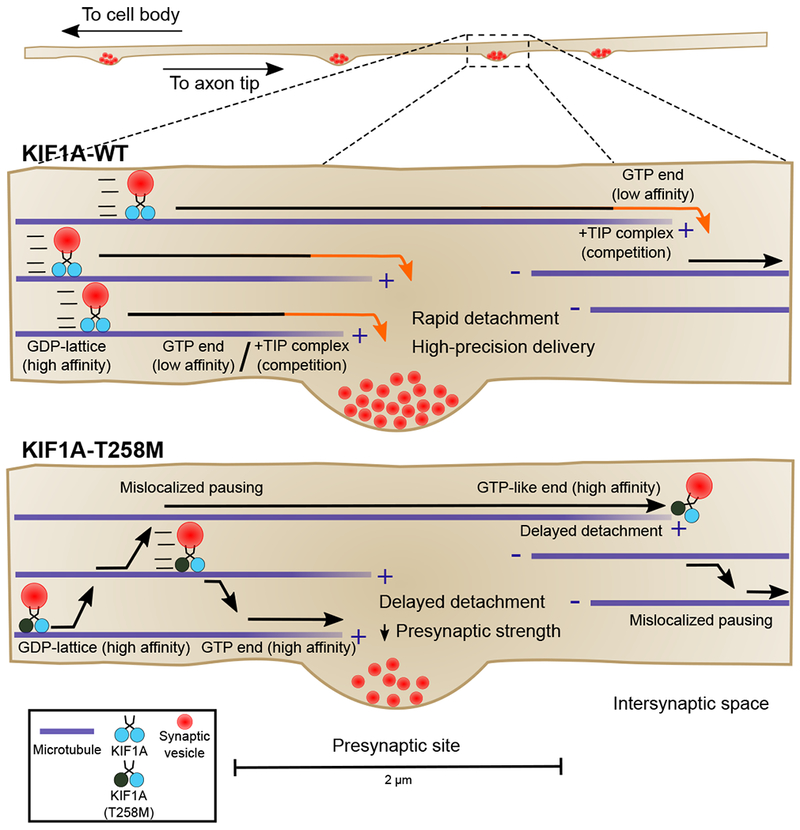
Model for local delivery of SVPs at en passant synapses.
STAR Methods
CONTACT FOR REAGENT AND RESOURCE SHARING
Further information and requests for resources and reagents should be directed to and will be fulfilled by the Lead Contact, Erika Holzbaur (holzbaur@pennmedicine.upenn.edu).
EXPERIMENTAL MODEL AND SUBJECT DETAILS
Dissociated Hippocampal Neuronal Culture
Embryonic day 18 rat hippocampal neurons were obtained from the Neuron Culture Service Center at the University of Pennsylvania and plated at a density of 333 neurons per mm2 on poly-L-lysine-coated (GIBCO) 35 mm glass-bottom dishes (P35G-1.5-20-C; MatTek) in MEM (GIBCO) supplemented with 10% horse serum (GIBCO), 38.5 mM D-glucose (Sigma) and 1 mM sodium pyruvate (GIBCO). The attachment medium was replaced after 5 hours with 2 mL Neurobasal (GIBCO) supplemented with 2% B-27 (GIBCO), 58 mM glucose (Sigma), 2 mM GlutaMAX (GIBCO), 100 U/mL penicillin and 100 μg/mL streptomycin (Sigma). Neurons were maintained in this medium at 37°C in a humidified 5% CO2 incubator until imaged. Cytosine β-D-arabinofuranoside (AraC; Sigma) 1 μM was added at day in vitro (DIV) 2 to prevent proliferation of glial cells and 30% of the medium was replaced with fresh maintenance medium on DIV3 and DIV7.
METHOD DETAILS
Plasmids
Constructs include pC1-mScarlet (Addgene #85042; pC1-mScarlet-Syp, pC1-EGFP-Syp, pN1-LAMP1-RFP (Addgene #1817), pN1-NPY-mCherry (Addgene #67156), EGFP-VGLUT1 and VGLUT1-pHluorin (gifts from Dr. Robert Edwards, UCSF, USA), pC1-mScarlet-VGLUT1, pN1-EB3-mCherry and pN1-EB3-EGFP (gifts from Dr. Anna Akhmanova, Utrecht University, The Netherlands), pN1-EB3-mScarlet, GW1-KIF1A-GFP (gift from Dr. Michael A. Silverman, Simon Fraser University, Canada), GW1-KIF1A-T258M-GFP, which was made from the WT construct by site-directed mutagenesis using QuikChange II (Agilent Technologies), GW1-KIF1A-EBFP2, GW1-KIF1A-T258M-EBF2. pHTC-KIF5B(1-560)-HaloTag (original KIF5B(1-560) construct was a gift from Dr. Ron Vale, UCSF, USA), pN1-KIF5C(1-560)-HaloTag (original KIF5C(1-560) construct was a gift from Dr. Yoshiyuki Konishi, Hamamatsu University, Japan), pN1-KIF1A(1-393)-GCN4-HaloTag (subcloned from Addgene #61665; EF Hand linker was absent in the final construct), all KIF1A mutants were made from this plasmid by site-directed mutagenesis using QuikChange II (Agilent Technologies) – R13H; S58L; T99M; G102D; V144F: E148D; R167C: A202P; S215R; R216P; L249Q; E253K; R254W; R254Q; A255V; T258M; R316W; R350G. Compared to the curated versions on Pubmed (NM_001244008.1/ NP_001230937.1), the Addgene #61665 construct has an allele variant that results in the substitution of Serine by Asparagine in residue 33. This is a Neutral/Tolerated/Benign modification according to Provean, SIFT and PolyPhen-2, respectively. We tested both variants and they display similar binding and motility behaviors on microtubules. All constructs were verified by DNA sequencing.
Transfection of Hippocampal Neurons
Hippocampal neurons were transfected on DIV7 using the DNA-calcium phosphate coprecipitation method. For each complexation reaction, 0.5 μg of each plasmid was mixed with 250 mM CaCl2 in Tris-EDTA buffer and then transferred to the same volume of 2× Hank’s buffered salt solution (274 mM NaCl, 10 mM KCl, 1.4 mM Na2HPO4.7H2O, 15 mM D-Glucose, 42 mM HEPES, pH 7.11) and thoroughly homogenized. After 8 minutes, 1.5 mL maintenance medium was removed from the imaging dish and reserved at 37°C, and the complexation reaction volume was added dropwise onto the neurons. The imaging dishes were placed in the 37°C, 5% CO2 incubator for 12 minutes, after which neurons were washed twice with equilibrated Neurobasal, the conditioned maintenance medium was restored and 750 μL fresh maintenance medium was added.
Live Imaging of Hippocampal Neurons
Neurons were imaged between 14-17 DIV, a time point when these are synaptically connected and fire spontaneously [2]. Imaging of live neurons was performed in Tyrode’s buffer (119 mM NaCl, 2.5 mM KCl, 2 mM CaCl2, 2 mM MgCl2, 25 mM HEPES, 30 mM D-glucose, buffered to pH 7.4 at 37°C), using a PerkinElmer UltraVIEW VOX Spinning Disk Confocal with a Nikon Eclipse Ti Inverted Microscope in an environmental chamber at 37°C. This system is equipped with a Plan Apochromat Lambda 60× 1.40 NA and an Apochromat 100× 1.49 NA oil-immersion objectives, and a PhotoKinesis accessory for photobleaching. Solid-state 405, 488, and 561 nm lasers (PerkinElmer) were used for excitation. Images were acquired with a Hamamatsu EMCCD C9100-50 camera using Volocity software (PerkinElmer).
For imaging the dynamics of SVPs, lysosomes or DCVs, neurons were cotransfected with either N-EGFP + mScarlet-Syp, N-EGFP + mScarlet-VGLUT1, EGFP-VGLUT1 + LAMP-1-RFP, or EGFP-VGLUT1 + NPY-mCherry, and the 100x objective was used (effective pixel size of 71.5 nm). Axons were easily distinguishable from dendrites and identified according to established morphological criteria. To better assess the effect of presynaptic regions on vesicle and microtubule dynamics, axonal sections with sparse presynaptic sites were selected (presynapse density is stated on the legend of relevant figures). Presynaptic sites were identified as bright immobile clusters of either mScarlet-Syp, mScarlet-VGLUT1, or EGFP-VGLUT1 along the axons and low-exposure stills of the axonal section of interest were taken. Time lapses of the vesicle channel were then recorded at 4 frames per second over 600 seconds. To aid the visualization and tracking of the vesicles coming into the axonal section, the whole section was photobleached with the 561 nm laser at full power 10 seconds after the time lapse started. Recording continued for 590 seconds after photobleaching was completed.
For imaging EB3 dynamics, neurons were co-transfected with either EGFP-VGLUT1-EGFP or EGFP-Syp + EB3-mScarlet, and the 60× objective was used (effective pixel size of 129.4 nm). Time lapses of the EB3 channel were recorded at 1 frame each 2 seconds over 600 seconds. Stills of the presynaptic marker channel were acquired before starting the time lapse.
To test the effect of KIF1A-T258M expression on SVP dynamics, neurons were co-transfected with either full-length KIF1A-WT-GFP + mScarlet-Syp or full-length KIF1A-T258M-GFP + mScarlet-Syp, and imaged as described above with the 100× objective. Axonal sections were photobleached with the 488 nm laser, as this laser line bleached both the GFP and mScarlet signals.
To test the effect of KIF1A-T258M expression on synaptic vesicle release, neurons were co-transfected with either full-length KIF1A-WT-EBFP2 + VGLUT1-pHluorin or full-length KIF1A-T258M-EBFP2 + VGLUT1-pHluorin. Imaging of live neurons was performed in Tyrode’s buffer containing 119 mM NaCl, 2.5 mM KCl, 2 mM CaCl2, 2 mM MgCl2, 25 mM HEPES, 30 mM D-glucose, 10 μM 2,3-dioxo-6-nitro-1,2,3,4-tetrahydrobenzo[f]quinoxaline-7-sulfonamide (NBQX; Tocris), and 50 mM D-(−)-2-amino-5-phosphonopentanoic (D-AP5 or APV; Tocris) buffered to pH 7.4 at 37°C. Using the 60x objective we selected fields where EBFP2-positive axons could be clearly observed. Stills of the EBFP2 and pHluorin channels were acquired, followed by a 180 seconds time lapse of the pHluorin channel recorded at one frame each 2 seconds. Action potentials (AP) were evoked by passing 1 msec bipolar current through platinum-iridium electrodes immersed into the imaging buffer at 10 Hz using a DS8000 digital stimulator (World Precision Instruments) and DLS100 stimulus isolator (World Precision Instruments). Tyrode’s buffer with 50 mM NH4Cl was introduced at the end of the recording to assess maximum pHluorin signal. Acquisition settings were maintained identical across all experiments and conditions.
Immunofluorescence
Rat primary hippocampal neurons on 25 mm round glass coverslips were fixed at 19 DIV after 30 minutes treatment with either 0.1% DMSO or 100 nM nocodazole in phosphate-buffered saline (PBS) containing 4% paraformaldehyde and 4% sucrose for 5 minutes. Coverslips were washed three times in PBS and blocked/permeabilized with PBS containing 5% normal goat serum, 1% bovine serum albumin (BSA) and 0.1% Triton X-100. The primary antibodies mouse anti-tubulin-GTP (MB11, Adipogen; [35]), guinea pig anti-synapsin I/II (55 004, Synaptic Systems), and chicken anti-α-tubulin (ab89984, Abcam) were diluted in antibody dilution (Abdil) solution (1% BSA and 0.1% Triton X-100 in PBS) and used at 5 μg/mL, 1:500, and 1 μg/mL, respectively. Neurons were first incubated with anti-tubulin-GTP for 30 minutes, followed by anti-tubulin-GTP, anti-synapsin, and anti-α-tubulin for 1 hour at room temperature. After removing the primary antibodies and washing three times with PBS, the coverslips were incubated with fluorophore-conjugated secondary antibodies (4 μg/mL anti-mouse Alexa Fluor 555, anti-guinea pig Alexa Fluor 488, and anti-chicken Alexa Fluor 633; ThermoFisher Scientific) diluted in Abdil for 45 minutes at room temperature. Following three washes with PBS, the coverslips were mounted on glass slides in ProLong Gold antifade mountant (ThermoFisher Scientific) and sealed with nail polish.
STED microscopy of fixed neurons
Imaging of immunostained neurons was performed on a Leica DMI 6000 microscope equipped with 592 nm and 660 nm STED depletion lasers using a 100× 1.4 NA oil-immersion objective. STED z-stacks images were acquired using the Leica Application Suite X and deconvolved using Huygens Professional software (Scientific Volume Imaging) with the Classical Maximum Likelihood Estimation (CMLE) algorithm.
TIRF microscopy
Imaging was performed with a Nikon Eclipse Ti Inverted Microscope equipped with an Apochromate TIRF-capable 100× 1.49 NA oil-immersion objective (Nikon) and solid-state 488, 561 and 640 nm laser lines (PerkinElmer). Single band-pass filters were used to filter the excitation and emission paths. Signals were collected using a Hamamatsu EMCCD C9100-13 camera and Volocity software (PerkinElmer).
Microtubule preparation
Unlabeled soluble alpha/beta tubulin heterodimers were purified from bovine brain through two cycles of polymerization/depolymerization [37] and stored at −80°C in BRB80 (80 mM PIPES, 1 mM MgCl2, 1 mM EGTA, pH 6.8 w/ KOH). GDP-taxol-stabilized microtubules were prepared by incubating unlabeled soluble tubulin with 5% HyLite-647-labeled tubulin (Cytoskeleton) in BRB80 + 1 mM Mg-GTP (Sigma) and 30 μM taxol (paclitaxel; Cytoskeleton) for 30 minutes at 37°C. Microtubules were pelleted through a 40% glycerol cushion at 352,000 × g for 5 minutes at 25°C, and resuspended in BRB80 with 20 μM taxol. Double-cycled GMPCPP-stabilized microtubules were prepared as previously described [37]. In brief, unlabeled tubulin was mixed with 5% HyLite-488-labeled tubulin (Cytoskeleton) and incubated in BRB80 with 1 mM GMPCPP (Jena) for 30 minutes at 37°C. Microtubules were pelleted at 352,000 × g, resuspended in BRB80 and left on ice to depolymerize. Tubulin was again incubated with 1 mM GMPCPP and left polymerizing at 37°C for 30 minutes. Microtubules were pelleted and resuspended in BRB80. GMPCPP-microtubule seeds for assays with dynamic microtubules were prepared as above but with 5% biotinylated (Cytoskeleton) and 5% HyLite-647-labeled tubulin (Cytoskeleton). Seeds were created by shearing diluted microtubules in BRB80 through a 27 ¼ G syringe. Tubulin polymer concentrations were determined by reading the absorbance at 280 nm wavelength on a Synergy MX plate reader (BioTek) and using an extinction coefficient of 115,000 M−1cm−1.
Fully tyrosinated and detyrosinated microtubules were prepared according to Nirschl et al. [37].
COS-7 Cell Culture and Lysate Preparation for Single-molecule TIRF Assays
COS-7 cells (CRL-1651; ATCC) were passaged on 143 cm2 tissue culture dishes (Olympus Plastics) in DMEM supplemented with 10% fetal bovine serum and 2 mM GlutaMAX (GIBCO) and kept at 37°C in a humidified 5% CO2 incubator. At ~60% confluency, COS-7 cells were transfected with 15 μg of HaloTag kinesin construct or EB3-EGFP using FuGENE 6 transfection reagent (Promega) according to the manufacturer instructions. Cells were kept in the incubator for ~22 hours expressing the construct. Cells expressing HaloTag fusion constructs were labeled with 5 μM Oregon Green-, 1 μM tetramethylrhodamine (TMR)-Halo ligand (Promega), or Janelia Fluor 646 (gift from Dr. Luke Lavis, HHMI Janelia Research Campus, USA) for 20 minutes, washed twice with equilibrated culture medium and left in the incubator for 20 minutes. Cells were then washed twice with ice-cold Ca2+- and Mg2+-free Dulbecco PBS (dPBS; GIBCO), lifted and transferred to a centrifuge tube. Cells were pelleted in 1 mL dPBS at 0.7-1.4 × g for 5 minutes. The supernatant was removed and the cell pellet lysed in 120 mM NaCl, 0.1% Triton X-100, 1 mM EDTA, 40 mM HEPES, pH 7.4, supplemented with a protease inhibitor cocktail (Pierce). The lysate was left on ice for 10 minutes and clarified at 17,000 × g for 10 minutes at 4°C. The resulting supernatant was then clarified at 352,000 × g for 15 minutes at 4°C. The relative concentration of Oregon Green-labeled motor was calculated by interpolating the fluorescence intensity value on a standard curve of Oregon Green at known concentrations obtained from a Cytation 5 Imaging Reader (BioTek) using 490 ± 10 nm excitation band and 516 ± 10 nm emission band. The relative concentration of TMR-labeled motor was calculated by interpolating the fluorescence intensity value on a standard curve of TMR at known concentrations obtained from a Cytation 5 Imaging Reader (BioTek) using 554 ± 5 nm excitation band and 580 ± 5 nm emission band. The relative concentration of EGFP-fused EB3 was determined by reading the absorbance at 488 nm wavelength on a Synergy MX plate reader (BioTek) and using an extinction coefficient of 56,000 M−1cm−1.
Protein purification
Recombinant KIF1A(1-393)-GCN4-HaloTag fused to a FLAG tag was expressed and purified from Sf9 insect cells using baculovirus following standard methods. Cells were lysed in Buffer A (10 mM Tris, 200 mM NaCl, 2 mM ATP, 4 mM MgCl2, 5 mM DTT, 1 mM EGTA, 0.5% Igepal, 1 mM β-mercaptoethanol, 0.01 mg/mL TAME, 0.01 mg/mL aprotinin 0.01 mg/mL leupeptin and 1 mM PMSF, pH 7.5). After clarification, proteins were captured using FLAG affinity chromatography (Anti-FLAG M2 Affinity Gel Resin, #A2220 Sigma and recovered in Buffer B (10 mM Tris, 200 mM NaCl, 1 mM EGTA, 1 mM DTT, 0.2 mg/mL FLAG peptide, 0.01 mg/mL TAME, 0.01 mg/mL aprotinin and 0.01 mg/mL leupeptin, pH 8.0). Protein fractions were clarified and incubated with TMR Halo ligand for 2 hours at 4°C. Labeled proteins were separated through NAP-10 and PD-10 columns (GE Healthcare) with Buffer B. Protein fractions were pooled and incubated with taxol-GDP-stabilized microtubules in the presence of 1 mM AMP-PNP (adenylylimidodiphosphate; Sigma), followed by centrifugation through a 20% sucrose cushion for 10 min at 25°C. Pellet was resuspended in Release Buffer (12 mM PIPES, 200 mM KCl, 5 mM MgCl2, 2 mM EGTA, 5 mM ATP) to separate motor from microtubules and centrifuged to pellet microtubules. Protein concentration in the supernatant was calculated with a BCA assay kit (ThermoFisher). EB1 was purified as described in [53].
Microtubule binding TIRF Assays
The relative microtubule binding efficiency of kinesins was determined via ensemble fluorescence intensity in TIRF microscopy using an approach similar to Nirschl et al. [37]. The steady-state fluorescence intensity of AMP-PNP kinesin bound to microtubules measures the ensemble binding properties at a given motor concentration and ionic strength, similar to a traditional AMP-PNP pull-down and Western blotting. However, one important benefit of TIRF microscopy is that we can simultaneously assess the binding efficiency of a motor to different populations of labeled microtubules in the same chamber.
Flow-chambers were prepared using silanized #1.5 glass coverslips (Warner) attached to glass slides (FisherScientific) using vacuum grease (Corning). To reduce non-specific binding, coverslips were cleaned through rounds of sonication in acetone, potassium hydroxide and ethanol, dried, plasma cleaned and silanized (PlusOne Repel-Silane; GE Healthcare). Flow-chambers were coated with monoclonal anti-β-tubulin antibody (T5201; Sigma) diluted 1:200 in BRB80, washed and incubated with 5% Pluronic F-127 (Sigma). After washing, 20 nM HyLite647-labeled GDP-taxol- and 20 nM HyLite488-labeled GMPCPP-stabilized microtubules were flowed in and left to attach to the coverslip for 5 minutes. Unbound microtubules were washed with Assay Buffer (BRB80, 0.3 mg/mL BSA, 0.3 mg/mL casein, 10 mM DTT, 20 μM taxol, 15 mg/mL D-glucose). TMR-HaloTag kinesin motor was diluted to 25 nM in Assay Buffer supplemented with 1 mM AMP-PNP (Adenylyl-imidodiphosphate; Sigma) and an oxygen scavenging system (0.5 mg/mL glucose oxidase, 470 U/mL catalase; Sigma). The final solution was flowed into the chamber and let incubate at room temperature for 20 minutes. Three-channel stills were taken across the chamber. Acquisition settings were maintained identical across all conditions.
Binding of KIF1A to fully tyrosinated and detyrosinated microtubules was performed as described above, but using 20 nM TRITC-labeled fully tyrosinated and 20 nM Alexa Fluor 647-labeled fully detyrosinated GMPCPP-stabilized microtubules, and 25 nM Oregon Green-labeled KIF1A(1–393)-GCN4-HaloTag.
TIRF Assays on Dynamic Microtubules
A soluble tubulin mix was prepared by combining unlabeled tubulin and 10% HyLite488-labeled tubulin to a final concentration of 50 μM. This mix was kept on ice at all times and clarified at 352,000 × g for 5 minutes at 4°C to pellet potential tubulin aggregates. Flow-chambers were prepared as described above but coated with monoclonal antibiotin (BN-34; Sigma) diluted 1:4 in BRB80 for 10 minutes. After washing with BRB80, the flow-chamber was blocked with 5% Pluronic F-127 and washed. 5 nM of biotinylated HyLite647-labeled GMPCPP-stabilized microtubule seeds in BRB80 were flowed in the chamber and were left attaching to the surface for 10 minutes. The flow chamber was then washed with Dynamic Assay Buffer (BRB80, 0.3 mg/mL BSA, 0.3 mg/mL casein, 10 mM DTT, 15 mg/mL glucose, 0.15% methylcellulose). A final solution with 1–2 nM TMR-labeled motor, 10 μM tubulin mix, 1 mM Mg-GTP, 1 mM Mg-ATP in Dynamic Assay Buffer supplemented with 2.5 mg/mL glucose oxidase, 2350 U/mL catalase was then flowed-in and let to equilibrate for approximately 5 minutes at 37°C before time lapse acquisition was initialized. The HyLite647-labeled GMPCPP-stabilized microtubule seeds channel was acquired at 1 frame each 60 seconds; the HyLite488-labeled tubulin mix channel was acquired at 1 frame each 10 seconds; the TMR-labeled HaloTag motor channel was acquired at approximately 7 frames per second. Time lapses were acquired for 600 seconds at 37°C.
Assays with dynamic microtubules KIF1A and EB1 were performed in a similar manner as described above but with an additional 50 mM KCl in the Dynamic Assay Buffer, 50 nM EB1-Rhodamine Red-X, and ~5 nM JF646-labeled KIF1A(1-393)-GCN4-HaloTag. The HyLite647-labeled GMPCPP-stabilized microtubule seeds and the JF646-labeled HaloTag KIF1A were acquired in the same channel at approximately 7 frames each seconds; the HyLite488-labeled tubulin mix channel was acquired at 1 frame each 5 seconds; the EB1-Rhodamine Red-X channel was acquired at 1 frame each 5 seconds. Assays were performed at 37°C.
QUANTIFICATION AND STATISTICAL ANALYSIS
Vesicle Motility Analysis
Axonal sections depicting presynaptic clusters were generated using the Straighten function in Fiji and synaptic peaks were manually determined. Kymographs were generated using the KymoClear macro toolset [54] and vesicle paths were manually tracked using a custom MATLAB GUI (Kymograph Suite). Velocity was calculated as the average instant velocities of a vesicle, without pausing times. Pauses were scored as instant velocity below 83 nm/sec between frames. Direction reversals were scored as a shift in the velocity signal between two frames or between the first frame after a pause and the frame immediately before the pause (in a kymograph, anterograde movement from left to right will have a positive instant velocity value, while retrograde movement will have a negative value). Vesicle directionality was calculated by dividing the “net run length” by the “run length”. Empirically, we found that the value ±1.75 worked as a good threshold to classify vesicles as moving robustly in one direction or bidirectionally. If positive and below 1.75, the vesicle would be scored as Anterograde; if negative and above −1.75, the vesicle would be scored as Negative; if above 1.75 or below −1.75, the vesicle would be scored as Bidirectional. The number of vesicles scored as Bidirectional was very low and these were not included in the data set presented in this work.
Vesicle flux was determined by quantifying the number of vesicles entering the photobleached section in the anterograde or retrograde direction over the entire duration of the video. This number was then normalized by time. Retention rate was determined by subtracting the number of vesicles that left the axonal section by the number of vesicles that entered the section in one given direction and normalize it by the length of the section and time. Partition of synaptic regions was performed by classifying 10 μm-wide non-overlapping areas centered on a presynaptic site. Non-synaptic regions were classified as non-overlapping 10 μm-wide areas at least 5 μm away from a presynaptic site. Vesicle retention in synaptic and non-synaptic regions was determined by subtracting the number of vesicles that left each 10 μm-wide section by the number of vesicles that entered the section in one given direction and normalize it by time.
The low-dose nocodazole treatment paradigm was based on Vasquez et al. [22]. An axonal section was selected and imaged for 600 seconds. 100 nM Nocodazole was then added to the imaging buffer and after 30 minutes of incubation, the exact same section was imaged. The duration of the treatment was determined by us to be the least amount of time required to achieve significant dampening of microtubule dynamics in neurons expressing EB3-mScarlet (see Figure S4D). The determination of this time point is important to minimize the influence of potential microtubule post-translational modifications that occur after microtubule stabilization in the analysis.
EB3 Dynamics Analysis
Axonal sections depicting presynaptic clusters were generated using the Straighten function in Fiji and synaptic peaks were manually determined. Kymographs were generated using the KymoClear macro toolset [54]. This toolset passes a Fourier-filter on the original kymograph, which enables the discrimination of anterograde-moving, retrograde-moving, and static components, generating a new kymograph for each. We found this tool ideal to visualize axonal EB3 comets, because not only these have a very consistent velocity and direction profile, but also the signal-to-noise ratio was notably improved. The EB3 kymographs depicted in Figure 2 and Figure S4 are (forward) Fourier-filtered kymographs. All other kymographs shown in this paper are non-Fourier-filtered. The location of EB3 comet initiation and termination events were manually identified using a custom MATLAB GUI (Kymograph Suite). Velocity, run-time and run-length of each EB3 comet were thus determined. The Fourier transformation has no influence on the quantitative analysis or interpretation of the data shown.
The average presynaptic length was determined by measuring the length of EGFP-VGLUT1 or EGFP-Syp clusters in our sample (average±SEM: 1.6±0.03 μm). Presynaptic coverage was determined by attributing a distance of 2 μm to each synapse (±1 μm from each presynaptic site centroid), multiplying 2 μm by the number of presynaptic sites and normalizing this by the total axonal length, per axon.
The EB3 initiation and termination density were calculated by normalizing the number of EB3 initiation and termination events occurring within ± 1 μm from presynaptic site centroids by the total presynaptic coverage per axon.
Monte Carlo test of spatial patterns along the axon
The locations of vesicle pausing or EB3 comet initiation or termination events and the synaptic regions in the kymograph were manually identified using a custom MATLAB GUI (Kymograph Suite). For each vesicle pause or EB3 comet initiation/termination event, we measured the distance to the nearest presynaptic peak or center to obtain the nearest presynaptic distance (NPD). The distribution of the NPDs depends on the number of vesicle pauses/EB3 comet initiation/termination events, length of the axonal section/kymograph, and the unique number and location of synaptic peaks along the kymograph. Thus, we compared our observed NPD to a Monte Carlo simulation specific for each kymograph using a custom MATLAB script, “nearestPresynapticDistance”.
This script measures the length of the kymograph (I), number of vesicle pauses or EB3 “comet” initiation/termination events (n), and location of the synaptic peaks (p). Next, it computes the NPD for each vesicle pause or EB3 comet initiation/termination event in the experimental data. Next, it simulates the null distribution for a given kymograph by drawing n positions, with replacement, along the kymograph from a random uniform distribution U(0,l] and measures the NPD between the n simulated pauses/events locations and the fixed synaptic peaks (p). The Monte Carlo simulation was repeated for 1,000 iterations for each kymograph to generate the expected distribution of NPDs given n pauses/events with a fixed kymograph length and synaptic profile.
VGLUTI-pHluorin assays: Quantification of synaptic vesicle release and pool size
Under the acidic conditions of the synaptic vesicle lumen, pHluorin fluorescence is quenched, but once the synaptic vesicle fuses with the plasma membrane and exposes its lumen to the slightly basic extracellular buffer, pHluorin dequenches. The fluorescence signal variation can then be quantified and synaptic vesicle exo/endocytosis measurements performed. Additionally, synaptic vesicle alkalinization through NH4Cl perfusion further allows the determination of the size of synaptic vesicles pools at presynaptic sites. Presynaptic release was quantified in presynapses that responded to the stimulation paradigm. A region of interest (ROI) was drawn around presynapses and the VGLUT1-pHluorin intensity plot profile was obtained. F0 was calculated as the average pHluorin intensity of a given presynaptic bouton over the first 20 seconds of recording. To quantify presynaptic release the pHluorin signal for each time point and presynapse was background subtracted to the respective F0, and the area under the curve (integrated intensity) between the start (60”) and the end (120”) of the stimulation paradigm was calculated. To quantify the Recycling synaptic vesicle pool the maximum fluorescence signal over the stimulation period detected at each presynaptic site was normalized to F0 and Fmax (Fmax was calculated as the intensity signal average over 20 seconds after addition of 50 mM NH4Cl for a given presynapse; F-F0 / Fmax-F0). The area of each ROI was determined as the Presynaptic area. The average of 20 seconds after NH4CL addition was determined for each presynapse as the Total synaptic vesicle pool size. The exocytosis rate was calculated for the first 14 seconds of stimulation (F74sec – F60sec) / (74 – 60), while the endocytosis rate was calculated for the 14 seconds after the stimulation paradigm was over (F134sec – F120sec) / (134 – 120).
Kinesin Motility on Dynamic Microtubules Analysis
Kymographs of the three channels were generated with the KymoClear macro toolset [54]. The plus-end of the dynamic microtubule and the kinesin motor runs were tracked using a custom MATLAB GUI. This allowed for the determination of motor run velocity, run-time, run-length, and the position of the run initiation and termination in relation to the microtubule plus-end at that specific time point. Detachment delay was defined as runs that terminated at the microtubule tip and the motor remained bound for more than 0.5 seconds (3 frames) before detaching.
Microtubule Binding Analysis
Microtubule segmentation
A pixel-level random decision forest classifier in ilastik was used to generate probability maps for the microtubule channel. The probability map was thresholded using the Otsu method and small isolated pixel regions were cleaned using morphological operators. Adjacent or touching microtubules in the same channel were separated using a marker-controlled Watershed transform. We ensured intensity measurements were specific to a given microtubule class by excluding objects that spatially overlapped between the two microtubule channels. Finally, we trained a linear support vector machine (SVM) to detect microtubules that were small, irregularly shaped, or otherwise deemed abnormal by an expert using a training dataset of 944 examples and 8 morphological features (Area, Major Axis Length, Minor Axis Length, Eccentricity, Solidity, Perimeter, Aspect Ratio, and Roundness). The SVM detected abnormal microtubules with a 95% accuracy on a held-out test set of 300 examples with a 96% Sensitivity, 93% Specificity, and a 95% Area Under the Curve of the Receiver Operator Curve.
Ensemble intensity measurement
The intensity of the kinesin image was linearly scaled from the full image bit depth to the range [0, 1] using a custom MATLAB script, “ensembleRecruitment”. A Gaussian filter was applied to reduce high-frequency noise and then a large, rolling-ball top hat filter was applied to subtract background and correct local intensity variations. We used the processed kinesin image to measure the average kinesin intensity within each microtubule mask. We also measured the background kinesin intensity, which was defined as all pixels at least 5 pixels away from any microtubule. The average background intensity level for each chamber was subtracted from the individual microtubule intensity measurements to obtain a background-subtracted intensity.
Statistical Analysis
Monte Carlo simulations and distribution fitting were performed in MATLAB R2017A or newer (MathWorks) and statistical tests were performed in GraphPad Prism7 (GraphPad Software). The assumption of normality was tested with D’Agostino-Pearson omnibus normality test. No sample size estimations were performed. Sample sizes and statistical tests applied for all experiments can be found in the corresponding figure legends. No specific strategy for randomization and/or stratification was employed. The studies were not blind in data analysis. No samples were excluded from analysis if not stated explicitly in the corresponding analysis section. The 95% confidence intervals (CI) were calculated from 1000 bootstrapped resamplings, except for the empirical Cumulative Distribution Function (eCDF), which was computed using Greenwood’s formula. Box and whisker plots show the median (bar), mean (plus sign) and interquartile range (IQR, blue box) with the whiskers extending to the 5 and 95 percentile values. Differences from control were considered statistically significant when p<0.05 and simultaneous biological or biophysical relevance was assumed only for differences larger than 10%.
DATA AND SOFTWARE AVAILABILITY
The custom MATLAB scripts used in this study to manually track kymographs (Kymograph Suite), determine nearest presynaptic distances and perform Monte Carlo simulations (nearestPresynapticDistance), and measure motor binding to microtubules (ensembleRecruitment) are available at https://github.com/jnirschl/kinesin-3_guedes-dias_2018.
Supplementary Material
Highlights.
-
-
Delivery of synaptic vesicle precursors occurs with high precision
-
-
Presynaptic sites are hotspots of dynamic GTP-rich microtubule plus-ends
-
-
KIF1A binds more weakly to the GTP lattice, rapidly detaching from plus-ends
-
-
A human KIF1A mutation perturbs lattice sensing and reduces synaptic strength
Acknowledgements
We acknowledge Erin Masucci for help with KIF1A purification, Jacob E. Lazarus for help with EB1 purification, Marc A. Dichter for kindly providing access to the digital stimulator and stimulus isolator, and Margie Maronski (University of Pennsylvania Neuron Culture Service Center), Andrea Stout (University of Pennsylvania Cell and Developmental Biology Microscopy Core), Halvor Juul (Mahoney Institute for Neurosciences Electrophysiology Service Center at the University of Pennsylvania), and William Pennie (University of Pennsylvania Research Instrumentation Shop) for technical assistance. We thank Andrew Moore and Benjamin Prosser for insightful discussion and support, and Chantell Evans and Mara Olenick for critical reading of the manuscript. This work was funded by NIH Grants R01GM048661 (to E.L.F.H.) and F30NS092227 (to J.J.N.). This study has received support under the program “Investissements d’Avenir” launched by the French Government and implemented by ANR with the references ANR-10-LBX-0038, ANR-10-IDEX-0001-02 PSL. The work of M.M. is supported by the Fondation pour la Recherche Medicale (FRM) grant DEQ20170336756 and the the Fondation Vaincre Alzheimer grant FR-16055p. P.G-D. was supported by the NSF Science and Technology Center for Engineering MechanoBiology (Grant CMMI-1548571).
Footnotes
Publisher's Disclaimer: This is a PDF file of an unedited manuscript that has been accepted for publication. As a service to our customers we are providing this early version of the manuscript. The manuscript will undergo copyediting, typesetting, and review of the resulting proof before it is published in its final citable form. Please note that during the production process errors may be discovered which could affect the content, and all legal disclaimers that apply to the journal pertain.
Author Contributions
The authors declare no competing interests.
References
- 1.Wilhelm BG, Mandad S, Truckenbrodt S, Krohnert K, Schafer C, Rammner B, Koo SJ, Classen GA, Krauss M, Haucke V, et al. (2014). Composition of isolated synaptic boutons reveals the amounts of vesicle trafficking proteins. Science 344, 1023–1028. [DOI] [PubMed] [Google Scholar]
- 2.Truckenbrodt S, Viplav A, Jahne S, Vogts A, Denker A, Wildhagen H, Fornasiero EF, and Rizzoli SO (2018). Newly produced synaptic vesicle proteins are preferentially used in synaptic transmission. The EMBO journal. [DOI] [PMC free article] [PubMed] [Google Scholar]
- 3.Shepherd GM, Raastad M, and Andersen P (2002). General and variable features of varicosity spacing along unmyelinated axons in the hippocampus and cerebellum. Proceedings of the National Academy of Sciences of the United States of America 99, 6340–6345. [DOI] [PMC free article] [PubMed] [Google Scholar]
- 4.Rizzoli SO (2014). Synaptic vesicle recycling: steps and principles. The EMBO journal 33, 788–822. [DOI] [PMC free article] [PubMed] [Google Scholar]
- 5.Okada Y, Yamazaki H, Sekine-Aizawa Y, and Hirokawa N (1995). The neuron-specific kinesin superfamily protein KIF1A is a unique monomeric motor for anterograde axonal transport of synaptic vesicle precursors. Cell 81, 769–780. [DOI] [PubMed] [Google Scholar]
- 6.Koushika SP, Schaefer AM, Vincent R, Willis JH, Bowerman B, and Nonet ML (2004). Mutations in Caenorhabditis elegans cytoplasmic dynein components reveal specificity of neuronal retrograde cargo. The Journal of neuroscience : the official journal of the Society for Neuroscience 24, 3907–3916. [DOI] [PMC free article] [PubMed] [Google Scholar]
- 7.Niwa S, Tanaka Y, and Hirokawa N (2008). KIF1Bbeta- and KIF1A-mediated axonal transport of presynaptic regulator Rab3 occurs in a GTP-dependent manner through DENN/MADD. Nature cell biology 10, 1269–1279. [DOI] [PubMed] [Google Scholar]
- 8.Wu GH, Muthaiyan Shanmugam M, Bhan P, Huang YH, and Wagner OI (2016). Identification and Characterization of LIN-2(CASK) as a Regulator of Kinesin-3 UNC-104(KIF1A) Motility and Clustering in Neurons. Traffic 17, 891–907. [DOI] [PubMed] [Google Scholar]
- 9.Niwa S, Tao L, Lu SY, Liew GM, Feng W, Nachury MV, and Shen K (2017). BORC Regulates the Axonal Transport of Synaptic Vesicle Precursors by Activating ARL-8. Current biology : CB 27, 2569–2578 e2564. [DOI] [PMC free article] [PubMed] [Google Scholar]
- 10.Chia PH, Li P, and Shen K (2013). Cell biology in neuroscience: cellular and molecular mechanisms underlying presynapse formation. The Journal of cell biology 203, 11–22. [DOI] [PMC free article] [PubMed] [Google Scholar]
- 11.Schneider-Mizell CM, Gerhard S, Longair M, Kazimiers T, Li F, Zwart MF, Champion A, Midgley FM, Fetter RD, Saalfeld S, et al. (2016). Quantitative neuroanatomy for connectomics in Drosophila. eLife 5. [DOI] [PMC free article] [PubMed] [Google Scholar]
- 12.Yu W, and Baas PW (1994). Changes in microtubule number and length during axon differentiation. The Journal of neuroscience : the official journal of the Society for Neuroscience 14, 2818–2829. [DOI] [PMC free article] [PubMed] [Google Scholar]
- 13.Stephan R, Goellner B, Moreno E, Frank CA, Hugenschmidt T, Genoud C, Aberle H, and Pielage J (2015). Hierarchical microtubule organization controls axon caliber and transport and determines synaptic structure and stability. Developmental cel 33, 5–21. [DOI] [PMC free article] [PubMed] [Google Scholar]
- 14.Yogev S, Cooper R, Fetter R, Horowitz M, and Shen K (2016). Microtubule Organization Determines Axonal Transport Dynamics. Neuron 92, 449–460. [DOI] [PMC free article] [PubMed] [Google Scholar]
- 15.Farias GG, Guardia CM, De Pace R, Britt DJ, and Bonifacino JS (2017). BORC/kinesin-1 ensemble drives polarized transport of lysosomes into the axon. Proceedings of the National Academy of Sciences of the United States of America 114, E2955–E2964. [DOI] [PMC free article] [PubMed] [Google Scholar]
- 16.Robinson BJ, Stanisavljevic B, Silverman MA, and Scalettar BA (2016). Stochastic Subcellular Organization of Dense-Core Vesicles Revealed by Point Pattern Analysis. Biophysical journal 111, 852–863. [DOI] [PMC free article] [PubMed] [Google Scholar]
- 17.Lo KY, Kuzmin A, Unger SM, Petersen JD, and Silverman MA (2011). KIF1A is the primary anterograde motor protein required for the axonal transport of dense-core vesicles in cultured hippocampal neurons. Neuroscience letters 491, 168–173. [DOI] [PubMed] [Google Scholar]
- 18.Gumy LF, Katrukha EA, Grigoriev I, Jaarsma D, Kapitein LC, Akhmanova A, and Hoogenraad CC (2017). MAP2 Defines a Pre-axonal Filtering Zone to Regulate KIF1- versus KIF5-Dependent Cargo Transport in Sensory Neurons. Neuron 94, 347–362 e347. [DOI] [PubMed] [Google Scholar]
- 19.Wong MY, Zhou C, Shakiryanova D, Lloyd TE, Deitcher DL, and Levitan ES (2012). Neuropeptide delivery to synapses by long-range vesicle circulation and sporadic capture. Cell 148, 1029–1038. [DOI] [PMC free article] [PubMed] [Google Scholar]
- 20.Cavolo SL, Bulgari D, Deitcher DL, and Levitan ES (2016). Activity Induces Fmr1 Sensitive Synaptic Capture of Anterograde Circulating Neuropeptide Vesicles. The Journal of neuroscience : the official journal of the Society for Neuroscience 36, 11781–11787. [DOI] [PMC free article] [PubMed] [Google Scholar]
- 21.Stepanova T, Slemmer J, Hoogenraad CC, Lansbergen G, Dortland B, De Zeeuw CI, Grosveld F, van Cappellen G, Akhmanova A, and Galjart N (2003). Visualization of microtubule growth in cultured neurons via the use of EB3-GFP (endbinding protein 3-green fluorescent protein). The Journal of neuroscience : the official journal of the Society for Neuroscience 23, 2655–2664. [DOI] [PMC free article] [PubMed] [Google Scholar]
- 22.Vasquez RJ, Howell B, Yvon AM, Wadsworth P, and Cassimeris L (1997). Nanomolar concentrations of nocodazole alter microtubule dynamic instability in vivo and in vitro. Molecular biology of the cell 8, 973–985. [DOI] [PMC free article] [PubMed] [Google Scholar]
- 23.Perlson E, Hendricks AG, Lazarus JE, Ben-Yaakov K, Gradus T, Tokito M, and Holzbaur EL (2013). Dynein interacts with the neural cell adhesion molecule (NCAM180) to tether dynamic microtubules and maintain synaptic density in cortical neurons. The Journal of biological chemistry 288, 27812–27824. [DOI] [PMC free article] [PubMed] [Google Scholar]
- 24.Tomishige M, Klopfenstein DR, and Vale RD (2002). Conversion of Unc104/KIF1A kinesin into a processive motor after dimerization. Science 297, 2263–2267. [DOI] [PubMed] [Google Scholar]
- 25.Soppina V, Norris SR, Dizaji AS, Kortus M, Veatch S, Peckham M, and Verhey KJ (2014). Dimerization of mammalian kinesin-3 motors results in superprocessive motion. Proceedings of the National Academy of Sciences of the United States of America 111, 5562–5567. [DOI] [PMC free article] [PubMed] [Google Scholar]
- 26.Seetapun D, Castle BT, McIntyre AJ, Tran PT, and Odde DJ (2012). Estimating the microtubule GTP cap size in vivo. Current biology : CB 22, 1681–1687. [DOI] [PMC free article] [PubMed] [Google Scholar]
- 27.Zanic M, Stear JH, Hyman AA, and Howard J (2009). EB1 recognizes the nucleotide state of tubulin in the microtubule lattice. PloS one 4, e7585. [DOI] [PMC free article] [PubMed] [Google Scholar]
- 28.Maurer SP, Bieling P, Cope J, Hoenger A, and Surrey T (2011). GTPgammaS microtubules mimic the growing microtubule end structure recognized by end-binding proteins (EBs). Proceedings of the National Academy of Sciences of the United States of America 108, 3988–3993. [DOI] [PMC free article] [PubMed] [Google Scholar]
- 29.Peris L, Thery M, Faure J, Saoudi Y, Lafanechere L, Chilton JK, Gordon-Weeks P, Galjart N, Bornens M, Wordeman L, et al. (2006). Tubulin tyrosination is a major factor affecting the recruitment of CAP-Gly proteins at microtubule plus ends. The Journal of cell biology 174, 839–849. [DOI] [PMC free article] [PubMed] [Google Scholar]
- 30.Cai D, McEwen DP, Martens JR, Meyhofer E, and Verhey KJ (2009). Single molecule imaging reveals differences in microtubule track selection between Kinesin motors. PLoS biology 7, e1000216. [DOI] [PMC free article] [PubMed] [Google Scholar]
- 31.Norris SR, Soppina V, Dizaji AS, Schimert KI, Sept D, Cai D, Sivaramakrishnan S, and Verhey KJ (2014). A method for multiprotein assembly in cells reveals independent action of kinesins in complex. The Journal of cell biology 207, 393–406. [DOI] [PMC free article] [PubMed] [Google Scholar]
- 32.Gramlich MW, Conway L, Liang WH, Labastide JA, King SJ, Xu J, and Ross JL (2017). Single Molecule Investigation of Kinesin-1 Motility Using Engineered Microtubule Defects. Scientific reports 7, 44290. [DOI] [PMC free article] [PubMed] [Google Scholar]
- 33.Yajima H, Ogura T, Nitta R, Okada Y, Sato C, and Hirokawa N (2012). Conformational changes in tubulin in GMPCPP and GDP-taxol microtubules observed by cryoelectron microscopy. The Journal of cell biology 198, 315–322. [DOI] [PMC free article] [PubMed] [Google Scholar]
- 34.Alushin GM, Lander GC, Kellogg EH, Zhang R, Baker D, and Nogales E (2014). High-resolution microtubule structures reveal the structural transitions in alphabetα-tubulin upon GTP hydrolysis. Cell 157, 1117–1129. [DOI] [PMC free article] [PubMed] [Google Scholar]
- 35.Nakata T, Niwa S, Okada Y, Perez F, and Hirokawa N (2011). Preferential binding of a kinesin-1 motor to GTP-tubulin-rich microtubules underlies polarized vesicle transport. The Journal of cell biology 194, 245–255. [DOI] [PMC free article] [PubMed] [Google Scholar]
- 36.Li Q, King SJ, and Xu J (2017). Native kinesin-1 does not bind preferentially to GTP-tubulin-rich microtubules in vitro. Cytoskeleton 74, 356–366. [DOI] [PMC free article] [PubMed] [Google Scholar]
- 37.Nirschl JJ, Magiera MM, Lazarus JE, Janke C, and Holzbaur EL (2016). alpha-Tubulin Tyrosination and CLIP-170 Phosphorylation Regulate the Initiation of Dynein-Driven Transport in Neurons. Cell reports 14, 2637–2652. [DOI] [PMC free article] [PubMed] [Google Scholar]
- 38.Guardia CM, Farias GG, Jia R, Pu J, and Bonifacino JS (2016). BORC Functions Upstream of Kinesins 1 and 3 to Coordinate Regional Movement of Lysosomes along Different Microtubule Tracks. Cell reports 17, 1950–1961. [DOI] [PMC free article] [PubMed] [Google Scholar]
- 39.Lipka J, Kapitein LC, Jaworski J, and Hoogenraad CC (2016). Microtubule-binding protein doublecortin-like kinase 1 (DCLK1) guides kinesin-3-mediated cargo transport to dendrites. The EMBO journal 35, 302–318. [DOI] [PMC free article] [PubMed] [Google Scholar]
- 40.Cheon CK, Lim SH, Kim YM, Kim D, Lee NY, Yoon TS, Kim NS, Kim E, and Lee JR (2017). Autosomal dominant transmission of complicated hereditary spastic paraplegia due to a dominant negative mutation of KIF1A, SPG30 gene. Scientific reports 7, 12527. [DOI] [PMC free article] [PubMed] [Google Scholar]
- 41.Niwa S, Lipton DM, Morikawa M, Zhao C, Hirokawa N, Lu H, and Shen K (2016). Autoinhibition of a Neuronal Kinesin UNC-104/KIF1A Regulates the Size and Density of Synapses. Cell reports 16, 2129–2141. [DOI] [PMC free article] [PubMed] [Google Scholar]
- 42.Wu YE, Huo L, Maeder CI, Feng W, and Shen K (2013). The balance between capture and dissociation of presynaptic proteins controls the spatial distribution of synapses. Neuron 78, 994–1011. [DOI] [PMC free article] [PubMed] [Google Scholar]
- 43.Yogev S, Maeder CI, Cooper R, Horowitz M, Hendricks AG, and Shen K (2017). Local inhibition of microtubule dynamics by dynein is required for neuronal cargo distribution. Nature communications 8, 15063. [DOI] [PMC free article] [PubMed] [Google Scholar]
- 44.Zhang R, Alushin GM, Brown A, and Nogales E (2015). Mechanistic Origin of Microtubule Dynamic Instability and Its Modulation by EB Proteins. Cell 162, 849–859. [DOI] [PMC free article] [PubMed] [Google Scholar]
- 45.Maurer SP, Fourniol FJ, Bohner G, Moores CA, and Surrey T (2012). EBs recognize a nucleotide-dependent structural cap at growing microtubule ends. Cell 149, 371–382. [DOI] [PMC free article] [PubMed] [Google Scholar]
- 46.McVicker DP, Awe AM, Richters KE, Wilson RL, Cowdrey DA, Hu X, Chapman ER, and Dent EW (2016). Transport of a kinesin-cargo pair along microtubules into dendritic spines undergoing synaptic plasticity. Nature communications 7, 12741. [DOI] [PMC free article] [PubMed] [Google Scholar]
- 47.Yagensky O, Kalantary Dehaghi T, and Chua JJ (2016). The Roles of Microtubule-Based Transport at Presynaptic Nerve Terminals. Frontiers in synaptic neuroscience 8, 3. [DOI] [PMC free article] [PubMed] [Google Scholar]
- 48.Takamori S, Holt M, Stenius K, Lemke EA, Gronborg M, Riedel D, Urlaub H, Schenck S, Brugger B, Ringler P, et al. (2006). Molecular anatomy of a trafficking organelle. Cell 127, 831–846. [DOI] [PubMed] [Google Scholar]
- 49.Cohen LD, Zuchman R, Sorokina O, Muller A, Dieterich DC, Armstrong JD, Ziv T, and Ziv NE (2013). Metabolic turnover of synaptic proteins: kinetics, interdependencies and implications for synaptic maintenance. PloS one 8, e63191. [DOI] [PMC free article] [PubMed] [Google Scholar]
- 50.Su Q, Cai Q, Gerwin C, Smith CL, and Sheng ZH (2004). Syntabulin is a microtubule-associated protein implicated in syntaxin transport in neurons. Nature cell biology 6, 941–953. [DOI] [PubMed] [Google Scholar]
- 51.Sudhof TC (2012). The presynaptic active zone. Neuron 75, 11–25. [DOI] [PMC free article] [PubMed] [Google Scholar]
- 52.Schikorski T, and Stevens CF (1997). Quantitative ultrastructural analysis of hippocampal excitatory synapses. The Journal of neuroscience : the official journal of the Society for Neuroscience 17, 5858–5867. [DOI] [PMC free article] [PubMed] [Google Scholar]
- 53.Dixit R, Barnett B, Lazarus JE, Tokito M, Goldman YE, and Holzbaur EL (2009). Microtubule plus-end tracking by CLIP-170 requires EB1. Proceedings of the National Academy of Sciences of the United States of America 106, 492–497. [DOI] [PMC free article] [PubMed] [Google Scholar]
- 54.Mangeol P, Prevo B, and Peterman EJ (2016). KymographClear and KymographDirect: two tools for the automated quantitative analysis of molecular and cellular dynamics using kymographs. Molecular biology of the cell 27, 1948–1957. [DOI] [PMC free article] [PubMed] [Google Scholar]
Associated Data
This section collects any data citations, data availability statements, or supplementary materials included in this article.
Supplementary Materials
Data Availability Statement
The custom MATLAB scripts used in this study to manually track kymographs (Kymograph Suite), determine nearest presynaptic distances and perform Monte Carlo simulations (nearestPresynapticDistance), and measure motor binding to microtubules (ensembleRecruitment) are available at https://github.com/jnirschl/kinesin-3_guedes-dias_2018.