

Abstract
Phosphatidylinositol (PI) lipids control critical biological processes and thus aberrant biosynthesis often leads to disease. As a result, the ability to track the production and localization of these molecules in cells is vital for elucidating their complex roles. Herein, we report the design, synthesis and application of clickable myo-inositol probe 1a for bioorthogonal labeling of PI products. To validate this platform, we initially conducted PI synthase assays to show that 1a inhibits PI production in vitro. Fluorescence microscopy experiments next showed probe-dependent imaging in T-24 human bladder cancer and C. albicans cells. Growth studies in the latter showed that replacement of myo-inositol with probe 1a led to an enhancement in cell growth. Finally, fluorescence-based TLC analysis and mass spectrometry experiments support the labeling of PI lipids. This approach provides a promising means for tracking the complex biosynthesis and trafficking of these lipids in cells.
Keywords: Phospholipids, Lipids, Click Chemistry, Metabolic Labeling, Fluorescent Probes
Graphical Abstract
A clickable myo-inositol probe has been developed for the labeling of phosphatidylinositol (PI) lipids in live cells. Validation of labeling was accomplished through PI synthase inhibition assays, cellular fluorescence microscopy, TLC imaging and mass spectrometry. Probe effects of cell growth and transport were also investigated. This platform provides an exciting avenue for tracking the biosynthesis and trafficking of PI lipids, which are commonly dysregulated in disease.
Introduction
Natural products containing myo-inositol units including phosphatidylinositol (PI) and phosphatidylinositol polyphosphate (PIPn) lipids as well as soluble inositol phosphates (InsPs) are critical biomolecules that regulate many of the most important biological processes and pathways.[1] myo-Inositol and its various metabolites act via signaling and secondary messenger roles that control processes such as cell growth,[2] inflammation/immune response,[3] insulin response and glucose metabolism,[4] intracellular calcium release,[2, 5] cytoskeleton assembly,[6] and neurological/brain function.[7] Abnormalities in inositol metabolite production therefore result in various diseases including diabetes, renal disorders, and cancer.[8] The abundance and localization of these signaling lipids is tightly controlled due to their key roles in cellular signal transduction. Thus, the ability to accurately detect and image these lipids in cells would be invaluable for understanding biological roles and for diagnostic applications. However, this endeavor is challenging since lipid biosynthesis involves the interconversion of numerous lipid products within the complex environments of cellular membranes.
Prior work has demonstrated that metabolic labeling using substrate analogs bearing diminutive click chemistry tags is an excellent tool for the labeling and imaging of important biomolecules in their native settings through bioorthogonal post-derivatization after probes hijack biosynthetic pathways.[9] Bioengineering is a robust method to probe important cellular processes, both spatially and temporally, that has been applied to better understand disease states, validate pathways and signaling cascades, and develop novel therapeutics. Bertozzi and Saxon pioneered this approach for carbohydrate labeling by developing N-azidomannosamine (ManNAz) for labeling sialic acid residues presented on cell surface glycoproteins.[10] Regarding lipids, Salic and co-workers developed propargylcholine for labeling phosphatidylcholine (PC) lipids,[11] and Baskin and co-workers reported the labeling of phosphatidic acid (PA) products of phospholipase D using clickable alcohols.[12] Specifically for inositol-containing lipids, Guo and coworkers developed azido-inositol probes to be bioengineered into glycosylphosphatidylinositols (GPIs) for detecting GPI anchored proteins.[13] In that work, inositol analogs bearing azide tags at the 3-, 4-, and 5-positions were explored since these positions are not connected in GPI anchors. Lear, Wenk and coworkers have also reported azido-inositols modified at positions 2–5.[14] These previous reports show the robust, efficient labelling afforded by click chemistry. In this manuscript we advance this methodology for the labeling of PI lipids.
Results and Discussion
Herein, we report the development and application of a clickable myo-inositol substrate analog for the labeling of PI lipid products in cells. In doing so, we designed, synthesized and studied inositol probes of type 1 containing an azide tag linked via a propyl ether at the 2-position. The 2-position was specifically chosen to avoid the 1, 3, 4, and 5 positions at which phosphatidylinositol polyphosphates (PIPns) are modified in nature and since modifications at this position have been reported to be tolerated by receptors that bind soluble inositols.[15] An ether linkage was selected since this retains the natural oxygen at the 2-position of inositol needed to participate in potential hydrogen bonding interactions. Both pentaol probe 1a and peracetylated version 1b were targeted, in the latter case since acetylation can enhance membrane permeability, after which the acetyl groups may be hydrolyzed by intracellular esterase enzymes.[16]
Probe synthesis began with myo-inositol (2) through protection of the 1-, 3-, and 5-hydroxyl groups as an orthoformate as described by Kishi and co-workers.[17] A later modification of this synthesis was also used to achieve selective dibenzylation of the 4- and 6-hydroxyls using lithium hydride as base to produce 3.[18] Next, a Williamson ether synthesis was exploited to introduce the propylazide group of 4 through reaction with azidopropyltriflate. This was synthesized from 3-bromo-1-propanol through displacement of the bromide with sodium azide and then conversion of the remaining alcohol to the corresponding triflate.[19] With the azide tag installed, orthoformate deprotection under acidic conditions yielded 5.[20] We next acylated the three hydroxyl groups formed in the prior step, resulting in 6, to facilitate purification and control solubility for subsequent reactions. The following benzyl deprotection was limited in terms of potential conditions by the presence of the azide, and was performed using an oxidative debenzylation[21] to generate 7. Finally, acyl hydrolysis produced pentaol probe 1a, whereas further acylation of the two hydroxyl groups of 7 generated peracetylated probe 1b.
With probes 1a-b in hand, our first step in studying their incorporation into lipid biosynthetic pathways was to analyze the effect of these probes on the activity of the enzyme phosphatidylinositol synthase (Pis1p). For this purpose, we exploited an assay for PI synthase in which crude, enriched endoplasmic reticulum (ER) membrane preparations from Candida albicans cells were treated with its two substrates, tritiated myo-inositol (0.5 mM) and cytidyldiphosphatediacylglycerol (CDP-DAG). The tritium-labeled PI product was detected by scintillation counting. This assay was developed by modifying a previously reported PS synthase assay.[22] Results from this assay showed that the production of PI decreased somewhat in the presence of 10 mM of 1a (Figure 1A), and to a much greater extent in the presence of 25 mM 1a (Figure 1B). In comparison, peracetylated derivative 1b did not show any effect, as expected since this compound would require acyl hydrolysis by esterases, and this assay was performed using extracts (data not shown). These results indicate that probe 1a inhibits the conversion of natural myo-inositol to PI. A plausible explanation for this result is that probe 1a is competitive as a PI synthase substrate, which diminishes the amount of radiolabeled PI produced in the assay. Probe 1a is not a particularly effective inhibitor/competitor since concentrations well above the natural substrate were required for inhibition. However, this is often the case when natural metabolites are chemically modified with additional tags, and the labeling of a large percentage of the naturally occurring product pool is not necessarily required for success in biorthogonal imaging applications.
Figure 1.

Results from PI synthase assay indicate that probe 1a causes dose-dependent decreases in radiolabeled PI with a minor decrease at 10 mM treatment (A) and greater inhibition at 25 mM (B). Error bars represent standard deviation between triplicate trials. The negative control contained no membrane extract.
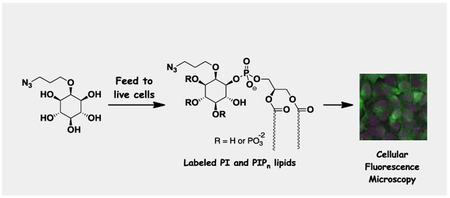
Following this evidence of PI synthase perturbation, we next sought to study the ability to image cells labeling with probe 1a. The overarching strategy behind this approach is shown in Scheme 2. Here, probes were fed to cells to infiltrate natural biosynthetic machinery and produce labeled versions of inositol-containing products. This labeling strategy enables multiple methods for detecting derivatized products, including post-derivatization with either copper-free or copper-catalyzed clickable fluorescent reagents such as Cy3-DIBO 8 or TAMRA-alkyne 9, respectively. This can be followed by techniques including fluorescence microscopy, TLC analysis and mass spectrometry for detection of products, the latter based on mass shifts away from natural lipids derived from the appended tag.
Scheme 2.

Schematic depicting the labeling of phosphatidylinositol lipids in cells with detection via fluorescence microscopy, mass spectrometry and TLC.
Cellular fluorescence microscopy studies were performed with T-24 human cancer cells as well as C. albicans cells as a model eukaryotic organism that shows significant gene homology with mammalian cells.[23] Cell cultures were grown with or without either probe 1a or 1b in a range of quantities and then treated with Cy3-DIBO 8 to assess labeling. For probe 1a, cells treated with concentrations ranging from 50 μM to 2 mM generally yielded readily observable fluorescence signals cells. A representative image of labeling in human T-24 human cancer cells is shown in Figure 2A following treatment with 50 μM 1a, alongside a DAPI stain (Figure 2B) and a merged image (Figure 2C). A control experiment was run in which untreated cells were subjected to fluorophore 8, which resulted in minimal background fluorescence (Figure 2D, with DAPI stain in Figure 2E and merged image in Figure 2F), arguing against nonspecific labeling. In these experiments, probe 1b did not yield observable fluorescence signals, which may be because this compound is not entering cells or that it is not being hydrolyzed to unveil active probe 1a (data not shown). Fluorescence imaging experiments were generally performed by growing cells in synthetic media lacking myo-inositol. When cells were grown in media containing myo-inositol, fluorescence labeling was abrogated. This provides evidence that probe 1a labels the products of myo-inositol, while also reinforcing that this probe is not a strong competitor against the natural substrate, as suggested by the data in Figure 1. Enlarged and black and white versions of the images shown in Figure 2 are included in the supplementary information (Figures S1 and S2, respectively).
Figure 2.

Fluorescence images of cell labeling by probe 1a. Human T-24 cancer cells were treated with clickable Cy3 fluorophore 8 in the presence (A-C) or absence (D-F) of probe 1a. A&D: Cy3 channel (green), B&E: DAPI channel (magenta), C&F: Merged images. Scale bars (white) indicate 5 μm.
Similar studies in C. albicans also indicated successful labeling in study samples using 1 mM 1a (Figure 3A) compared to controls (Figure 3B). In addition, to investigate how the transport of 1a occurs, a concurrent experiment was run using a mutant cell line deficient in myo-inositol transporter-1 (Itr1). C. albicans itrlΔΔ mutant cells incubated with 1 mM of 1a also showed fluorescent activity (Figure 3C), indicating that some if not all of the tagged substrate is not dependent on transport by Itr1. Once again, a control study lacking 1a but treated with 8 did not yield a detectable signal (Figure 3D), ruling out non-specific labeling by the dye alone. These results could be explained by passive transport of 1a into cells or by transport by another transporter such as Itr2 or a different carbohydrate transporter. This suggests that 1a is not restricted to utilizing Itr1 for transport and thus may not be subject to the same regulatory mechanisms as natural myo-inositol. This is also reflected in previous studies in substrate specificity of the C. albicans ITR1 protein.[24] This was corroborated by cell growth studies comparing the effects of natural myo-inositol and probe 1a in the growth medium described in the following paragraphs. Enlarged and black and white versions of the images shown in Figure 3 are included in the supplementary information (Figures S3 and S4, respectively).
Figure 3.

Fluorescence imaging results using C. albicans cells. Treatment with 8 in the presence or absence of 1a was performed with WT cells (A and B, respectively, Cy3 channel (red)) and itrlΔΔ cells (C and D, respectively). Scale bars indicate 10 μm.
During the process of cellular imaging experiments, we also studied how probe 1a affects cell growth. During growth, cells were maintained in synthetic medium containing 2% glucose, no myo-inositol (unless otherwise noted), and known amounts of nutrients as described by Jesch and co-workers.[25] This medium was used to avoid the inherent randomization of nutrient concentration in standard YPD media and to induce expression of the INO1 gene in WT cells and maximize the uptake of 1a. C. albicans cells were grown with either natural myo-inositol or 1a in concentrations ranging from 0.25 to 2 mM. As can be seen by the results shown in Figure 4, C. albicans grown in these concentrations of myo-inositol showed comparable growth. However, increasing concentrations of 1a in the growth medium led to a significant increase in cell growth, and enhanced growth relative to treatment with natural myo-inositol. It should be noted that this occurs when natural myo-inositol is not included in the growth medium. This was an unexpected outcome, but there is a reasonable explanation. In S. cerevisiae, myo-inositol is known to repress phospholipid synthesis through the UASINO element, although it is less clear if this occurs in C. Albicans.[25,26] It is plausible that modified probes such as 1a may not trigger the same repression mechanisms as natural myo-inositol while still remaining active as precursors to phospholipids. These circumstances also have the potential to induce formation of endogenous myo-inositol via conversion from glucose in the absence of environmental myo-inositol.
Figure 4.

WT C. albicans growth curves upon treatment with varying concentrations of either myo-inositol or probe 1a shows enhanced cell growth in the presence of the latter. Error bars depict the standard deviations from at least three replicates composed of different batches of cells.
One downside to capping the myo-inositol 2- hydroxyl group is that this position is specifically modified in the yeast inositol phosphorylceramide (IPC) pathway, which is essential. Thus, blocking the 2-position of probe 1a with a propylazido group prevents that hydroxyl from being mannosylated, which produces essential mannosylinositol phosphorylceramide (MIPC) metabolites for yeast cell growth.[27] It is possible that the problem of C2 hydroxyl capping in the MIPC pathway is being solved by cells converting glucose in the medium to myo-inositol, which could satisfy inositol sphingolipid synthesis. Studies where we spiked INO1 knockout yeast cells with the same amount of 1a showed no cell growth with glucose in the medium, suggesting that this gene is pivotal in supplying needed natural myo-inositol.
As our fluorescence imaging results support that probe 1a is effective for labeling, we next sought evidence that this compound specifically labels phosphatidylinositol lipids. To do so, we conducted fluorescence-based TLC experiments to visualize labeled products. Here, cells grown in the presence of 1a in concentrations ranging from 0.25 to 2 mM were then subjected to lipid extraction. Next, products were labeled via the copper-catalyzed azide-alkyne cycloaddition using TAMRA-alkyne 9 (Scheme 2), and then separated on TLC using an eluant reported for the detection of PI lipids (chloroform/acetone/methanol/acetic acid/water (46/17/15/14/8, v/v)).[28] Figure 5 shows a fluorescent image of a representative TLC plate. We observed a dose-dependent response in the appearance of fluorescent spots at higher concentrations of 1a that appear at Rf values associated with PI lipids.[28]
Figure 5.

Fluorescence image of dose-dependent TLC labeling in C. albicans. Treatment with increasing concentrations of probe 1a: 0 (a-c), 0.25 (d-f), 0.5 (g-i), 1 (j-l), and 2 mM (m-o) leads to enhanced fluorescent spots. Arrows indicate the averaged Rf values of commercial di-C16 isomers of PI (red), PI(4)P (blue) and PI(4,5)P2 (green) standards.
For further analysis of labeled products, TLCs were run under these conditions with commercially available di-C16 isomers of PI, phosphatidylinositol 4-phosphate (PI(4)P) and phosphatidylinositol-4,5-bisphosphate (PI(4,5)P2) as standards, obtained from Echelon Biosciences. The average Rf values for these are indicated by the red, blue and green arrows in Figure 4, respectively. In each case, new spots appear close to the standards, particularly at higher concentrations of probe 1a. It should be noted that comparison to these standards are made with caution since they are not identical to the labeled product structures, and Rf differences would be expected to arise from the modification of the lipid headgroup through labeling. However, there are compelling characteristics of the labeled spots that provide evidence of labeling. Firstly, PI lipids have a unique elution profile on TLC owing to the strong charge density on the headgroup due to the phosphate and hydroxyl groups, counteracted by their hydrophobic backbone, which aids in their separation. Secondly, the location of our new spots makes sense in terms of polarity considerations. Since PI is the least polar of these compounds with only one minus charge from the phosphodiester, one would expect that this compound would be most affected by derivatization during labeling. Indeed, the new spots near the PI arrow differ the most from the position of this standard. This is also where the most intense spots appear, which is in accordance with PI’s natural abundance and that PI is expected to be labeled directly by probe 1a. The highly polar phosphate monoester group(s) of PI(4)P and PI(4,5)P2 result in a significant increase in charge that should be the dominating force in the elution profile and might be expected to diminish the effect of headgroup modification. Accordingly, the new spots clustered around the PI(4)P and PI(4,5)P2 standards appear very close to the standard arrows. For these reasons, the appearance of new TLC spots at these particular locations provides evidence of PI lipid labeling.
We additionally performed mass spectrometry (MS) experiments aimed at detecting labeled products. These studies proved to be challenging, which we attribute to multiple factors. One issue is that PI lipids are present at very low concentrations in cells. As a result, the detection of these lipids by MS lipidomics is often facilitated by growing large cell cultures that were precluded by the concentrations of probe 1a that would be required. In addition, the high concentrations of 1a needed for PI synthase inhibition in Figure 1 suggest that a high percentage of lipid products may not be labeled in this case, which would further exacerbate detection. Due to difficulties encountered while pursuing the detection of labeled PI products directly from cell extracts, we resorted to separation of PI lipids using the TLC conditions described above, followed by extraction from TLC plates for analysis by LCMS. Using this approach, we were able to identify mass peaks corresponding to multiple labeled azido-PI products bearing different acyl chains, for which representative spectra are included in the supporting information (Figure S5A–D). We also detected peaks that match the loss of N2 from labeled azido-PIs (Figure S5E–F), which is a common mode of fragmentation for the azide group, and would also serve to diminish the signal of the parent azido-PI structures. These data also provide evidence of PI lipid labeling by probe 1a.
Conclusions
This work provides a promising means for the cellular labeling, imaging and detection of inositol-containing products using clickable myo-inositol probe 1a. Fluorescence imaging results show the ability to label cells in a probe-dependent manner, supporting the infiltration of biosynthetic pathways. The inhibition of PI synthase activity, loss of fluorescence labeling in the presence of myo-inositol, and TLC and MS results provide evidence of PI lipid labeling. As a result, this provides a promising platform for tracking the complex metabolite interconversions that occur in lipid biosynthetic pathways to aid in elucidating the biological roles of PI lipids.
With these results, we can compare this system to the azidoinositols reported for GPI anchor labeling.[13] A primary difference is that the probes studied in that work were tagged at the 3-, 4- or 5-position to avoid functional groups that are modified during or required for GPI formation, whereas we introduced the tag at the 2-position to avoid those three positions, which are phosphorylated in PIPns. Both sets of probes proved suitable for labeling their respective targets in cells. Interestingly, Guo and co-workers observed dramatically better labeling with partially acylated probes, while we obtained better results with the unprotected hydroxyl groups of 1a, although we did not study partially acylated probes. In addition to this factor, variations may result from differences in transport or esterase activity of the different probes, particularly since different cell lines were used, and thus cell wall/membrane composition and transport machinery differ.
One issue with the current approach is that the presence of numerous inositol-containing products may complicate the differentiation of labeled products. In addition, modification of any of the 6-hydroxyl groups of myo-inositol will inherently abrogate certain products, such as the MIPC pathway in yeast or other metabolites including inositol hexakisphosphate (IP6). In future work, the combination of varying probe structures to differentially label lipid products with mutant cell lines deficient in certain biosynthetic pathways will be pursued to differentiate labeled products.
Experimental Section
General Experimental:
All non-aqueous reactions were performed in flame dried glassware under nitrogen or argon atmosphere unless stated otherwise. All solvents used in the reactions were as is unless stated otherwise. Dichloromethane (DCM), N,N-dimethylformamide (DMF), and tetrahydrofuran (THF) were obtained from an in-house dry solvent system and stored over activated 4 Å molecular sieves under nitrogen atmosphere. All commercially available compounds were used as received without further purification. Reactions were monitored by thin-layer chromatography (TLC) carried out on 0.25 mm Sorbtech silica gel plates (60F-254) under 254 nm UV lamp and stained by potassium permanganate solution or other functional group-specific stains. Flash chromatography was performed on silica gel 60 (0.040–0.063 mm). 1H, 13C, and 2D NMR spectra were recorded on liquid state Varian VNMRS spectrometer (500 MHz). Chemical shifts are reported in δ (ppm) and calibrated using residual undeuterated solvents as an internal reference. The following abbreviations were used to explain the multiplicities: s=singlet, d=doublet, t=triplet, q=quartet, dd=doublet of doublet, dt=doublet of triplet, td=triplet of doublet, m=multiplet, br=broad. 1H NMR coupling constants (J) are reported in Hertz (Hz), Mass spectra were obtained using Applied Biosystems/QStar Elite HPLC—QTOF mass spectrometers. 4,6-di-0-benzyl-1,3,5-methylidyne-myo-inositol (3) was synthesized as previously described.30
2-O-(3-azidopropyl)-4,6-di-O-benzyl-1,3,5-methylidyne-myo-inositol (4):
To dichloromethane (10 mL) in a 50 mL round-bottomed flask at −78 °C were added 3-azido-1-propanol (0.650 g, 6.42 mmol), 2,6-lutidene (0.488 mL, 4.21 mmol) and triflic anhydride (0.712 mL, 4.21 mmol). The reaction was stirred at this temperature for 1 h and then quenched with H2O (10 mL) and extracted (3 × 5 mL) with dichloromethane. The organic layer was collected and dried over Na2SO4. The solvent was removed under reduced pressure, and the crude triflate was capped. Compound 3 (0.500 g, 1.35 mmol) and proton sponge (0.694 g, 3.24 mmol) were added to a glass sealed tube. Dichloromethane (4 mL) was added to the tube along with a small stirbar and the crude azido-triflate. The tube was sealed tightly, and the reaction mixture was then allowed to stir and heated to 85 °C for 12 h. The reaction mixture was allowed to cool to rt and then partitioned between H2O (15 mL) and dichloromethane (3 × 15 mL). The organic layer was collected and dried over Na2SO4. The solvent was removed under reduced pressure and the crude oil was subjected to flash chromatography using 10% EtOAc/hexanes as eluent to afford 4 as a colorless oil (0.329 g, 58%). 1H NMR (CDCl3, 500 MHz) δ 1.90 (m, 2H), 3.44 (t, 2H, J = 6.6 Hz), 3.58 (t, 2H, J = 6.1 Hz), 3.90 (q, 1H, J = 1.69 Hz),4.29 (m, 2H), 4.37 (t, 2H, J = 3.2 Hz), 4.45 (m, 1 H), 4.63 (dd, 4H, J = 69.2, 11.7 Hz), 5.51 (s, 1H), 7.31 (m, 10H). 13C NMR (CDCl3, 125 MHz) δ 29.27, 48.32, 65.86, 68.07, 68.36, 70.30, 71.95, 74.10, 103.20, 127.77, 127.99, 128.51, 137.61. MS (DART-TOF, m/z): calcd for C22H23N3O6 (M − N2)+ 426.1838. Found 426.1858.
2-O-(3-azidopropyl)-4,6-di-O-benzyl-myo-inositol (5):
Compound 4 (0.33 g, 0.77 mmol), and para-toluene sulfonic acid (0.12 g, 0.72 mmol) were combined together in methanol (2 mL) in a 25 mL round-bottomed flask and allowed to stir at rt for 24 h. All volatiles were removed under reduced pressure and the crude mixture was subjected to flash chromatography using 50% EtOAc/hexanes as eluant to afford 5 (0.23 g, 73%) as a clear oil. 1H NMR (CDCl3, 500 MHz) δ 1.85 (m, 2H), 2.49 (t, 2H, J = 5.51 Hz), 3.38 (t, 2H, J = 6.6 Hz), 3.55 (m, 5H), 3.81 (t, 1H, J = 2.6 Hz), 3.87 (t, 2H, J = 5.8 Hz), 4.86 (q, 4H, J = 11.4 Hz), 7.28–7.40 (m, 10H). 13C NMR (CDCl3, 125 MHz) δ 29.32, 48.90, 70.92, 72.39, 75.05, 80.21, 81.86, 127.98, 128.08, 128.63, 138.46. MS (DART-TOF, m/z): calcd for C21H25N3O6 (M + H) 416.1743. Found 416.2085.
1.3.5-tri-O-acetyl-2-O-(3-azidopropyl)-4,6-di-O-benzyl-myo-inositol (6):
Compound 5 (0.297 g, 0.671 mmol), DMAP (0.041 g, .336 mmol) and acetic anhydride (10 mL, 110 mmol) were dissolved in pyridine (30 mL) in a 100 mL round-bottomed flask and stirred at 65 °C for 12 h. The reaction was quenched with saturated NaHCO3 (50 mL) and extracted with DCM (3 × 15 mL). The organic layers were washed with brine, dried over sodium sulfate and the solvent evaporated was under reduced pressure. The crude product was subjected to flash chromatography using 25% EtOAc/hexanes to afford compound 6 (0.291 g, 74%) as an off-white solid. 1H NMR (CDCl3, 500 MHz) δ 1.80–1.85 (m, 2H), 1.87 (s, 3H), 2.00 (s, 6H), 3.43 (t, 2H, J = 6.6 Hz), 3.64 (t, 2H, J = 5.7 Hz), 3.91 (t, 3H, J = 10.2 Hz), 4.59 (q, 4H, J = 11.7 Hz), 4.91 (dd, 2H, J = 10.2, 2.6 Hz), 5.16 (t, 1H, J = 9.7 Hz), 7.21–7.34 (m, 10H). 13C NMR (CDCl3, 125 MHz) δ 20.78, 29.51, 48.11, 70.26, 72.96, 73.52, 74.66, 127.56, 127.66, 128.36, 138.08, 169.60. MS (DART-TOF, m/z): calcd for C29H35N3O9 (M − N2)+ 542.2239. Found 542.2362.
1.3.5-tri-O-acetyl-2-O-(3-azidopropyl)-myo-inositol (7):
To a solution of 6 (0.100 g, 0.176 mmol) in EtOAc (2.5 mL) in a 50 mL round-bottomed flask was added a solution of sodium bromate (0.265 g, 1.73 mmol) in water (2 mL). A solution of sodium hydrosulfite (0.275 g, 1.58 mmol) in water (5 mL) was added dropwise over 10 min and the reaction was vigorously stirred for 24 h at rt. The reaction was then diluted with EtOAc (10 mL), quenched with 10% sodium thiosulfate (2 mL) and extracted with water. The combined organic layers were dried over MgSO4 and evaporated under reduced pressure. The crude product was then subjected to flash chromatography with a 50%−75% EtOAc/hexanes gradient to afford 7 (0.0435 g, 64%) as a clear oil. 1H NMR (CDCl3, 500 MHz) δ 1.78–1.83 (m, 2H), 2.12 (s, 6H), 2.14 (s, 3H), 3.43 (t, 2H, J = 6.6 Hz), 3.67 (t, 2H, J = 5.7 Hz), 3.88 (s, 1 H), 3.96 (t, 2H, J = 9.9 Hz), 4.90 (dd, 2H, J = 10.3, 2.5 Hz), 4.95 (t, 1H, J = 9.6 Hz). 13C NMR (CDCl3, 125 MHz) δ 20.89, 21.01, 29.51, 48.02, 69.86, 70.12, 73.44, 75.98, 170.71, 171.89. MS (DART-TOF, m/z): calcd for C15H23N3O9 (M + H) 390.1434. Found 390.1453.
2-O-(3-azidopropyl)-myo-inositol (1a):
Compound 7 (0.0223 g, 0.0573 mmol) was dissolved in dry methanol (4 mL) in a 25 mL round-bottomed flask and sodium methoxide (0.0092 g, 0.1719 mmol) was added. The mixture was heated at 70 °C for 6 h, after which the excess sodium methoxide was quenched with H2O. The contents were lyophilized and then reconstituted in 1 mL of H2O. Cation-exchange resin Amberlite IR-120 (pretreated with 2M HCl and H2O) was added and the mixture was vortexted for 5 min. The resin was removed by filtration with methanol and the filtrate was lyophilized to afford 1a quantitatively (0.0134 g) as a white solid. 1H NMR (CDCl3, 500 MHz) δ 1.84 (m, 2H), 3.12 (t, 1H, J = 9.2 Hz), 3.30 (m, 3H), 3.37 (dd, 2H, J = 9.9, 2.7 Hz) 3.44 (t, 2H, J = 6.9Hz), 3.56 (t, 2H, J = 9.5 Hz), 3.69 (t, 1H, J = 2.7 Hz), 3.84 (t, 2H, J = 6.0 Hz). 13C NMR (CDCI3, 125 MHz) δ 72.32, 73.22. MS (DART-TOF, m/z): calcd for C9H17N3O6 (M − N2)+ 236.1056. Found 236.1148
1,3,4,5,6-penta-O-acetyl-2-(3-azidopropyl)-myo-inositol (1b):
Compound 7 (0.0435 g, 0.112 mmol), and acetic anhydride (5 mL, 50 mmol) were dissolved in pyridine in a 25 mL round-bottomed flask and stirred at 65 °C for 12 h. The reaction was quenched with saturated NaHCO3 (30 mL) and extracted with DCM (3 × 10 mL). The organic layer was washed with brine, dried over sodium sulfate and the solvent was evaporated under reduced pressure. The crude product was subjected to flash chromatography with 25% EtOAc/hexanes as eluent to afford 1b quantitatively (0.0528 g) as a white solid. 1H NMR (CDCl3, 500 MHz) δ 1.87 (m, 2H), 2.01 (s, 9H), 2.08 (s, 6H), 3.51 (t, 2H, J = 6.4 Hz), 3.71 (t, 2H, J = 5.7), 3.98 (t, 1H, J = 2.5 Hz), 4.99 (dd, 2H, J = 10.5, 2.5 Hz), 5.13 (t, 1H, J = 9.7 Hz), 5.54 (t, 2H, J = 10.1). 13C NMR (CDCl3, 125 MHz) δ 20.50, 20.58, 29.50, 47.85, 69.76, 70.45, 70.92, 71.11, 76.56, 169.71, 169.73, 169.78. MS (DART-TOF, m/z): calcd for C17H23N3O11 (M − N2)+ 446.1584. Found 446.1607.
Phosphatidylinositol Synthase Assay
This procedure was performed similar to those previously described for phosphatidylserine synthesis.34,35 Cultures of wild type C. albicans were grown overnight and diluted into 1 L YPD the next day, to approximately 0.1 OD600/mL. 1 L cultures were shaken at 30°C for approximately 6 hours. Cells were then centrifuged at 6,000 xg for 20 minutes. Pellets were then washed with water, pelleted, then supernatant was removed and the wet weight of the samples was measured. Cell pellets were stored overnight at −80°C. The next day a cold mixture consisting of 0.1 M Tris-Cl pH 7.5, 5 mM β-mercaptoethanol (BME), 10% glycerol, and protease inhibitors (phenylmethylsuphonylfluoride (PMSF), leupeptin, and pepstatin) was added to the frozen pellets (1mL/g [wet weight]). Once cells were thawed, they were lysed using a French Press (three passes at approximately 13,000 lb/in2). Homogenate and unbroken cells were centrifuged at 4°C for 5 minutes at 3.000 rpm. The supernatant was spun again at 27,000 g for 10 minutes at 4°C to enrich for ER membranes. Pellets were resuspended in 500 μL of 0.1 M Tris-Cl pH 7.5 containing 5 mM β-mercaptoethanol (BME), 10% glycerol, and protease inhibitors. Samples were then aliquoted into microcentrifuge tubes and homogenized. Total crude protein concentration was determined using a Bradford Assay.
The PI synthase assay mixture contained 50 mM Tris-HCl pH 7.5, 0.1% Triton X-100, 0.5 mM MnCl2, 0.1 mM CDP-DAG (Avanti Polar Lipids, Alabaster, AL) added as a suspension in 1% Triton X-100 and 0.5 mg protein in a total volume of 100 μL. Probes 1a and 1b were added to achieve final concentrations of 10 or 25 mM. The negative control contained no ER membranes. The assay was performed by monitoring the incorporation of 0.5 mM myo-inositol spiked with 5% (by volume) [3H]-myo-inositol (Sp. Act. 10–20 Ci/mmol) (0127100S MP BIOMEDICALS) into the chloroform-soluble product at 37°C for a predetermined amount of time. The reaction was terminated by the addition of 1 mL chloroform: methanol (2:1). Following a low-speed spin, 1 mL of the supernatant was removed to a fresh tube and washed with 200 μL 0.9% NaCl. Following a second low-speed spin, 400 μL of the chloroform phase was removed to a new tube and washed with 500 μL of chloroform: methanol: 0.9% NaCl (3:48:47). Following a third low-speed spin, 200 μL was transferred into scintillation vials (Thermo Fisher Scientific, San Jose, CA). Tubes were left open in the hood until dried fully. The next day, 2.5 mL scintillation fluid was added to each tube and run through the scintillation counter.
C. Albicans Cell Culture:
C. albicans wild type and itr1ΔΔ SC 5314 strains were maintained on yeast extract/peptone/dextrose (YPD) plates (1% yeast extract, 2% bactopeptone, 2% glucose, and 2% agar). All experiments were performed using chemically defined synthetic complete media containing (per liter): 20 g of glucose, 5 g of ammonium sulfate, 1 g of potassium phosphate, 0.5 of g magnesium sulfate,1 g of sodium chloride, 0.1 g of calcium chloride, 0.5 mg of boric acid, 0.04 mg of cupric sulfate, 0.1 mg of potassium iodide, 0.2 mg of ferric chloride, 0.4 mg of manganese sulfate, 0.2 mg of sodium molybdate, 0.4 mg of zinc sulfate, 2 μg biotin, 400 μg calcium pantothenate, 2 μg of folic acid, 400 μg of niacin, 200 μg of p-aminobenzoic acid, 400 μg pyridoxine hydrochloride, 200 μg of riboflavin, 400 μg of thiamine, 20 mg of adenine sulfate, 20 mg of arginine, 20 mg of histidine, 60 mg of leucine, 230 mg of lysine, 20 mg of methionine, 300 mg of threonine, 20 mg of tryptophan, and 40 mg of uracil.
Growth Curve Protocol:
C. albicans strains were added to 25 mL of synthetic minimal media with or without inositol or probe 1a as noted, and incubated at 30 °C with medium shaking for 24 hours. After 24 hours, an OD measurement was taken and 5 mL of fresh synthetic minimal media was inoculated with cell preculture to an OD of 0.2. Samples were spiked with a defined concentration of 1a or 1b and incubated at 30° C with medium shaking. Every two hours, a culture sample was taken and read for optical density. This was done for a minimum of 12 hours and then a 24 hour reading was taken to assess lag phase characteristics. Cells used for further studies were centrifuged and the supernatant was discarded. When necessary, cells were frozen at −78° C for overnight storage prior to use.
Metabolic Labeling Growth Protocol:
Cells were added to 25 mL of synthetic minimal media (−) inositol and incubated at 30 °C with medium shaking for 24 hours. After 24 hours, an OD measurement (1 mL, 10x dilution of preculture) was taken in order to calculate the cell volume needed for the initial OD value and 5 mL of fresh synthetic minimal media was inoculated with cell preculture to an OD of 0.2. This inoculum was incubated at 30 °C with medium shaking for 6 hours. The study samples were spiked with a defined concentration of 1a (40 mM stock in milli-q water) or 1b (40 mM stock in DMSO) to reach desired incubation concentration and allowed to stir for another 4 hours. After 4 hours the cells were centrifuged (4,000 RPM, 3 min) and the supernatant was discarded.
Human Cell Culture
Human T-24 bladder cancer cells obtained from ATCC® (Manassas, VA), were cultured in a humidified incubator under 5% CO2 in McCoy’s medium supplemented with 10% of Fetal Bovine Serum, 50 μg/ml streptomycin and 50 U/mL penicillin (Invitrogen). Cells were plated two days prior the experiment at a seeding density of 1 × 10⁴ cells per well on a glass coverslip. Cells were then incubated with probe 1a at a concentration of 50 μM overnight at 37°C with OPTI-MEM medium (Invitrogen). T-24 cells were then washed twice with PBS containing 1 mM MgCl2 and 100 mM CaCl2 and subjected to fluorescent imaging.
Fluorescent Copper-Free Click Protocol:
Cells were washed and centrifuged (4,000 RPM, 5 min) twice with milli-q water (5 or 10 mL depending on initial experimental volume). Cells were then resuspended in equal amount of milli-q water that was discarded as supernatant. Next, 500 μL of labeled cells were added to a 2 mL eppendorf tube. Dye 8 was added to cell culture to reach a total concentration of 10 μM and the resulting solution was shaken for 1.5 hours covered with aluminum foil. Cells were centrifuged (13,000 rpm, 5 min) and the supernatant was discarded. An alternate wash and centrifuge was then performed with the following: 1 mL milli-q water, 1 mL saturated NaCl, 1 mL 45 mM Potassium Cyanide, and 1 mL milli-q water 2x for 5 wash and centrifuge cycles total. After the last centrifugation, cells were resuspended in 200 μL of milli-q water. 2 μL of cell culture were next mounted onto a microscope slide followed by 1 drop of Prolong Gold with DAPI Stain (Vector Laboratories). A cover slip was placed on top of the cell inoculum and allowed to dry for 24 −48 hours. Slips were sealed with acrylic nail polish then imaged on a Leica SP8 confocal microscope (C. Albicans cells) or a Zeiss LSM710 confocal microscope (human T-24 cells). Contrast and brightness settings were chosen so that all pixels were in the linear range. Images are the product of fourfold line averaging.
Lipid Extraction Protocol:
The cell pellets were thawed and then extracted with 5 mL of 95% ethanol-water-diethylether-pyridine-concd NH4OH 15: 15:5:1:0.018 (by vol) for 15 min at 60 °C. The extract was removed after centrifugation (4000 RPM, 3 min) and the pellet extracted twice more in the same manner into 20 mL glass screw cap vials. The lipid solutions were then dried over a stream of nitrogen overnight. After drying, lipid pellets were either resuspended in 200 μL 9:1 MeOH/CHCl3 with 5 μL of piperidine solution (300 mM stock solution in water) added for MS analysis or subjected to TLC click protocols as follows.
TLC Imaging Protocol:
Lipid pellets were dissolved in 500 μL of DMSO in a glass screw cap vial. Dye 9 (40 mM stock in milli-q water, 250 μM final conc) in DMSO followed by CuSO4/THPTA complex (dissolve 50 mg of copper(II) sulfate pentahydrate in 10 mL of distilled water. Dissolve 95 mg of THPTA ligand in 11 mL of DMSO. A mix of two solutions, (10 mM stock, and 500 μM final conc)) was added. Sodium ascorbate (1 M stock in milli-q water, 25 mM final conc) was then added followed by water to a total volume of 1 mL, and the vials were sealed and heated at 70 °C for 18 h. After the reaction was stopped, 5 mL of water and 3 mL of chloroform were added to each vial and vortexed. The organic layer was collected and then the aqueous layer was extracted again with 3 mL of chloroform and vortexed. The respective organic layers were combined and then washed twice with 4 mL of 45 mM KCN and once with 10 mL of water. The organic layers were collected and dried under a stream of nitrogen overnight. The clicked lipid extract was then dissolved in 100 μL of chloroform and applied to the TLC plate. The elution gradient used was chloroform/acetone/methanol/acetic acid/water (46/17/15/14/8, v/v). Fluorescence images were taken on a GE Typhoon Trio imager set to scan for fluorescence. Laser gain used was variable from 250 PMT to 500 PMT depending on background intensity.
Mass Spectrom etry Analysis:
For MS analysis, TLC plates prepared as described above were scraped and extracted 2 times with 2 mL of chloroform/methanol/conc. HCl (20/40/1, v/v/v) with the help of sonication and vortexing. The extractions were performed an hour apart. To the supernatant (4 mL) was added 1.3 mL chloroform and 2.4 mL water. After vortexing and centrifugation, the lower phase was collected and concentrated. Samples were analyzed by LCMS using a Thermo Scientific Q Exactive Hybrid Quadrupole-Orbitrap Mass Spectrometer. Both negative and positive mode experiments were performed, and data are labeled with the mode in which they were detected. MS data were analysed using the MAVEN software package in order to search for a list of potential products expected from metabolic labeling of products using probe 1a.
Supplementary Material
Scheme 1.

Synthesis of 2-azidopropyl myo-inositol ether probes 1a-b.
Acknowledgements
This research was supported by funding from the National Institutes of Health (R15GM120705). A portion of the fluorescence imaging studies in this work was conducted at the Center for Nanophase Materials Sciences, which is a DOE Office of Science User Facility.
Footnotes
Dedicated to Professor Chi-Huey Wong on the occasion of his 70th birthday
References
- [1].Best MD, Zhang HL, Prestwich GD, Nat. Prod. Rep 2010, 27, 1403–1430. [DOI] [PubMed] [Google Scholar]
- [2].Berridge MJ, Irvine RF, Nature 1989, 341, 197–205. [DOI] [PubMed] [Google Scholar]
- [3].a) Maiti SN, Balasubramanian K, Ramoth JA, Schroit AJ, J. Biol. Chem 2008, 283, 3761–3766; [DOI] [PubMed] [Google Scholar]; b) Reshetnyak YK, Andreev OA, Lehnert U, Engelman DM, Proc. Natl. Acad. Sci 2006, 103, 6460–6465. [DOI] [PMC free article] [PubMed] [Google Scholar]
- [4].Larner J, Int. J. Exp. Diabet. Res 2002, 3. [DOI] [PMC free article] [PubMed] [Google Scholar]
- [5].a) Berridge MJ, Lipp P, Bootman MD, Nat. Rev. Mol. Cell Biol. 2000, 1, 11–21; [DOI] [PubMed] [Google Scholar]; b) Streb H, Irvine RF, Berridge MJ, Schultz I, Nature 1983, 306, 67–69. [DOI] [PubMed] [Google Scholar]
- [6].Di Paolo G, De Camilli P, Nature 2006, 443, 651–657. [DOI] [PubMed] [Google Scholar]
- [7].a) Uldry M, Ibberson M, Horisberger J-D, Chatton J-Y, Riederer BM, Thorens B, The EMBO Journal 2001, 20, 4467–4477; [DOI] [PMC free article] [PubMed] [Google Scholar]; b) Hirata M, Yanaga F, Koga T, Ogasawara T, Watanabe Y, Ozaki S, J. Biol. Chem 1990, 265, 8404–8407; [PubMed] [Google Scholar]; c) Hirata M, Watanabe Y, Ishimatsu T, Ikebe T, Kimura Y, Yamaguchi K, Ozaki S, Koga T, J. Biol. Chem 1989, 264, 20303–20308. [PubMed] [Google Scholar]
- [8].a) Majerus PW, York JD, J. Lipid Res. 2009, 50, S249–S254; [DOI] [PMC free article] [PubMed] [Google Scholar]; b) Vucenik I, Shamsuddin AM, Nutr. Cancer 2006, 55, 109–125. [DOI] [PubMed] [Google Scholar]
- [9].a) Sletten EM, Bertozzi CR, Angew. Chem., Int. Edit 2009, 48, 6974–6998; [DOI] [PMC free article] [PubMed] [Google Scholar]; b) Best MD, Biochemistry 2009, 48, 6571–6584; [DOI] [PubMed] [Google Scholar]; c) Jewett JC, Bertozzi CR, Chem. Soc. Rev 2010, 39, 1272–1279; [DOI] [PMC free article] [PubMed] [Google Scholar]; d) McKay CS, Finn MG, Chem. Biol 2014, 21, 1075–1101. [DOI] [PMC free article] [PubMed] [Google Scholar]
- [10].Saxon E, Bertozzi CR, Science 2000, 287, 2007–2010. [DOI] [PubMed] [Google Scholar]
- [11].a) Jao CY, Roth M, Welti R, Salic A, Proc. Natl. Acad. Sci. U.S.A. 2009, 106, 15332–15337; [DOI] [PMC free article] [PubMed] [Google Scholar]; b) Iyoshi S, Cheng JL, Tatematsu T, Takatori S, Taki M, Yamamoto Y, Salic A, Fujimoto T, ACS Chem. Biol 2014, 9, 2217–2222; [DOI] [PubMed] [Google Scholar]; c) Jao CY, Roth M, Welti R, Salic A, Chembiochem 2015, 16, 472–476. [DOI] [PubMed] [Google Scholar]
- [12].a) Bumpus TW, Baskin JM, Angew. Chem.-Int. Edit 2016, 55, 13155–13158; [DOI] [PMC free article] [PubMed] [Google Scholar]; b) Bumpus TW, Baskin JM, ACS Cent. Sci. 2017, 3, 1070–1077. [DOI] [PMC free article] [PubMed] [Google Scholar]
- [13].Lu L, Gao J, Guo Z, Angew. Chem., Int. Ed 2015, 54, 9679–9682. [DOI] [PMC free article] [PubMed] [Google Scholar]
- [14].Pasari S, Ismail SM, Wenk MR, Lear MJ, Tet. Lett 2015, 56, 2597–2601. [Google Scholar]
- [15].Best MD, Zhang H, Prestwich GD, Nat. Prod. Rep 2010, 27, 1403–1430. [DOI] [PubMed] [Google Scholar]
- [16].a) Breidenbach MA, Gallagher JEG, King DS, Smart BP, Wu P, Bertozzi CR, Proc. Natl. Acad. Sci 2010, 107, 3988–3993; [DOI] [PMC free article] [PubMed] [Google Scholar]; b) Laughlin ST, Agard NJ, Baskin JM, Carrico IS, Chang PV, Ganguli AS, Hangauer MJ, Lo A, Prescher JA, Bertozzi CR, in Methods Enzymol., Vol. Volume 415, Academic Press, 2006, pp. 230–250. [DOI] [PubMed] [Google Scholar]
- [17].Lee HW, Kishi Y, J. Org. Chem 1985, 50, 4402–4404. [Google Scholar]
- [18].Gurale BP, Shashidhar MS, Gonnade RG, J. Org. Chem 2012, 77, 5801–5807. [DOI] [PubMed] [Google Scholar]
- [19].Jiang G, Xu Y, Falguières T, Gruenberg J, Prestwich GD, Org. Lett 2005, 7, 3837–3840. [DOI] [PMC free article] [PubMed] [Google Scholar]
- [20].Lauber MB, Daniliuc C-G, Paradies J, Chem. Commun 2013, 49, 7409–7411. [DOI] [PubMed] [Google Scholar]
- [21].Niemietz M, Perkams L, Hoffman J, Eller S, Unverzagt C, Chem. Commun 2011, 47, 10485–10487. [DOI] [PubMed] [Google Scholar]
- [22].a) Chen YL, Montedonico AE, Kauffman S, Dunlap JR, Menn FM, Reynolds TB, Mol. Microbiol 2010, 75, 1112–1132; [DOI] [PubMed] [Google Scholar]; b) Cassilly CD, Farmer AT, Montedonico AE, Smith TK, Campagna SR, Reynolds TB, FEMS Yeast Res. 2017, 17. [DOI] [PMC free article] [PubMed] [Google Scholar]
- [23].Botstein D, Chervitz SA, Cherry M, Science 1997, 277, 1259–1260. [DOI] [PMC free article] [PubMed] [Google Scholar]
- [24].Schneider S, FEBS Lett. 2015, 589, 1049–1058. [DOI] [PubMed] [Google Scholar]
- [25].Jesch SA, Zhao X, Wells MT, Henry SA, J. Biol. Chem 2005, 280, 9106–9118. [DOI] [PMC free article] [PubMed] [Google Scholar]
- [26].a) Henry SA, Gaspar ML, Jesch SA, Chem. Phys. Lipids 2014, 180, 23–43; [DOI] [PMC free article] [PubMed] [Google Scholar]; b) Villa-García M, Choi M, Hinz F, Gaspar M, Jesch S, Henry S, Mol. Genet. Genomics 2011, 285, 125–149. [DOI] [PMC free article] [PubMed] [Google Scholar]
- [27].a) Cowart LA, Obeid LM, Biochim. Biophys. Acta, Mol. and Cell Bio. of Lipids 2007, 1771, 421–431; [DOI] [PMC free article] [PubMed] [Google Scholar]; b) Dickson RC, Lester RL, Biochim. Biophys. Acta 1999, 1426, 347–357; [DOI] [PubMed] [Google Scholar]; c) Mandala SM, Thornton RA, Rosenbach M, Milligan J, Garcia-Calvo M, Bull HG, Kurtz MB, J. Biol. Chem 1997, 272, 32709–32714; [DOI] [PubMed] [Google Scholar]; d) Nagiec MM, Nagiec EE, Baltisberger JA, Wells GB, Lester RL, Dickson RC, J. Biol. Chem 1997, 272, 9809–9817. [DOI] [PubMed] [Google Scholar]
- [28].König S, Hoffmann M, Mosblech A, Heilmann I, Anal. Biochem 2008, 378, 197–201. [DOI] [PubMed] [Google Scholar]
Associated Data
This section collects any data citations, data availability statements, or supplementary materials included in this article.