

Abstract
Prostate cancer development has been associated with changes in mitochondrial activity and reactive oxygen species (ROS) production. Melatonin (MLT) and docosahexaenoic acid (DHA) have properties to modulate both, but their protective role, mainly at early stages of prostate cancer, remains unclear. In this study, the effects of MLT and DHA, combined or not, on PNT1A cells with regard to mitochondria bioenergetics, ROS production, and proliferation-related pathways were examined. Based on dose response and lipid accumulation assays, DHA at 100 μM and MLT at 1 μM for 48 h were chosen. DHA doubled and MLT reduced (40%) superoxide anion production, but coincubation (DM) did not normalize to control. Hydrogen peroxide production decreased after MLT incubation only (p < 0.01). These alterations affected the area and perimeter of mitochondria, since DHA increased whereas MLT decreased, but such hormone has no effect on coincubation. DHA isolated did not change the oxidative phosphorylation rate (OXPHOS), but decreased (p < 0.001) the mitochondrial bioenergetic reserve capacity (MBRC) which is closely related to cell responsiveness to stress conditions. MLT, regardless of DHA, ameliorated OXPHOS and recovered MBRC after coincubation. All incubations decreased AKT phosphorylation; however, only MLT alone inhibited p-mTOR. MLT increased p-ERK1/2 and, when combined to DHA, increased GSTP1 expression (p < 0.01). DHA did not change the testosterone levels in the medium, whereas MLT alone or coincubated decreased by about 20%; however, any incubation affected AR expression. Moreover, incubation with luzindole revealed that MLT effects were MTR1/2-independent. In conclusion, DHA increased ROS production and impaired mitochondrial function which was probably related to AKT inactivation; MLT improved OXPHOS and decreased ROS which was related to AKT/mTOR dephosphorylation, and when coincubated, the antiproliferative action was related to mitochondrial bioenergetic modulation associated to AKT and ERK1/2 regulation. Together, these findings point to the potential application of DHA and MLT towards the prevention of proliferative prostate diseases.
1. Introduction
Despite its multifactorial etiology, progression and aggressiveness of prostate cancer (PCa) have been related to oxidative stress [1, 2] and the increased production of reactive oxygen species (ROS) is closely associated to alterations in the mitochondria [3]. Such organelles play a crucial role in all stages of malign transformation [3] and have been associated to PCa due to reduction in apoptotic potential [4], pathogenic mutations in genes encoding the electron transport chain (ETC) respiratory complexes, and loss of mitochondrial DNA and integrity [5]. Therefore, modulation of mitochondria physiology may be a good therapeutic target, either in the prevention of tumor development or in the induction of cancer cell death.
Melatonin (MLT) is a pleiotropic hormone with antioxidant properties that regulate mitochondrial activity [6–10] and has been investigated as a PCa suppressor [11]. Patients with PCa exhibit low MLT serum levels when compared to healthy individuals, with a notable decrease when benign prostatic hyperplasia (BPH) progresses to adenocarcinoma [11, 12]. Most cases of PCa (75%) are diagnosed in men over 65 years [11], coincidental to the period when MLT synthesis is reduced [13] and mitochondrial dysfunction increases due to ROS production [14, 15]. Regarding this evidence, MLT supplementation in patients within risk age of PCa (30–40 years old) may be an interesting chemoprevention strategy [16]. Apart from its own anticancer properties, MLT has also been investigated in combination with other compounds, due to its ability to sensitize cells and potentialize the antiproliferative effect of these compounds by inhibition of survival pathways, e.g., AKT [17]. In this context, polyunsaturated fatty acids omega-3 (PUFA ω-3), mainly docosahexaenoic acid (DHA), have been reported to increase mitochondrial ROS in tumor cells through AKT/mTOR inhibition [18], leading to cell death. Furthermore, DHA catabolism occurs in the peroxisome and mitochondria [19] and is very susceptible to oxidation caused by reactive species [20] leading to generation of cyto- and genotoxic hydroperoxides and aldehydes [21]. Although evidence suggests that DHA, a fatty acid present in the human diet and usually adopted as nutritional supplementation, can exert antiproliferative effects, it has not yet been investigated in early stages of prostate proliferative disorders, such as benign hyperplasia.
The treatment adopted in most cases of androgen-dependent PCa is androgen ablation, which can lead to selective advantage to androgen-independent cancer cells that eventually proliferate and promote the recurrence of a more aggressive phenotype [22]. Administration of compounds that affect sexual steroid pathways also have been a strategy in prevention and treatment of PCa, but the mechanisms triggered are still not fully elucidated and their safety is uncertain [23]. In this context, one of the avenues to decrease the high mortality rate caused by PCa [24] may be the chemoprevention focused on the suppression of growth or survival of abnormal cells at early stages. Therefore, our aim was to test, in vitro, the antiproliferative potential of MLT and DHA, combined or not, in early stages of prostate proliferative disorders. For this purpose, the proliferation of PNT1A cells, an epithelial benign prostate line sensitive to androgen, and the correlations to ROS production, mitochondrial bioenergetics, and proliferative signaling pathways were evaluated.
2. Material and Methods
2.1. Cell Culture and Treatments
PNT1A cells (#95012614—Health Protection Agency, England, UK) were seeded in RPMI 1640 medium (#R6504—Sigma-Aldrich, St. Louis, Missouri, EUA) enriched with 10% fetal bovine serum (#S0011—Vitrocell, Campinas, São Paulo, Brazil), 1% of penicillin, streptomycin, and amphotericin B (#15240062—Life Technologies, Paisley, UK) and incubated in a wet incubator with 5% of CO2 at 37°C. For cell maintenance, the medium was replaced every 2–3 days and subculture was done when 70–85% confluence was reached. For the experiments, the cells were incubated at the desired density and were allowed to attach during 24 hours.
DHA (#D2534—Sigma-Aldrich, St. Louis, Missouri, EUA) concentrations (10 μM, 20 μM, 50 μM, and 100 μM) were freshly prepared in RPMI 1640 culture medium from a stock solution of 20 mM DHA in anhydrous ethanol (vehicle), and the effects on cell proliferation at 24 h, 48 h, and 72 h were tested. These concentrations were chosen according to previous experiments with normal epithelial prostatic cells RWPE-1 [25]. DHA concentration and time of incubation that first exerted antiproliferative effects, combined to higher lipid accumulation, were chosen to perform all forward assays.
Because there are several studies reporting major pathways triggered by MLT (#M5250—Sigma-Aldrich, St. Louis, Missouri, EUA) in different concentrations [26, 27], we first evaluated physiologic (pM–nM), supraphysiologic (nM–μM), and pharmacologic (μM–mM) ranges on cell proliferation. Then, the effects of 1 pM, 1 nM, 1 μM, and 1 mM of MLT were tested alone or in coincubation with DHA. These MLT concentrations in the medium were freshly prepared from a stock solution at 100 mM in anhydrous ethanol (vehicle), and the first that exerted antiproliferative effects, alone and combined to DHA, were chosen for forward assays. For coincubation assays, DHA and MLT at the desired concentration were added to the medium at the same time. Proliferation assay with luzindole (#15998—Cayman Chemical, MI, USA), a nonselective antagonist of MTR1 and MTR2 membrane receptors, 100-fold higher than the MLT work concentration, was performed in control (vehicle incubation only), melatonin (MLT), DHA, and coincubation (DM) to determine the pathways of hormone action.
To ensure that the mechanisms observed were not due to vehicle, all control assays were incubated with anhydrous ethanol at the same volume of DHA, MLT, or DM added to the cells. Also, the concentration of vehicle in the medium never exceeded 0.5% which did not exert alteration on cell proliferation (data not shown).
2.2. Cell Proliferation Assay
The effects of treatments were evaluated after incubation of 1 × 10⁴ cells/well with commercial colorimetric kit CellTiter 96® AQueous One Solution Cell Proliferation Assay (#G3580—Promega Corporation, Madison, WI, USA), according to the manufacturer's instructions. Absorbance was determined at 490 nm in an Epoch microplate reader (BioTek Instruments Inc., Winooski, VT, EUA). Three independent experiments in triplicate were performed for statistical analysis.
2.3. Lipid Accumulation
Qualitative evaluation of lipid uptake was assessed by light microscopic analysis after incubation with Oil Red O (#O0625—Sigma-Aldrich, St. Louis, Missouri, EUA). Cells were seeded at 1 × 10⁴ cells/well followed by incubation with DHA (10 μM, 20 μM, 50 μM, and 100 μM) or vehicle (control). After incubation, the medium was removed, and the cells were washed with PBS and fixed with paraformaldehyde 4% for 10 minutes. Then, cells were immersed in isopropanol 60% for 5 minutes at room temperature (RT) followed by incubation for 60 minutes with fresh Oil Red O prepared at 0.03% in isopropanol. After two independent experiments performed in duplicate, the most representative profile of lipid accumulation was considered for each DHA concentration.
Quantitative evaluation of intracellular lipids was assessed after incubation (5 × 10⁴ cells/well) with 5 μM of BODIPY™ Lipid Probes 493/503 (#D3922—Molecular Probes®, Invitrogen) prepared in serum-free medium for 5 minutes at RT, according to the manufacturer's instructions. Immediately, images were captured with an inverted fluorescence microscope (Axio Vert.A1 Carl Zeiss AG, DE) with the same time of exposure (280 ms). Quantification of total fluorescence intensity was assessed with ImageJ software, and at least four hundred cells per treatment from three consecutive passages were considered.
2.4. ROS Determination
Hydrogen peroxide (H2O2) production was determined after incubation of 106 cells/mL in PBS/Mg+2, 5 mM of succinate, 1 U/mL of HRP, and 25 μM of Amplex Red (Molecular Probes®, Thermo Fisher Inc.). Fluorescence intensity was assessed at 563 nm excitation and 587 nm emission, using a Cytation 3 Cell Imaging Multi-Mode Reader (BioTek Instruments Inc., Winooski, VT, EUA). Cell H2O2 production was correlated to fluorescence intensity and calculated as described previously [28]. Three independent experiments in triplicate were considered for statistical analysis.
Superoxide anion production (O2●−) was assessed after incubation with MitoSOX® Red dye (#M36008—Molecular Probes, Thermo Fisher Inc.), according to the manufacturer's instructions. After treatments, the medium was removed, and the cells (5 × 10⁴/well) were washed twice with KH buffer (NaCl 120 mM, NaHCO3 15 mM, KCl 5 mM, NaH2PO4 1.5 mM, and Na2HPO4 0.7 mM) and incubated with the dye at 3 μM for 15 minutes at 37°C in an incubator with 5% CO2. Then, cells were washed twice with KH buffer to remove the dye that did not enter the mitochondria. A total of fifteen images from wells containing cells of consecutive passages were captured at the same exposure time (1200 ms) with an inverted fluorescence microscope (Axio Vert.A1 Carl Zeiss AG, DE). Total field fluorescence intensity was measured with ImageJ software and normalized with the number of cells per field. At least 250 cells were counted in each treatment.
2.5. Morphometric Analysis of Mitochondria
Cells were seeded at a density 5 × 10⁴ cells/well in a CELLview bottom glass (Greiner Bio-One) and, after treatments, incubated with MitoTracker Orange CMTMRos (#M7510 Molecular Probes, Invitrogen) at 50 nM in a serum-free medium at 37°C and 5% CO2, according to the manufacturer's instructions. After 15 minutes, media were replaced and live cells were immediately analyzed with an inverted fluorescence microscope (Axio Observer Z1 Carl Zeiss AG, DE). Morphometric evaluation of mitochondria was done with a macro created for ImageJ software by Dagda and colleagues [29]. This tool was previously validated [29] and allows measuring mitochondria stained with the specific fluorescent dye and determining the area and perimeter of the organelle. Measurements were performed in at least fifteen images captured with 40x objective. Fluorescent regions of each image were measured followed by normalization of number of cells per field. At least 100 cells were considered for statistical analysis.
2.6. Mitochondrial Membrane Potential Determination
After incubations, cells were centrifuged at 2000 rpm for 5 minutes at 4°C, then the pellets were washed and resuspended in PBS. Respiration buffer (sucrose 125 mM, KCl 65 mM, HEPES 10 mM pH 7.2, MgCl2 1 mM, KH2PO4 2 mM, EGTA 0.5 mM, and BSA 0.15%), 106 cells/mL, succinate 5 mM, safranin O 5 μM, and digitonin 20 μM were added to a cuvette, as described by Holden and Sze [30] (concentrations of cells, succinate, safranin O, and digitonin were adapted for increased effectiveness without damaging the integrity of the mitochondria). For analysis, ADP 50 μM, oligomycin 1 μg/mL (OLG), and antimycin A 1 μg/mL (AA) were added to the incubation medium. Values were recorded in a fluorescence spectrophotometer (F-2500 Hitachi) with 495 nm and 589 nm excitation and emission, respectively. The most representative profile of mitochondrial membrane potential of three independent experiments performed in duplicate was plotted and values shown in arbitrary fluorescence units.
2.7. Oxygen Consumption Rate
Oxygen consumption rate (OCR) was assessed in a Hansatech Oxygraph (Yellow Springs Corporation) as described by Silva and colleagues [31]. Basal state (S2) was determined after incubation of 106 cells/mL in respiration buffer (sucrose 125 mM, KCl 65 mM, HEPES 10 mM pH 7.2, MgCl2 1 mM, KH2PO4 2 mM, EGTA 0.5 mM, and BSA 0.15%) in the presence of digitonin at 20 μM and succinate 5 mM. State 3 (S3) was determined by OCR and assessed after the addition of 50 μM ADP and state 4 (S4) with oligomycin 1 μg/mL. Respiratory control (RC) was calculated as RC = (state 3 OCR/state 4 OCR) and indicates the oxidative phosphorylation rate. ETC maximum velocity (S3U) was determined by OCR and assessed after the addition of mitochondrial uncoupler carbonyl cyanide m-chlorophenyl hydrazone (CCCP) at 1 μM. Mitochondrial bioenergetic reserve capacity was calculated as MBRC = (S3U − S2), as described by Vayalil and Landar [32], considering nonmitochondrial oxygen consumption. At least three experiments in triplicate were considered for statistical analysis.
2.8. Testosterone Level in the Medium
After incubations, the medium was removed from the wells and testosterone levels were measured with ELISA assay from an AccuBind Testosterone System Microwells (#3725300—Monobind Inc., Lake Forest, CA, USA) commercial kit, according to the manufacturer's instructions. Concentrations of testosterone (ng/mL) were normalized by protein amount in the cell lysate from the correspondent well. Three independent experiments were performed in triplicate for statistical analysis.
2.9. Western Blotting
After incubations, cells (5 × 10⁴/well) were lysed in RIPA buffer in the presence of 10% protease inhibitor cocktail, sodium orthovanadate (1 : 100), and PMSF (1 : 1000). All reagents were obtained from Sigma-Aldrich (St. Louis, Missouri, EUA). Protein quantification was performed in an Epoch microplate reader coupled to Take3 Micro-Volume (BioTek Instruments Inc., Winooski, VT, EUA) at 280 nm. After electrophoresis in SDS-PAGE, proteins (50 or 100 μg/μL) were transferred to the nitrocellulose membrane for 1 hour and 40 minutes in a semidry system. Nonspecific bindings were blocked with BSA 5% in TBST for 1 h (phosphorylated proteins) or nonfat milk at 5% in TBST for 30 minutes (for nonphosphorylated proteins), at RT in a shaker. Primary antibodies anti-phospho-mTOR (rabbit monoclonal, Santa Cruz Biotechnology, 1 : 400), anti-phospho-AKT (rabbit polyclonal, Santa Cruz Biotechnology, 1 : 400), anti-phospho-ERK1/2 (rabbit polyclonal, Cell Signaling, 1 : 1000), anti-GSTP1 (rabbit polyclonal, Cell Signaling, 1 : 1000), and anti-β-actin (mouse monoclonal, Santa Cruz Biotechnology, 1 : 1000) were incubated overnight at 4°C. Secondary antibodies were prepared at 10x dilution of the respective primary antibody and incubated at 4°C for 1 h. The ECL system was applied for band visualization and image capture. All incubations were analyzed in triplicate (n = 3) in the same gel, and one protein per gel in addition to β-actin for loading control was quantified. Relative densitometry was assessed using ImageJ software.
2.10. Statistical Analyses
Statistical analyses were performed with GraphPad Prism® software (GraphPad Prism software, v.5.0). First, distribution of samples was analyzed with Kolmogorov-Smirnov and Shapiro-Wilk normality tests. Parametric distributions were submitted to T test or one-way ANOVA followed by Tukey test (post hoc); nonparametric distributions to Mann-Whitney or Kruskal-Wallis test followed by Dunn test (post hoc). p < 0.05 was considered statistically different.
3. Results
3.1. Pro- or Antimitogenic Actions of DHA in PNT1A Cells Are Time- and Concentration-Dependent
All DHA concentrations tested within 24 h, except 10 μM, increased the proliferation of PNT1A cells. Stimulation of the clonogenic rate at 48 h was only observed with 20 and 50 μM as well as 10 and 20 μM at 72 h (Figure 1(a)). At 100 μM, the highest concentration tested, cell proliferation (Figure 1(a)) reduced only after 48 h (control: 0.41 ± 0.01; DHA 0.34 ± 0.01 abs) and 72 h (control: 0.36 ± 0.01; DHA: 0.20 ± 0.01 abs). DHA also stimulated lipid accumulation in a dose- and time-dependent pattern, as represented in Figure 1(b) for 48 h incubation. Therefore, 100 μM of DHA at 48 h was selected to perform all forward assays.
Figure 1.

DHA and MLT antiproliferative effect. (a) PNT1A cell proliferation incubated with 10, 20, 50, and 100 μM of DHA after 24, 48, and 72 h. Legend of panel (a): C: control (vehicle incubation). Statistical analysis of panel (a): (A) different from C; (B) different from 10 μM; (C) different from 20 μM; (D) different from 50 μM. (b) Lipid droplets (arrow) stained (red) with Oil Red O (bottom row) after incubation with vehicle (C) or DHA at 10, 20, 50, and 100 μM for 48 h. Images captured with 40x objective. For qualitative analysis, two independent experiments were performed in duplicate, and the most representative lipid accumulation for each DHA concentration is shown. (c) PNT1A cell proliferation incubated with 1 pM, 1 nM, 1 μM, and 1 mM of MLT after 48 h. Legend of panel (c): C: control (vehicle incubation); MLT: melatonin incubation; DM: coincubation with 100 μM of DHA and melatonin. Statistical analysis of panel (c): (A) different from C; (B) different from MLT considering same concentration range; (C) different from MLT-1 pM; (D) different from MLT-1 nM; (E) different from MLT-1 μM; (G) different from DM-1 pM; (H) different from DM-1 nM; (I) different from DM-1 μM; p < 0.05 was determined as statistically different. All proliferation assays were performed in triplicate, and three independent events considered for statistical analysis. Values show the mean of absorbance and SEM.
3.2. MLT Decreased PNT1A Cell Proliferation
MLT at physiological concentrations (1 pM and 1 nM) had no effect on cell proliferation (Figure 1(c)) but decreased at 1 μM (control: 0.87 ± 0.02; MLT 0.74 ± 0.02 abs) and 1 mM (control: 0.81 ± 0.02; MLT: 0.50 ± 0.005 abs). At 1 μM, MLT exerted the most antiproliferative effect in comparison to all concentrations analyzed (Figure 1(c)). We chose MLT at the concentration of 1 μM because it was the first to exert an antiproliferative effect. Also, our aim was to evaluate the MLT effects, regardless of membrane receptor activation, which occurs mainly in the pM–nM range.
3.3. MLT Improved Antiproliferative Effect When Combined to DHA
MLT coincubated with DHA 100 μM for 48 h roughly decreased cell proliferation (Figure 1(c)) at 1 μM (control: 0.87 ± 0.02; DM: 0.58 ± 0.02 abs) and 1 mM (control: 0.81 ± 0.02; DM: 0.29 ± 0.01 abs). Coincubation with MLT at 1 mM exhibited the most antiproliferative effect, decreasing by 50% the cell proliferation rate compared to DM at 1 μM (Figure 1(c)).
3.4. DHA Alone or Coincubated with MLT Increased Lipid Intracellular Amount
Incubation with DHA alone (100 μM) increased by 62% lipid accumulation in PNT1A cells after 48 h and, when coincubated with MLT 1 μM, raised to 82% (control: 3.97 ± 0.19, DHA: 6.66 ± 0.14, and DM: 7.34 ± 0.16 FI/cell × 105). MLT alone did not affect intracellular lipid storage (Figure 2).
Figure 2.

Lipid accumulation. (a) Detection of lipids (green) in PNT1A cells with BODIPY. Cells were incubated with 100 μM of DHA and 1 μM of MLT for 48 h before the dye. Images of left column were captured with 10x objective and right column (insets) with 40x. (b) Lipid storage quantification. C: control (vehicle incubation); DHA: incubation with 100 μM of DHA for 48 h; MLT: incubation with 1 μM of melatonin for 48 h; DM: coincubation with 100 μM of DHA and 1 μM of melatonin for 48 h. Statistical analysis: (A) different from C; (B) different from DHA; (C) different from MLT. p < 0.05 was considered statistically different. At least four hundred cells per treatment from three consecutive passages were analyzed. Values show the mean of fluorescent units per cell and SEM.
3.5. DHA Increased Superoxide Anion Production and MLT Alleviated ROS Generation
DHA did not alter H2O2 production by PNT1A cells when compared to control (Figure 3(a)). MLT reduced 62% of total H2O2 production, but when coincubated with DHA, H2O2 generation increased compared to control, as shown in Figure 3(a) (control: 0.098 ± 0.007, MLT: 0.037 ± 0.008, and DM: 0.144 ± 0.009 pmol/min/106 cells).
Figure 3.

ROS determination. Production of (a) hydrogen peroxide (H2O2)—values show pmol of H2O2/min/106 cells and SEM; production of (b) superoxide anion (O2●−)—values show the fluorescence intensity (FI) per cell × 104. Legend of panels (a) and (b): C: control (vehicle incubation); DHA: incubation with 100 μM of DHA for 48 h; MLT: incubation with 1 μM of melatonin for 48 h; DM: coincubation with 100 μM of DHA and 1 μM of melatonin for 48 h. Statistical analysis: (A) different from C; (B) different from DHA; (C) different from MLT. p < 0.05 was considered statistically different. Three independent experiments in triplicate were considered for statistical analysis of H2O2 production and at least 250 cells for O2●−. (c) Detection of O2●− production after MitoSOX incubation. Images captured with 40x objective with an inverted fluorescence microscope.
DHA doubled whereas MLT alone reduced 40% of superoxide anion production (Figures 3(b) and 3(c)) by PNT1A cells when compared to control. Coincubation attenuated such ROS production compared to DHA alone, but did not normalize to control (control: 7.91 ± 0.73, DHA: 16.78 ± 1.30, MLT: 4.75 ± 0.39, and DM: 12.26 ± 0.65 FI/cell × 104).
3.6. MLT Improved Oxidative Phosphorylation and Alleviated Mitochondrial Damage Caused by DHA
None of the incubations altered basal OCR in PNT1A cells (S2—Figure 4(a)). Respiratory control (Figure 4(b)) was increased by MLT alone or coincubated whereas DHA did not promote any change on OCR when compared to control (control: 3.13 ± 0.08, MLT: 4.89 ± 0.23, and DM: 3.71 ± 0.13). Mitochondrial bioenergetic reserve capacity (MBRC) of PNT1A cells (Figure 4(d)) was unaffected by MLT alone, decreased 2-fold after incubation only with DHA, and raised roughly by 130% in DM compared to control (control: 2.90 ± 0.27, DHA: 1.59 ± 0.11, and DM: 3.77 ± 0.07 nmol O2/106 cells/min). MLT alone decreased both mitochondrial area and perimeter, and DHA alone increased as well as coincubation when compared to control (area—control: 122.1 ± 5.79, DHA: 147.1 ± 5.33, MLT: 89.55 ± 4.05, and DM: 146.3 ± 8.04 μm2/perimeter—control: 8.02 ± 0.28, DHA: 10.03 ± 0.21, MLT: 6.23 ± 0.23, and DM: 9.47 ± 0.48 μm), as shown in Figures 5(a)–5(c).
Figure 4.

Oxygen consumption rate of PNT1A cells after incubations. (a) Basal state (S2), (b) respiratory control ratio (OCR), (c) maximum velocity of respiratory chain (S3U), and (d) mitochondrial bioenergetic reserve capacity (MBRC). Values show the mean of nmol of O2/106 cells/min and SEM. C: control (vehicle incubation); DHA: incubation with 100 μM of DHA for 48 h; MLT: incubation with 1 μM of melatonin for 48 h; DM: coincubation with 100 μM of DHA and 1 μM of melatonin for 48 h. Statistical analysis: (A) different from C; (B) different from DHA; (C) different from MLT. p < 0.05 was considered statistically different. Three independent experiments were performed in triplicate for statistical analysis.
Figure 5.

Morphometric analysis of mitochondria. (a) Mitochondria labeling with MitoTracker, (b) area (μm2), (c) perimeter (μm), and (d) mitochondrial membrane potential assessed with Safranin O. Images captured with 40x objective with an inverted fluorescence microscope for morphological analysis. Legend: C: control (vehicle incubation); DHA: incubation with 100 μM of DHA for 48 h; MLT: incubation with 1 μM of melatonin for 48 h; DM: coincubation with 100 μM of DHA and 1 μM of melatonin for 48 h; ADP: adenosine diphosphate; OLG: oligomycin; AA: antimycin A. At least 100 cells from consecutive passages were considered for statistical analysis. Values show the mean and SEM. Statistical analysis: (A) different from C; (B) different from DHA; (C) different from MLT. p < 0.05 was considered statistically different.
3.7. MLT and DHA Modulated the Survivor and Cell Proliferation-Related Pathways Regardless of MTR1 or MTR2 Sensitization
Luzindole did not change cell proliferation (Figure 6(f)) in control or MLT, but was reduced when incubated with DHA (control: 0.65 ± 0.02; DHA: 0.48 ± 0.02 abs) and DM (control: 0.51 ± 0.03; DM: 0.35 ± 0.02 abs) compared to incubations without the antagonist.
Figure 6.

Signaling pathways. (a) AKT, (b) mTOR, and (c) ERK1/2 activation. (d) GSTP1 and (e) AR expression. Legend of panels (a)–(e): C: control (vehicle incubation); DHA: incubation with 100 μM of DHA for 48 h; MLT: incubation with 1 μM of melatonin for 48 h; DM: coincubation with 100 μM of DHA and 1 μM of melatonin for 48 h. Values show the mean of relative density and SEM from three different samples normalized to β-actin. For each blotting, the samples run in the same electrophoresis, and except for AR, the bands were cropped, for group standard purposes. Statistical analysis of panels (a)–(e): (A) different from C; (B) different from DHA; (C) different from MLT. (f) Cell proliferation rate after incubation with luzindole. Values show the mean of absorbance and SEM. Legend of panel (f): LZ: luzindole. Statistical analysis of panel (f): ∗ different from incubation without luzindole. p < 0.05 was considered statistically different. Three independent experiments were performed in triplicate (n = 9) for statistical analysis.
DHA and MLT alone suppressed AKT phosphorylation (Figure 6(a)) when compared to control, as well as coincubation, which did not show a synergistic effect (control: 2.17 ± 0.12, DHA: 1.33 ± 0.18, MLT: 1.31 ± 0.03, and DM: 1.51 ± 0.15). MLT alone also inhibited mTOR activation (Figure 6(b)) compared to control, whereas DHA alone or in coincubation did not change (control: 0.150 ± 0.015; MLT: 0.082 ± 0.003). On the other hand, MLT alone increased ERK1/2 phosphorylation (Figure 6(c)) compared to control and coincubation with DHA amplified this effect (control: 0.045 ± 0.005, MLT: 0.125 ± 0.009, and DM: 0.223 ± 0.021). GSTP1 expression (Figure 6(d)) did not change in isolated incubations, but together, MLT and DHA increased 20% compared to MLT alone (MLT: 1.69 ± 0.10; DM: 2.34 ± 0.17).
3.8. MLT May Influence the Androgen Pathway
Testosterone levels in culture medium (Figure 7) decreased by 25% after MLT incubation compared to control and 20% when coincubated with DHA, whereas no alteration was observed for DHA alone (control: 11.20 ± 0.15, MLT: 8.60 ± 0.64, DM: 9.18 ± 0.43 ng/mL × 10−5). AR expression did not change among any incubation (Figure 6(e)).
Figure 7.
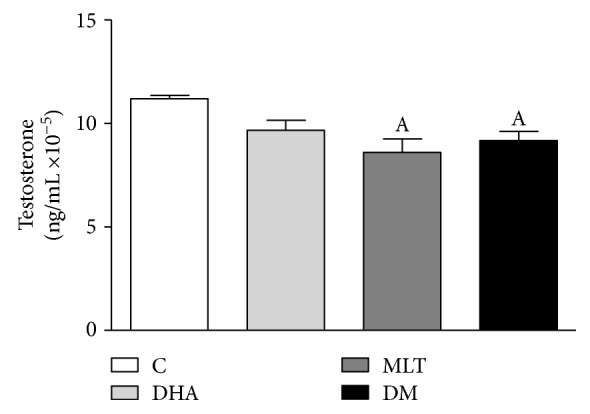
Testosterone level in the medium. After incubations, the medium was removed and testosterone level assessed by ELISA assay. Values show mean of ng of testosterone/mL ×10−5 normalized by protein amount from cell lysate and SEM. Legend: C: control (vehicle incubation); DHA: incubation with 100 μM of DHA for 48 h; MLT: incubation with 1 μM of melatonin for 48 h; DM: coincubation with 100 μM of DHA and 1 μM of melatonin for 48 h. Statistical analysis: (A) different from C. p < 0.05 was considered statistically different. Three independent experiments were performed in triplicate for statistical analysis.
4. Discussion
Considering that the available strategies against PCa are still highly inefficient and may lead to the recurrence of more aggressive phenotypes [22, 23], we investigated, in vitro, the potential of DHA and MLT to decrease cell survival at early stages of proliferative disorders. PNT1A cells were chosen due to their normal secretory phenotype but also nonmalignant alterations, allowing study growth and survival of high proliferative prostate cells which are sensitive to androgen, as described in early stages of prostate cancer progression and BHP [33]. Furthermore, this cell line retains AR expression, whose activity is closely related to cell metabolism, and the loss thereof affects mitochondria yields and dynamics among PCa progression. Due to their antiproliferative properties, DHA and MLT have been investigated as PCa suppressors in experimental studies [11, 18], but their combined action in benign prostate cells has not yet been evaluated. In this study, we observed that ROS generation and mitochondrial function play a pivotal role in determination of PNT1A cell proliferation. On the one hand, DHA had an anticlonogenic effect at the highest concentration tested (100 μM) after 48 h of incubation, mainly due to the increase in ROS production, probably related to mitochondrial function impairment and AKT inactivation. On the other hand, MLT, at the pharmacologic range, improved oxidative phosphorylation and decreased ROS production, but reduced cell proliferation due to inhibition of survival pathways. Moreover, MLT improved the DHA antiproliferative effect in PNT1A cells.
4.1. Benign Epithelial Prostatic Cells Respond Differently to DHA than Tumor Cells
DHA has been described to have antimitotic and proapoptotic effects on malignant prostate cell lines using different concentrations [18, 34, 35]. However, in this study DHA had a hormetic behavior on nontumor PNT1A cells, since an inhibitory effect on proliferation was detected at a higher concentration (100 μM) for longer exposures (48 and 72 h), whereas a proliferative stimulus was triggered at lower concentrations (20 and 50 μM). Despite not being the aim of our study, it is worth mentioning that the results from our laboratory (not shown) with DHA 50 μM for 48 h suggest that such an increase in cell proliferation may be related to deregulation of peroxisome proliferator-activated receptor gamma (PPARγ), which is still under investigation. Regarding DHA at 100 μM for 48 h, it is possible to suggest two key factors in cytotoxic effect: the increase in ROS production and the inactivation of AKT (Figure 8(a)). Interestingly, previous studies demonstrated that 50 μM of DHA led to death of PC3 and DU145 cells [18] whereas in our study this concentration stimulated PNT1A to proliferate and cytotoxic effects were observed solely at 100 μM. In PCa, oxidative stress is increased and it is possible that incubation with DHA enhanced cellular damage, activating cell death even at lower concentrations. Furthermore, this susceptibility may also rely on metabolic changes among malignant transformations known as the Warburg effect [36]. Regarding PCa, these changes may be related to several mechanisms [37], as increased β-oxidation [38], higher amounts of mitochondria and lower complex I activity [4], mutations in ETC complexes [5], and alterations in mitochondria dynamics [39] which may be related to different responses between benign and prostate tumor cells.
Figure 8.

Proposed mechanism. (a) DHA increased ROS production, mainly O2●−, leading to oxidative damage that may trigger mitochondrial fusion as tentative to restoration of organelle function. Also, such fatty acid increased lipid accumulation which may increase ROS. In this context, we hypothesize that DHA raised oxidative stress, therefore impairing mitochondrial function, which then stimulated organelle fusion and led to area and perimeter increase as well as the recovery of OXPHOS, but not MBRC. In addition, DHA also inhibited AKT activation which may be related to increase in oxidative damage and decrease in cell proliferation. (b) MLT decreased ROS production, both O2●− and H2O2, and improved OXPHOS which may be associated to AKT/mTOR inactivation. (c) DHA increased oxidative damage which was not neutralized by MLT, but together (DM) amplified the antiproliferative effect probably due to AKT and ERK1/2 regulation. MLT, alone or coincubated, stimulated ERK1/2 activation as well as androgen uptake, but the mechanism is not clear. Also, MLT coincubated with DHA-stimulated GSTP1 expression probably due to ROS increase. Legend: DHA: docosahexaenoic acid; MLT: melatonin; DM: coincubation; O2●−: superoxide anion production; H2O2: hydrogen peroxide; ATP: adenosine triphosphate; OXPHOS: oxidative phosphorylation; MBRC: mitochondrial bioenergetics reserve capacity; ROS: reactive oxygen species. Dashed lines, mechanism proposed based on the literature; solid lines, effects and correlations based on observed results.
4.2. DHA Raised ROS Production and Mitochondrial Rearrangement
To the best of our knowledge, this is the first evidence that DHA increases ROS generation and decreases cell proliferation in PNT1A benign prostate cells. Such effects were probably associated to higher O2●− production, which is related to the increase in mitochondrial membrane potential (Figure 5(d)) [40]. It is currently known that higher oxidative stress levels commonly exhibit impairment of mitochondrial activity [41]. In response to oxidative damage or metabolic changes, mitochondrial fusion may be triggered as tentative to restoration of organelle function [42]. In this context, we hypothesize that DHA raised oxidative stress, therefore impairing mitochondrial function, which then stimulated organelle fusion and led to area and perimeter increase as well as the recovery of oxidative phosphorylation (OXPHOS). Mitochondrial morphology alterations described here are in line with previous reports, since DHA upregulated the protein related to mitochondrial fusion MFN2 [43]. It is worth mentioning that despite that OXPHOS was unchanged after 48 h of incubation, mitochondrial integrity probably remained damaged because DHA strongly impaired MBRC, an index of cell potential to respond upon stress conditions, which is decreased under oxidative stress [44]. In this context, in vitro studies from our research group found that half of DHA concentrations used here remarkably decreased the viability of the testis cell population in fetal mice and, when combined to 2-monoethylhexyl phthalate (MEHP), strongly impaired the survival of male germ cells (gonocytes). Therefore, the data highlights the ability of DHA to induce cell sensitization to other cytotoxic compounds (data not published).
4.3. Decrease in ROS Production by MLT Alone Is Associated to Lower Cell Proliferation Rates
Because oxidative stress apparently is a key factor for cell survival [18], we evaluated the antioxidant potential of MLT. MLT is an expected antioxidant agent which can scavenge free radicals directly or by its metabolites [45], upregulate the expression and activity of antioxidant enzymes, such as superoxide dismutase, glutathione peroxidase, and catalase [46], or modulate mitochondrial activity [6, 47]. In the present study, our aim was to validate on PNT1A cells the MLT antioxidant action and not the mechanisms per se. Indeed, MLT was able to decrease H2O2 and O2●− production, combined or not to DHA. Our data are in line with previous literature, since it was reported that MLT, at the same concentration, decreased ROS in isolated mitochondria from the liver [10]. Such an effect on oxidative stress attenuation may be associated to the attenuation of proton leak in mitochondria [48] or even decrease in mitochondrial membrane potential, a well-known contributor to O2●− production in vitro and in vivo [40]. Levels of ROS production are closely related to OXPHOS [6], and decrease in H2O2 and O2●− described may be related to improvement of the respiratory control ratio. It is worth mentioning that complex II-supported respiration was chosen based on the fact that such complex is invariable among cancer cells [49] and it is an important site for ROS generation, while it also contributes to ROS either directly or indirectly via reverse electron transfer [50]. To our knowledge, this is the first report to show antioxidant properties of MLT in PNT1A cells associated to improvement of the mitochondrial physiology. Because the increase in ROS generation had been related to expansion of mitochondrial area and perimeter, we investigated if the decreased production of reactive species associated to OXPHOS improvement also affected organelle morphology. Thus, it was possible to observe that mitochondrial function enhancement was followed by decrease in organelle area and perimeter. The findings herein suggest a quality control system that removes fractions or the entirety of mitochondria with higher ROS generation which may be harmful to organelle homeostasis. On the other hand, we cannot discard that MLT effects on mitochondria physiology may be a consequence of first changes in organelle dynamics, as well as contribution of antioxidant system enzyme modulation. Therefore, the present study highlights new possibilities of MLT's role as a regulator of mitochondrial function in prostatic epithelial cells.
The results observed here regarding proliferation of PNT1A cells were different from the previous results [51], since it was reported that MLT at 500 μM or 10 mM did not affect cell proliferation. Such differences may be due to conditions of incubation but also to higher cell density seeded (104 cells/well) than what Gobbo and colleagues [51] performed (3 × 10³ cells/well), which may be more suitable to clarify the differences between proliferation rates among incubations. In the present study, OXPHOS improvement and decrease in ROS production by MLT was probably associated to AKT inactivation and decrease in cell proliferation. Our data may suggest an association with ATP, since its increase may be associated to cell death [52]. MLT's property of modulating ATP levels was reported at different concentrations and systems due to several mechanisms, such as a raise in ADP/O ratio and upregulation of β subunit of ATP synthase [7–10]. Despite not being assessed, it is suggested that OXPHOS improvement may be related to increase in ATP levels in the cells. This hypothesis is in line with previous literature, since MLT in the liver and brain tissue, even at lower concentrations (100 nM), was able to improve OXPHOS through stimulation of complexes I and IV and protection of these enzymes against oxidative damage, which was closely related to increase in ATP production [7]. In this context, the increase in ATP levels may suppress the AKT pathway [53] and decrease survival, as observed here and reported in breast cancer cells after administration of extracellular ATP to the medium [54]. Therefore, this hormone decreased cell proliferation probably due to the decrease in ROS production that affected pathways of mitosis stimulation and cell survivor. PCa progression is related to the rise in oxidative stress and, together with our data, point to mitochondrial bioenergetics' role on cell arrest and suggest that MLT is effective as antiproliferative agent acting in this pathway (Figure 8(b)).
4.4. MLT Antioxidant Ability Apparently Is More Efficient at the Mitochondrial Compartment
Higher lipid accumulation probably was related to increased amounts of DHA. Such omega-3 is metabolized primarily at the peroxisome fraction, a well-known site of H2O2 generation, due to long-chain fatty acid structure [19]. Regarding coincubation, H2O2 production was increased and MLT was not able to decrease it. Therefore, the antioxidant effects of MLT in the presence of DHA were mainly at the mitochondrial compartment since, despite not recovering to control levels, such hormone decreased O2●− levels possibly related to OXPHOS improvement in DM. In addition, such decrease may attenuate mitochondrial oxidative damage, which can be related to the enhancement of MBRC observed in coincubation.
4.5. DHA and MLT Downregulate Cell Proliferation and Survival Pathways
In PC3 and DU145 lines, DHA led to AKT/mTOR suppression [18], whereas in PNT1A only the activation of AKT decreased. This evidence may suggest a different action of such omega-3 when distinct stages of proliferative disorders are considered. Concerning MLT alone, it suppressed the AKT/mTOR pathway, which is closely related to decrease in cell proliferation. However, when coincubated to DHA, MLT enhances the decrease in proliferation by activating ERK1/2. Despite being generally associated to proliferation stimulus, activation of ERK1/2 may also lead to cell death mainly under stress conditions [55]. In PC3 cells, the increase in oxidative stress reduced AKT activation, followed by increased phosphorylation of ERK and cell proliferation arrest [56], similar to what was observed in PNT1A in our study after coincubation. Despite the fact that DHA alone did not stimulate ERK1/2 activation, even under high ROS production, in our in vitro model, this evidence highlights that MLT could play a key role in the modulation of such pathway. In addition, we also suggest that MLT combined to increased oxidative stress, the ERK1/2 pathway is strongly activated and therefore controls cell survival, as reported previously [57]. It is worth mentioning that higher levels of ERK activation may also be related to GSTP1 upregulation [58].
Because androgen regulation is important for the survival of prostate cells and PCa development, we analyzed if incubation effects were related to the alteration in this pathway. In the present incubations, DHA did not change testosterone levels in medium or AR expression, which supports the hypothesis that the antimitotic property of this omega-3 in PNT1A cells was mainly due to alterations on oxidative status. AR expression was also unchanged after MLT exposure, regardless of DHA incubation. However, MLT influenced the androgen levels in the medium, but due to methodologic limitations, it is not clear if the release of testosterone or its uptake was affected by MLT. Furthermore, Estrada and colleagues [59] demonstrated that in the presence of androgen, ERK activation was increased and followed by cell proliferation decrease. Therefore, our study suggests that MLT may improve antiproliferative effects due to an association between mitochondrial bioenergetics, androgen pathway, and ERK pathway, even in nontumor cells (Figure 8(c)), although additional studies are needed to better understand this issue.
Finally, we proved that PNT1A proliferation, when incubated with MLT, was independent of MTR1 and MTR2 activation, both expressed in the prostate gland [60]. This demonstrates that MLT uptake by PNT1A cells, already reported previously [26], activated pathways regardless of membrane receptors and had a key role in mitochondrial activity modulation and oxidative stress control.
5. Conclusion
Our data indicates that PNT1A cells are less sensitive to DHA than advanced cancer cell lines; however, at 100 μM this omega-3 reduced the proliferation rate due to the increase in ROS production at cytotoxic levels and possibly associated to the inhibition of AKT activation. It is important to emphasize DHA hormetic behavior in PNT1A cells, because at lower concentrations it stimulated cell proliferation. This finding highlights the need for further studies, concerning dietary supplementation with this PUFA, mainly in men at risk of PCa development. Furthermore, MLT at 1 μM increased OXPHOS, decreased ROS production, and exerted an antimitogenic effect via AKT inactivation and ERK1/2 activation regardless of binding in MTR1 or MTR2. Moreover, MLT improved in vitro DHA antiproliferative effect, which may open new possibilities of chemopreventive strategies, mainly at early stages of prostate proliferative disorders.
Acknowledgments
The authors are grateful to Dr. Nishtman Dizeyi (Lund University, Malmo, Sweden) for kindly providing the PNT1A cells and for the collaboration of Dr. Hernandes Faustino Carvalho (Institute of Biology, State University of Campinas, São Paulo, Brazil) and Dr. Marilia de Freitas Calmon Saiki (Institute of Biosciences, Humanities and Exact Sciences, São Paulo State University, São José do Rio Preto, São Paulo, Brazil) in cell culture. Financial support was provided by São Paulo Research Foundation (FAPESP) and the National Research Council (CNPq). The authors have received fellowships as follows: Dr. Rejane Maira Góes (Grant number 308367/2014-6 — CNPq; 2013/16368-7 and 2018/19590-6 —FAPESP), Msc. Guilherme Henrique Tamarindo (Grant number 2015/13371-2 FAPESP) and Dr. Fernanda Ramos Gadelha (Grant number 2015/24595-9 FAPESP and 309764/2015-7 CNPq). The authors also thank the Coordination for the Improvement of Higher Education Personnel (CAPES) for scholarship (Finance Code 001), São José do Rio Preto Extension and Research Foundation (FAPERP) for their partial financial support (Grant number 002/2018), and Mr. Angel Esteban Van Nynatten, a native speaker and professional translator, for extensively revising the manuscript.
Data Availability
The data used to support the findings of this study are available from the corresponding author upon request.
Conflicts of Interest
None of the authors has been commissioned to perform or publish this work and have no conflict of interest. All authors approved the final version of the manuscript.
References
- 1.Oberley T. D., Zhong W., Szweda L. I., Oberley L. W. Localization of antioxidant enzymes and oxidative damage products in normal and malignant prostate epithelium. The Prostate. 2000;44(2):144–155. doi: 10.1002/1097-0045(20000701)44:2<144::AID-PROS7>3.0.CO;2-G. [DOI] [PubMed] [Google Scholar]
- 2.Yossepowitch O., Pinchuk I., Gur U., Neumann A., Lichtenberg D., Baniel J. Advanced but not localized prostate cancer is associated with increased oxidative stress. The Journal of Urology. 2007;178(4):1238–1244. doi: 10.1016/j.juro.2007.05.145. [DOI] [PubMed] [Google Scholar]
- 3.Porporato P. E., Filigheddu N., Pedro J. M. B. S., Kroemer G., Galluzzi L. Mitochondrial metabolism and cancer. Cell Research. 2017;28(3):265–280. doi: 10.1038/cr.2017.155. [DOI] [PMC free article] [PubMed] [Google Scholar]
- 4.Panov A., Orynbayeva Z. Bioenergetic and antiapoptotic properties of mitochondria from cultured human prostate cancer cell lines PC-3, DU145 and LNCaP. PLoS One. 2013;8(8, article e72078) doi: 10.1371/journal.pone.0072078. [DOI] [PMC free article] [PubMed] [Google Scholar]
- 5.Philley J. V., Kannan A., Qin W., et al. Complex-I alteration and enhanced mitochondrial fusion are associated with prostate cancer progression. Journal of Cellular Physiology. 2016;231(6):1364–1374. doi: 10.1002/jcp.25240. [DOI] [PMC free article] [PubMed] [Google Scholar]
- 6.Acuna-Castroviejo D., Martin M., Macias M., et al. Melatonin, mitochondria, and cellular bioenergetics. Journal of Pineal Research. 2001;30(2):65–74. doi: 10.1034/j.1600-079X.2001.300201.x. [DOI] [PubMed] [Google Scholar]
- 7.Martín M., Macías M., León J., Escames G., Khaldy H., Acuña-Castroviejo D. Melatonin increases the activity of the oxidative phosphorylation enzymes and the production of ATP in rat brain and liver mitochondria. International Journal of Biochemistry and Cell Biology. 2002;34(4):348–357. doi: 10.1016/S1357-2725(01)00138-8. [DOI] [PubMed] [Google Scholar]
- 8.Chuffa L. G. A., Lupi Júnior L. A., Seiva F. R. F., et al. Quantitative proteomic profiling reveals that diverse metabolic pathways are influenced by melatonin in an in vivo model of ovarian carcinoma. Journal of Proteome Research. 2016;15(10):3872–3882. doi: 10.1021/acs.jproteome.6b00713. [DOI] [PubMed] [Google Scholar]
- 9.Castillo C., Salazar V., Ariznavarreta C., Vara E., Tresguerres J. A. F. Effect of melatonin administration on parameters related to oxidative damage in hepatocytes isolated from old Wistar rats. Journal of Pineal Research. 2005;38(4):240–246. doi: 10.1111/j.1600-079X.2004.00199.x. [DOI] [PubMed] [Google Scholar]
- 10.López A., García J. A., Escames G., et al. Melatonin protects the mitochondria from oxidative damage reducing oxygen consumption, membrane potential, and superoxide anion production. Journal of Pineal Research. 2009;46(2):188–198. doi: 10.1111/j.1600-079X.2008.00647.x. [DOI] [PubMed] [Google Scholar]
- 11.Shiu S. Y. W. Towards rational and evidence-based use of melatonin in prostate cancer prevention and treatment. Journal of Pineal Research. 2007;43(1):1–9. doi: 10.1111/j.1600-079X.2007.00451.x. [DOI] [PubMed] [Google Scholar]
- 12.Bartsch C., Bartsch H., Schmidt A., Ilg S., Bichler K. H., Flüchter S. H. Melatonin and 6-sulfatoxymelatonin circadian rhythms in serum and urine of primary prostate cancer patients: evidence for reduced pineal activity and relevance of urinary determinations. Clinica Chimica Acta. 1992;209(3):153–167. doi: 10.1016/0009-8981(92)90164-L. [DOI] [PubMed] [Google Scholar]
- 13.Iguchi H., Kato K.-I., Ibayashi H. Age-dependent reduction in serum melatonin concentrations in healthy human subjects. Journal of Clinical Endocrinology and Metabolism. 1982;55(1):27–29. doi: 10.1210/jcem-55-1-27. [DOI] [PubMed] [Google Scholar]
- 14.Sohal R. S., Weindruch R. Oxidative stress, caloric restriction, and aging. Science. 1996;273(5271):59–63. doi: 10.1126/science.273.5271.59. [DOI] [PMC free article] [PubMed] [Google Scholar]
- 15.Scialò F., Fernández-Ayala D. J., Sanz A. Role of mitochondrial reverse electron transport in ROS signaling: potential roles in health and disease. Frontiers in Physiology. 2017;8(428):1–7. doi: 10.3389/fphys.2017.00428. [DOI] [PMC free article] [PubMed] [Google Scholar]
- 16.Sakr W. A., Haas G. P., Cassin B. F., Pontes J. E., Crissman J. D. The frequency of carcinoma and intraepithelial neoplasia of the prostate in young male patients. The Journal of Urology. 1993;150(2):379–385. doi: 10.1016/S0022-5347(17)35487-3. [DOI] [PubMed] [Google Scholar]
- 17.Lu Y.-X., Chen D.-L., Wang D.-S., et al. Melatonin enhances sensitivity to fluorouracil in oesophageal squamous cell carcinoma through inhibition of Erk and Akt pathway. Cell Death & Disease. 2016;7(10):e2432–e2412. doi: 10.1038/cddis.2016.330. [DOI] [PMC free article] [PubMed] [Google Scholar]
- 18.Shin S., Jing K., Jeong S., et al. The omega-3 polyunsaturated fatty acid DHA induces simultaneous apoptosis and autophagy via mitochondrial ROS-mediated Akt-mTOR signaling in prostate cancer cells expressing mutant p53. BioMed Research International. 2013;2013:11. doi: 10.1155/2013/568671.538529 [DOI] [PMC free article] [PubMed] [Google Scholar]
- 19.Hou L., Lian K., Yao M., et al. Reduction of n-3 PUFAs, specifically DHA and EPA, and enhancement of peroxisomal beta-oxidation in type 2 diabetic rat heart. Cardiovascular Diabetology. 2012;11(1):p. 126. doi: 10.1186/1475-2840-11-126. [DOI] [PMC free article] [PubMed] [Google Scholar]
- 20.Lyberg A. M., Adlerceutz P. Monitoring monohydroperoxides in docosahexaenoic acid using high-performance liquid chromatography. Lipids. 2006;41(1):67–76. doi: 10.1007/s11745-006-5072-z. [DOI] [PubMed] [Google Scholar]
- 21.Esterbauer H., Schaur R. J., Zollner H. Chemistry and biochemistry of 4-hydroxynonenal, malonaldehyde and related aldehydes. Free Radical Biology & Medicine. 1991;11(1):81–128. doi: 10.1016/0891-5849(91)90192-6. [DOI] [PubMed] [Google Scholar]
- 22.Kirby M., Hirst C., Crawford E. D. Characterising the castration-resistant prostate cancer population: a systematic review. International Journal of Clinical Practice. 2011;65(11):1180–1192. doi: 10.1111/j.1742-1241.2011.02799.x. [DOI] [PubMed] [Google Scholar]
- 23.Cui K., Li X., du Y., et al. Chemoprevention of prostate cancer in men with high-grade prostatic intraepithelial neoplasia (HGPIN): a systematic review and adjusted indirect treatment comparison. Oncotarget. 2017;8(22):36674–36684. doi: 10.18632/oncotarget.16230. [DOI] [PMC free article] [PubMed] [Google Scholar]
- 24.Cunningham D., You Z. In vitro and in vivo model systems used in prostate cancer research. Journal of Biological Methods. 2015;2(1):17–28. doi: 10.14440/jbm.2015.63. [DOI] [PMC free article] [PubMed] [Google Scholar]
- 25.Meng H., Shen Y., Shen J., Zhou F., Shen S., Das U. N. Effect of n-3 and n-6 unsaturated fatty acids on prostate cancer (PC-3) and prostate epithelial (RWPE-1) cells in vitro. Lipids in Health and Disease. 2013;12(1):p. 160. doi: 10.1186/1476-511X-12-160. [DOI] [PMC free article] [PubMed] [Google Scholar]
- 26.Hevia D., Mayo J. C., Quiros I., Gomez-Cordoves C., Sainz R. M. Monitoring intracellular melatonin levels in human prostate normal and cancer cells by HPLC. Analytical and Bioanalytical Chemistry. 2010;397(3):1235–1244. doi: 10.1007/s00216-010-3653-4. [DOI] [PubMed] [Google Scholar]
- 27.Reiter R. J., Tan D. X., Maldonado M. D. Melatonin as an antioxidant: physiology versus pharmacology. Journal of Pineal Research. 2005;39(2):215–216. doi: 10.1111/j.1600-079X.2005.00261.x. [DOI] [PubMed] [Google Scholar]
- 28.Barros M. H., Bandy B., Tahara E. B., Kowaltowski A. J. Higher respiratory activity decreases mitochondrial reactive oxygen release and increases life span in Saccharomyces cerevisiae. Journal of Biological Chemistry. 2004;279(48):49883–49888. doi: 10.1074/jbc.M408918200. [DOI] [PubMed] [Google Scholar]
- 29.Dagda R. K., Cherra S. J., III, Kulich S. M., Tandon A., Park D., Chu C. T. Loss of PINK1 function promotes mitophagy through effects on oxidative stress and mitochondrial fission. Journal of Biological Chemistry. 2009;284(20):13843–13855. doi: 10.1074/jbc.M808515200. [DOI] [PMC free article] [PubMed] [Google Scholar]
- 30.Holden M. J., Sze H. Effects of Helminthosporium maydis race t toxin on electron transport in susceptible corn mitochondria and prevention of toxin actions by dicyclohexylcarbodiimide. Plant Physiology. 1989;91(4):1296–1302. doi: 10.1104/pp.91.4.1296. [DOI] [PMC free article] [PubMed] [Google Scholar]
- 31.Silva T. M., Peloso E. F., Vitor S. C., Ribeiro L. H. G., Gadelha F. R. O2 consumption rates along the growth curve: new insights into Trypanosoma cruzi mitochondrial respiratory chain. Journal of Bioenergetics and Biomembranes. 2011;43(4):409–417. doi: 10.1007/s10863-011-9369-0. [DOI] [PubMed] [Google Scholar]
- 32.Vayalil P. K., Landar A. Mitochondrial oncobioenergetic index: a potential biomarker to predict progression from indolent to aggressive prostate cancer. Oncotarget. 2015;6(40):43065–43080. doi: 10.18632/oncotarget.5487. [DOI] [PMC free article] [PubMed] [Google Scholar]
- 33.Degeorges A., Hoffschir F., Cussenot O., et al. Recurrent cytogenetic alterations of prostate carcinoma and amplification of c-myc or epidermal growth factor receptor in subclones of immortalized PNT1 human prostate epithelial cell line. International Journal of Cancer. 1995;62(6):724–731. doi: 10.1002/ijc.2910620613. [DOI] [PubMed] [Google Scholar]
- 34.Friedrichs W., Ruparel S. B., Marciniak R. A., deGraffenried L. Omega-3 fatty acid inhibition of prostate cancer progression to hormone independence is associated with suppression of mTOR signaling and androgen receptor expression. Nutrition and Cancer. 2011;63(5):771–777. doi: 10.1080/01635581.2011.570892. [DOI] [PubMed] [Google Scholar]
- 35.Oono K., Takahashi K., Sukehara S., et al. Inhibition of PC3 human prostate cancer cell proliferation, invasion and migration by eicosapentaenoic acid and docosahexaenoic acid. Molecular and Clinical Oncology. 2017;7(2):217–220. doi: 10.3892/mco.2017.1287. [DOI] [PMC free article] [PubMed] [Google Scholar]
- 36.Vander Heiden M. G., Cantley L. C., Thompson C. B. Understanding the Warburg effect: the metabolic requirements of cell proliferation. Science. 2009;324(5930):1029–1033. doi: 10.1126/science.1160809. [DOI] [PMC free article] [PubMed] [Google Scholar]
- 37.Eidelman E., Twum-Ampofo J., Ansari J., Siddiqui M. M. The metabolic phenotype of prostate cancer. Frontiers in Oncology. 2017;7:1–6. doi: 10.3389/fonc.2017.00131. [DOI] [PMC free article] [PubMed] [Google Scholar]
- 38.Valença I., Pértega-Gomes N., Vizcaino J. R., et al. Localization of MCT2 at peroxisomes is associated with malignant transformation in prostate cancer. Journal of Cellular and Molecular Medicine. 2015;19(4):723–733. doi: 10.1111/jcmm.12481. [DOI] [PMC free article] [PubMed] [Google Scholar]
- 39.Choudhary V., Kaddour-Djebbar I., Lakshmikanthan V., et al. Novel role of androgens in mitochondrial fission and apoptosis. Molecular Cancer Research. 2011;9(8):1067–1077. doi: 10.1158/1541-7786.MCR-10-0445. [DOI] [PMC free article] [PubMed] [Google Scholar]
- 40.Rottenberg H., Covian R., Trumpower B. L. Membrane potential greatly enhances superoxide generation by the cytochromebc1 complex reconstituted into phospholipid vesicles. Journal of Biological Chemistry. 2009;284(29):19203–19210. doi: 10.1074/jbc.M109.017376. [DOI] [PMC free article] [PubMed] [Google Scholar]
- 41.Banerjee S., Aykin-Burns N., Krager K. J., et al. Loss of C/EBPδ enhances IR-induced cell death by promoting oxidative stress and mitochondrial dysfunction. Free Radical Biology & Medicine. 2016;99:296–307. doi: 10.1016/j.freeradbiomed.2016.08.022. [DOI] [PMC free article] [PubMed] [Google Scholar]
- 42.Youle R. J., van der Bliek A. M. Mitochondrial fission, fusion, and stress. Science. 2012;337(6098):1062–1065. doi: 10.1126/science.1219855. [DOI] [PMC free article] [PubMed] [Google Scholar]
- 43.Zhang Y., Jiang L., Hu W., Zheng Q., Xiang W. Mitochondrial dysfunction during in vitro hepatocyte steatosis is reversed by omega-3 fatty acid–induced up-regulation of mitofusin 2. Metabolism: Clinical and Experimental. 2011;60(6):767–775. doi: 10.1016/j.metabol.2010.07.026. [DOI] [PubMed] [Google Scholar]
- 44.Chacko B. K., Kramer P. A., Ravi S., et al. The bioenergetic health index: a new concept in mitochondrial translational research. Clinical Science. 2014;127(6):367–373. doi: 10.1042/CS20140101. [DOI] [PMC free article] [PubMed] [Google Scholar]
- 45.Tan D. X., Manchester L. C., Terron M. P., Flores L. J., Reiter R. J. One molecule, many derivatives: a never-ending interaction of melatonin with reactive oxygen and nitrogen species? Journal of Pineal Research. 2007;42(1):28–42. doi: 10.1111/j.1600-079X.2006.00407.x. [DOI] [PubMed] [Google Scholar]
- 46.Tomás-Zapico C., Coto-Montes A. A proposed mechanism to explain the stimulatory effect of melatonin on antioxidative enzymes. Journal of Pineal Research. 2005;39(2):99–104. doi: 10.1111/j.1600-079X.2005.00248.x. [DOI] [PubMed] [Google Scholar]
- 47.Martin M., Macias M., Escames G., et al. Melatonin-induced increased activity of the respiratory chain complexes I and IV can prevent mitochondrial damage induced by ruthenium red in vivo. Journal of Pineal Research. 2000;28(4):242–248. doi: 10.1034/j.1600-079X.2000.280407.x. [DOI] [PubMed] [Google Scholar]
- 48.Jimenéz-Aranda A., Fernández-Vázquez G., Mohammad A-Serrano M., Reiter R. J., Agil A. Melatonin improves mitochondrial function in inguinal white adipose tissue of Zücker diabetic fatty rats. Journal of Pineal Research. 2014;57(1):103–109. doi: 10.1111/jpi.12147. [DOI] [PubMed] [Google Scholar]
- 49.Kluckova K., Bezawork-Geleta A., Rohlena J., Dong L., Neuzil J. Mitochondrial complex II, a novel target for anti-cancer agents. Biochimica et Biophysica Acta-Bioenergetics. 2013;1827(5):552–564. doi: 10.1016/j.bbabio.2012.10.015. [DOI] [PubMed] [Google Scholar]
- 50.Bezawork-Geleta A., Rohlena J., Dong L., Pacak K., Neuzil J. Mitochondrial complex II: at the crossroads. Trends in Biochemical Sciences. 2017;42(4):312–325. doi: 10.1016/j.tibs.2017.01.003. [DOI] [PMC free article] [PubMed] [Google Scholar]
- 51.Gobbo M. G., Dizeyi N., Abrahamsson P. A., et al. Influence of melatonin on the proliferative and apoptotic responses of the prostate under normal and hyperglycemic conditions. Journal of Diabetes Research. 2015;2015:18. doi: 10.1155/2015/538529.538529 [DOI] [PMC free article] [PubMed] [Google Scholar]
- 52.Zamaraeva M. V., Sabirov R. Z., Maeno E., Ando-Akatsuka Y., Bessonova S. V., Okada Y. Cells die with increased cytosolic ATP during apoptosis: a bioluminescence study with intracellular luciferase. Cell Death and Differentiation. 2005;12(11):1390–1397. doi: 10.1038/sj.cdd.4401661. [DOI] [PubMed] [Google Scholar]
- 53.Yang Z., Liu Y., Shi C., et al. Suppression of PTEN/AKT signaling decreases the expression of TUBB3 and TOP2A with subsequent inhibition of cell growth and induction of apoptosis in human breast cancer MCF-7 cells via ATP and caspase-3 signaling pathways. Oncology Reports. 2017;37(2):1011–1019. doi: 10.3892/or.2017.5358. [DOI] [PubMed] [Google Scholar]
- 54.Zhang Y., Chin-Quee K., Riddle R. C., Li Z., Zhou Z., Donahue H. J. BRMS1 sensitizes breast cancer cells to ATP-induced growth suppression. BioResearch Open Access. 2013;2(2):77–83. doi: 10.1089/biores.2012.0260. [DOI] [PMC free article] [PubMed] [Google Scholar]
- 55.Mebratu Y., Tesfaigzi Y. How ERK1/2 activation controls cell proliferation and cell death is subcellular localization the answer? Cell Cycle. 2009;8(8):1168–1175. doi: 10.4161/cc.8.8.8147. [DOI] [PMC free article] [PubMed] [Google Scholar]
- 56.Yan K.-H., Yao C.-J., Hsiao C.-H., et al. Mefloquine exerts anticancer activity in prostate cancer cells via ROS-mediated modulation of AKT, ERK, JNK and AMPK signaling. Oncology Letters. 2013;5(5):1541–5. doi: 10.3892/ol.2013.1211. [DOI] [PMC free article] [PubMed] [Google Scholar]
- 57.Cagnol S., Chambard J. C. ERK and cell death: mechanisms of ERK-induced cell death - apoptosis, autophagy and senescence. FEBS Journal. 2010;277(1):2–21. doi: 10.1111/j.1742-4658.2009.07366.x. [DOI] [PubMed] [Google Scholar]
- 58.Yin Z., Ivanov V. N., Habelhah H., Tew K., Ronai Z. Glutathione S-transferase p elicits protection against H2O2-induced cell death via coordinated regulation of stress kinases. Cancer Research. 2000;60(15):4053–4057. [PubMed] [Google Scholar]
- 59.Estrada M., Espinosa A., Müller M., Jaimovich E. Testosterone stimulates intracellular calcium release and mitogen-activated protein kinases via a G protein-coupled receptor in skeletal muscle cells. Endocrinology. 2003;144(8):3586–3597. doi: 10.1210/en.2002-0164. [DOI] [PubMed] [Google Scholar]
- 60.Gilad E., Pick E., Matzkin H., Zisapel N. Melatonin receptors in benign prostate epithelial cells: evidence for the involvement of cholera and pertussis toxins-sensitive G proteins in their signal transduction pathways. The Prostate. 1998;35(1):27–34. doi: 10.1002/(SICI)1097-0045(19980401)35:1<27::AID-PROS4>3.0.CO;2-E. [DOI] [PubMed] [Google Scholar]
Associated Data
This section collects any data citations, data availability statements, or supplementary materials included in this article.
Data Availability Statement
The data used to support the findings of this study are available from the corresponding author upon request.