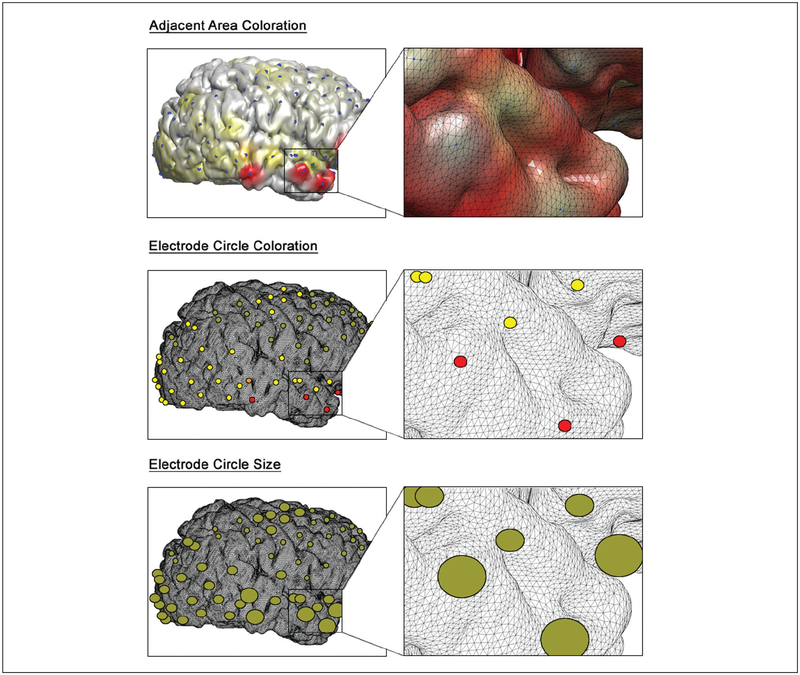
Figure 3.
Common methods for displaying intracranial EEG data on a cortical surface include coloration of areas adjacent to each electrode (top), coloration of electrode-defined circles (middle), and sizing of electrode-defined circles proportional to signal strength (bottom). All three methods show onset of high-frequency beta activity in the right temporal lobe during a seizure

