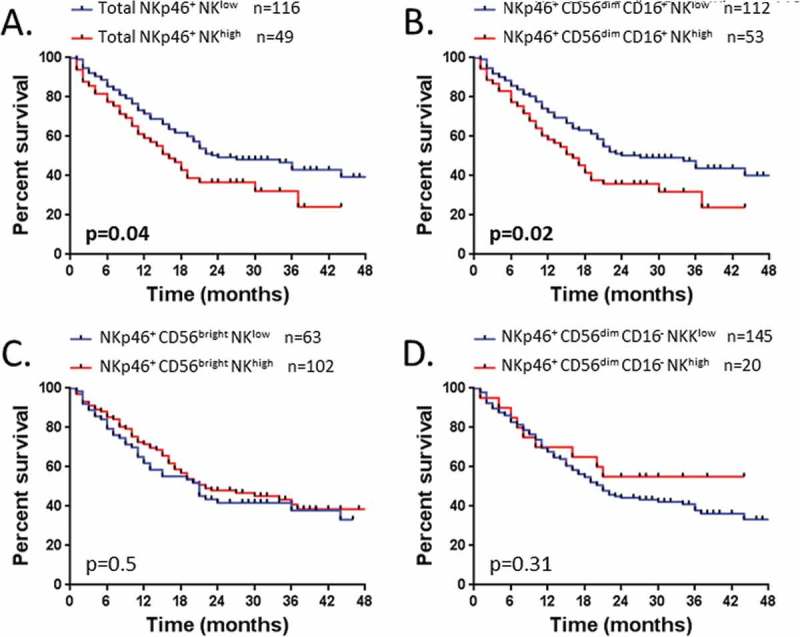
Figure 6.

Patients’ survival according to the rate of NK cell subsets expressing NKp46.
Survival of patients is depicted as Kaplan-Meier curves. Patients (n = 165) were divided into two groups low and high as detailed in result section, graphically defined by a cut off value of 37% for (A) NKp46+ NK cells and (B) NKp46+ CD56dim CD16+ NK cells; and defined by the percentage mean value of: (C) NKp46+ CD56bright NK cells (mean = 59%) and (D) NKp46+ CD56dim CD16− NK cells (mean = 29%). Statistical analysis was performed using the Log-Rank test.
