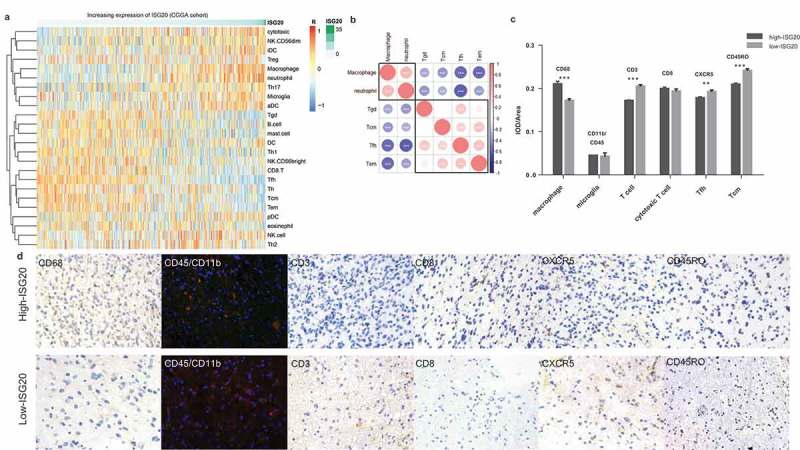
Figure 5.

Analysis of tumor immune cell infiltration relative to the ISG20 level in the CGGA dataset. (a) Correlation of 24 immune cell subpopulations with ISG20 expression in CGGA dataset. Each colored square within the figure illustrates the correlation between ISG20 and the transcriptional profile of the corresponding immune cell type. Red color illustrates a very strong positive correlation (r = 1), white no correlation (r = 0), and blue a negative correlation (r = −1). (b) Mutual relationship of ISG20-correlated immune cells in CGGA dataset. Plot size and color depth show the intensity of the relationship: red, positive correlation; blue, negative correlation; larger plot indicates a stronger correlation. *p < 0.05, **p < 0.01, ***p < 0.001. (c) Analysis of intratumoral immune cell infiltrates relative to ISG20 expression. Immune cell infiltrates from 43 glioma patients were analyzed by immunohistochemistry. Macrophages (quantified with marker CD68), microglia (CD45 + CD11b), T cells (CD3), cytotoxic T cells (CD8), Tfh cells (CXCR5), memory T cells (CD45RO) were stained. Expression of marker for macrophages increased with increasing ISG20 expression. In contrast, markers for T cells, Tfh cells, and Tcm cells were decreased in high ISG20 expression tumors. Markers for microglia and cytotoxic T cells did not show significant change. (d) Photographs of immunohistochemical staining of each marker in high- and low-ISG20 expression tumors. For CD68, CD3, CD8, CXCR5 and CD45RO, positive cells are stained brown. For CD45 + CD11b, positive cells are stained orange (after merging FITC and CY3 emission signal). Magnification, x400. IHC, immunohistochemistry; high-ISG20, high expression of ISG20; Low-ISG20, low expression of ISG20, **p < 0.01, ***p < 0.001.
