ABSTRACT
Biosimilars are biologic products that are highly similar to a licensed reference product in terms of quality, safety, and efficacy. SB5 is a biosimilar of Humira® (adalimumab) developed by Samsung Bioepis. To demonstrate its biosimilarity in quality to Humira®, we performed a comprehensive characterization in terms of structure, physicochemical properties, and biological properties following the International Conference on Harmonization, US Food and Drug Administration, and European Medicines Agency guidelines. We analyzed all available batches of SB5 and more than 100 EU- and US-sourced lots of Humira® using state-of-the-art methods whenever possible, and compared the two sets of data. The structural properties comprised primary and higher-order structures and N-glycosylation. The physicochemical characteristics were categorized into liquid chromatographic patterns and electrophoretic pattern concerning size and charge heterogeneity. The biological properties were examined by in vitro functional assays.
Overall, SB5 and Humira® were shown to be similar to each other in terms of quality attributes. For some of the quality attributes, minor differences were observed. However, the observed differences have been adequately addressed and demonstrated these do not translate into clinically meaningful differences in terms of safety, purity, and potency.
KEYWORDS: adalimumab, biosimilar, characterization, critical quality attribute, Hadlima, Imraldi, SB5
Introduction
Advances in the development, regulation, and application of antibody-based therapeutics have ushered in a new era of increased biosimilar development in response to an increased number of originator biologics coming off patent.1,2 Biosimilars are required to demonstrate a high degree of similarity with the reference products by regulatory authorities, such as the European Medicines Agency (EMA) and US Food and Drug Administration (FDA). A step-wise, totality-of-evidence development approach is recommended in regulatory guidance. In addition, any differences in biosimilar and reference product quality attributes should be justified in relation to its potential impact on efficacy and safety. With this approach, physicochemical and in vitro biological analyses lay the foundation for in vivo animal and clinical studies designed to address residual uncertainties with respect to biosimilarity.3–5
As a biosimilar of Humira® (adalimumab), SB5 was approved by the European Commission in August 2017 under the name Imraldi® and by South Korea’s Ministry of Food and Drug Safety in September 2017 under the name Hadlima®.6,7 Adalimumab is a recombinant human monoclonal antibody of two kappa light chains and two IgG1 heavy chains with a total molecular weight of approximately 148 kDa. Each light and heavy chain consists of 214 amino acid residues and 451 amino acid residues, respectively. As a tumor necrosis factor (TNF) inhibitor, adalimumab’s primary mode of action (MOA) is the specific binding to both soluble and transmembrane forms of TNF, thereby blocking TNF’s binding to the cell surface TNF receptors (TNFR) p55 (TNFRI) and p75 (TNFRII), which are responsible for both forward and reverse signaling pathways. Since TNF plays a central role in controlling immune response, adalimumab may also modulate biological responses controlled by additional downstream molecules, such as cytokines and adhesion molecules that are induced and regulated by TNF.8 Adalimumab is indicated for use in the treatment of rheumatoid arthritis, ankylosing spondylitis, uveitis, ulcerative colitis, Crohn’s disease, psoriatic arthritis, psoriasis, hidradenitis suppurativa, and intestinal Behcet’s disease.9
To demonstrate biosimilarity between SB5 and Humira®, approaches corresponding the regulatory guidelines were employed.10–12 Structural, physicochemical, and biological quality attributes critical to the adalimumab MOA and with a potential to affect potency, efficacy, and safety were selected for the study based on an extensive risk assessment. SB5 and Humira® were then analyzed using more than 55 robust and state-of-the-art methods. Statistically established similarity ranges for selected quality attributes were calculated based on the characterization of 91 lots of Humira® sourced from the European Union (EU) and the United States (US). Multiple batches of SB5 were assessed against the established similarity ranges or direct side-by-side comparison with reference products. Through structure-activity relationship (SAR) studies, different structural and physicochemical properties of SB5 against the reference products were examined to address the impact on biological functions of SB5.
Here, we provide results from the extensive analytical characterization of SB5 and Humira® with respect to their structural, physicochemical, and biological properties to demonstrate their analytical similarity. Most of the structural and biological characterization results demonstrated that SB5 is highly similar to the reference products. The differences in some physicochemical attributes, such as the charge variants, are not considered to have a significant role in the biological function of the antibody based on SAR studies.
Results
To compare the physicochemical, biophysical, and biological quality attributes of SB5 with those of the reference product, Humira®, standard or state-of-the-art methods were used. A total of 55 test items (Table 1) were used for these comparisons, the representative test results of them are described in this paper. The similarity ranges for individual methods were set as one-sided (upper or lower limit as acceptance criterion) or two-sided (upper and lower limits as acceptance criteria) depending on the specification. This approach is in line with the regulatory requirements of both EMA and FDA and with their opinions on the best practices in biosimilar development.10,11
Table 1.
Summarized attributes with analytical methods and assessment results of the biosimilarity.
| Category | Product Quality Attributes | Analytical Methods | Assessment |
|---|---|---|---|
| Physicochemical characterization | |||
| Primary Structure | Molecular weight | Intact mass analysis for glycosylated and deglycoylated under reducing/non-reducing conditions | Highly similar to the reference product |
| Amino acid sequence | Peptide mapping by LC-ESI-MS/MS using a combination of digestion enzymes | Identical to the reference product | |
| Methionine oxidation | Peptide mapping by LC-ESI-MS/MS | Highly similar to the reference product | |
| Deamidation | |||
| Non-glycosylation | |||
| C-terminal and N-terminal variants | |||
| Disulfide linkage mapping | Peptide mapping under non-reducing condition | Highly similar to the reference product | |
| Free sulfhydryl group | Fluorescence detection kit | Slightly higher in free sulfhydryl group but not clinically meaningful | |
| Higher-order Structure |
Protein secondary and tertiary structure | Far- and near-UV CD, FTIR spectroscopy, Intrinsic and extrinsic fluorescence spectroscopy H/DX-MS, Antibody conformational array |
Highly similar to the reference product |
| Thermodynamic stability | DSC | Highly similar to the reference product | |
| Extinction coefficient determination | Amino acid analysis, SEC/UV/MALLS/RI | Highly similar to the reference product | |
| Carbohydrate Structure and Composition | N-linked glycosylation site determination | LC-ESI-MS/MS | Highly similar to the reference product |
| N-glycan identification | Procainamide labelling and LC-ESI-MS/MS | Minor difference was observed, but not clinically meaningful | |
| N-glycan profile analysis | 2-AB labelling and HILIC-UPLC | Similar in terms of %Afucose+%HM, %Charged glycans of SB5 is slightly higher, but not clinically meaningful | |
| Size heterogeneity | High molecular weight | SE-HPLC, SEC/MALLS, SV-AUC | Highly similar to the reference product |
| Low molecular weight | CE-SDS (non-reducing/reducing) | Highly similar to the reference product | |
| Particulates | DLS and MFI | Highly similar to the reference product | |
| Charge heterogeneity | Acidic and basic variants | CEX-HPLC, icIEF | Slightly higher acidic and lower basic level compared to the reference product, but not clinically meaningful |
| Quantity | Protein content | UV/VIS at A280 | Highly similar to the reference product |
| Biological Characterization | |||
| Fab-related Biological activity | TNF neutralization activity | TNF neutralization assay by NF-κB reporter gene assay | Highly similar to the reference product |
| TNF binding activity | FRET | Highly similar to the reference product | |
| Apoptosis activity | Cell-based assay | Highly similar to the reference product | |
| Fc-related Biological Activity | Transmembrane TNF-α binding assay | FACS | Highly similar to the reference product |
| FcRn binding | AlphaScreen® | Highly similar to the reference product | |
| FcγRIIIa (V/V type) binding | SPR | Highly similar to the reference product | |
| ADCC using healthy donor PBMC | Cell-based assay | Highly similar to the reference product | |
| CDC | Cell-based assay | Highly similar to the reference product | |
| C1q binding | ELISA | Highly similar to the reference product | |
These methods and results are representative examples of 55 test items were used for similarity assessment.
Primary structure
EMA and FDA guidelines state that the amino acid sequence of a biosimilar must be identical to that of the reference product.4,13 Antibody primary structure was determined by intact mass and peptide mapping analysis. Intact mass analysis is the measurement and the determination of the molecular weight of whole, reduced, or deglycosylated proteins. Peptide mapping provides in-depth information about post-translational modifications of the primary sequence. To determine the primary amino acid sequence of SB5, we conducted the liquid chromatography-electrospray ionization-tandem mass spectrometry (LC-ESI-MS/MS) as peptide mapping approach, which provided 100% sequence coverage with three kinds of endopeptidase treatment (trypsin, Lys-C, and Asp-N). Also, N-/C-terminal variants including pyroglutamate (pyro-E) form, lysine deletion, alpha-amidation, as well as the level of oxidation/deamidation were evaluated.
Based on the results of intact mass and peptide mapping analysis, the molecular weight of SB5 and the reference product were similar considering assay variability (0.01% of molecular weight and 30 ppm for intact protein and peptide, respectively).
The mirror images of the peptide chromatograms of trypsin or Lys-C digested SB5 and reference product showed high similarity in peak intensities and retention times (Figure 1). Sequence variants generated by post-translational modifications such as oxidation and deamidation were revealed by LC-ESI-MS/MS. Residue Met256 in SB5 is the most sensitive site to oxidation, and its oxidation levels were similar to those in the reference product. Also, the relative deamidation levels of Asn residues in SB5 were similar to the reference product. (data not shown).
Figure 1.
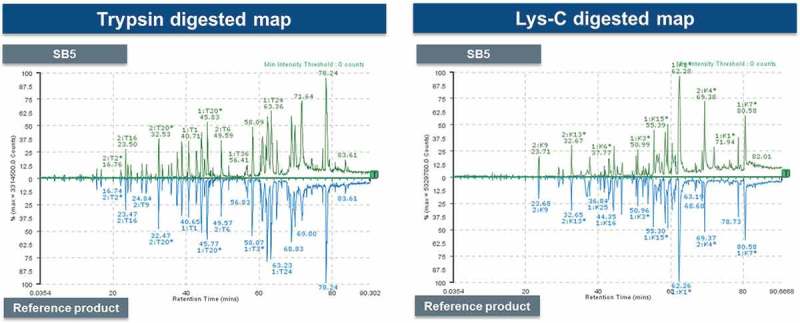
Comparison for peptide mapping profiles of the SB5 and the reference product.
Mirror images of Trypsin-digested (left) and Lys-C–digested (right) peptides profile of SB5 and the reference product.
Disulfide linkage
Both intra- and inter-chain disulfide bonds are critical for establishing antibody tertiary and quaternary structure of antibodies.14 Disulfide linkage was analyzed by disulfide mapping, free-thiol quantification, hydrogen/deuterium exchange-mass spectrometry (H/DX-MS), and differential scanning calorimetry (DSC) analyses. The results showed that all the cysteine residues are properly involved in disulfide bonds. Disulfide mapping of SB5 and the reference product was conducted by trypsin-digestion without reducing. All the cysteine (Cys) residues, 32 in total, are involved in the formation of the 16 disulfide bonds, with no free sulfhydryl groups left.
Experimentally, the free thiols in SB5 and reference product were detected by using a fluorescent label with excitation and emission maxima at the wavelengths of 494 nm and 517 nm, respectively. The reference product was found to have slightly lower levels of free thiols than SB5. However, the degree of free thiol is all so low that, overall, each IgG molecule contains no free thiol; in other words, all the 32 Cys residues are involved in disulfide bonding. This conclusion is also supported by the results of the H/DX-MS and DSC analyses, which demonstrated conformational similarity between SB5 and the reference products. Cys224 in the HC and Cys214 in the LC are involved in inter-chain linkage between the HC and the LC. The two HC molecules are covalently linked to each other at Cys230 and Cys233. All the other Cys residues are involved in intra-chain disulfide linkage (Figure 2 and Table 2).
Figure 2.

Comparison for disulfide linked peptides of SB5 and the reference product.
Non-reduced (upper panel) and reduced (lower panel) peptide maps of SB5 and the reference product.
Table 2.
Disulfide linkage of SB5 and the reference product.
| Type of Disulfide Bond | Cysteine site | Expected Mass (Da) | Identified m/z (Charge state) | Experimentally Detected m/z |
||
|---|---|---|---|---|---|---|
| SB5 | EU/US reference products | |||||
| Heavy chain (Intra) | Ha:Tc3-H:T9 | Cys22-Cys96 | 3406.47 | 682.30 (+ 5) | 682.30 | 682.30 |
| H:T12-H:T13 | Cys148-Cys204 | 7916.92 | 1320.49 (+ 6) | 1320.49 | 1320.49 | |
| H:T20-H:T26 | Cys265-Cys325 | 2328.10 | 777.04 (+ 3) | 777.04 | 777.04 | |
| H:T34-H:T39 | Cys371-Cys429 | 3844.82 | 641.81 (+ 6) | 641.81 | 641.81 | |
| Light chain (Intra) | Lb:T2-L:T7 | Cys23-Cys88 | 3818.78 | 764.76 (+ 5) | 764.78 | 764.78 |
| L:T13-L:T20 | Cys134-Cys194 | 3555.75 | 712.16 (+ 5) | 712.16 | 712.16 | |
| Inter chain | H:T17-L:T22 | Cys224-Cys214 | 756.24 | 757.25 (+ 1) | 757.25 | 757.25 |
| H:T18 = H:T18 | Cys230-Cys230 = Cys233-Cys233 | 5454.78 | 780.26 (+ 7) | 780.26 | 780.26 | |
aH: Heavy chain, bL: Light chain, cT: Tryptic peptide
Higher-order structure
Higher-order structure was ascertained using circular dichroism (CD), Fourier transform infrared (FTIR) spectroscopy, DSC, and H/DX-MS.
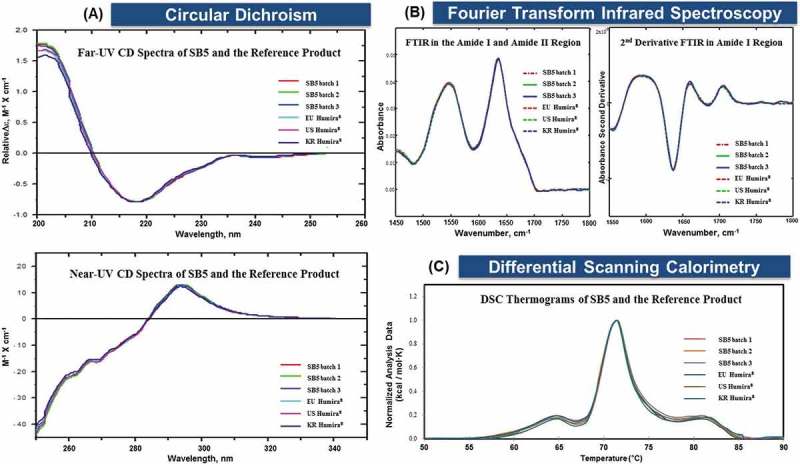
CD is a technique that measures the difference in left- and right-handed circularly polarized light. CD is generally divided into far-UV (190–250 nm) measurement for the secondary structure of proteins and near-UV (250–350 nm) measurement for the tertiary structure.15 The overlaid spectra for SB5 and the reference product for both far- and near- UV circular dichroism support high similarity in secondary and tertiary structures (Figure 3A).
Figure 3.
Comparison for higher-order profiles of SB5 and the reference product.
Representative SB5 batches and EU, US, and KR (Korea) sourced Humira® were tested as side-by-side. (A) Far- and near-UV CD spectra are shown in the top and lower panels, respectively. (B) FTIR spectra. (C) Comparative thermograms.
Secondary structure was further identified by FTIR spectroscopy. The second derivative spectra of SB5 and the reference product in the amide I band and their distribution into the amide regions support high similarity in secondary structures (Figure 3B).
Protein thermal stability and associated structural transitions were determined by DSC.16 DSC measures changes in Tm values. The Tm equals the temperature where half of the molecules have undergone unfolding. The Tm corresponds to the maximum peak of endothermal events. The overlaid thermograms exhibit three dominating peaks around 63.1–64.9°C (Tm1), 71.0–71.5°C (Tm2), and 79.0–81.2°C (Tm3) (Table 3 and Figure 3C). The shapes of SB5 and the reference product thermograms support high similarity in thermal stability.
Table 3.
Melting temperature (Tm) data for the transitions of SB5 and the reference product.
| Product | Sample | Tm1 (°C) | Tm2 (°C) | Tm3 (°C) |
|---|---|---|---|---|
| SB5 | 1 | 64.3 | 71.4 | 81.0 |
| 2 | 64.8 | 71.5 | 81.1 | |
| 3 | 64.9 | 71.5 | 81.0 | |
| 4 | 63.0 | 71.0 | 79.0 | |
| 5 | 63.2 | 71.0 | 79.0 | |
| EU reference product | 1 | 64.7 | 71.4 | 81.2 |
| 2 | 63.1 | 71.0 | 79.0 | |
| US reference product | 1 | 64.9 | 71.5 | 81.1 |
| 2 | 63.1 | 71.0 | 79.0 |
Tertiary structure was determined by H/DX-MS, which assesses solvent accessibility to various parts of a protein through levels of deuterium uptake.17 SB5 and reference product were analyzed by DynamX (Waters) for calculation of deuterium uptake and for generation of butterfly and difference plots. Of the adalimumab heavy chain sequence, 127 peptides covered 91.1% and 62 peptides covered 100% of the light chain sequence. The dynamics of deuterium uptake by butterfly plot reveal almost perfect symmetry between SB5 and the reference product. Labelling periods of 10 seconds, 1 minute, 10 minutes, 1 hour and 4 hours were each designated by a separate color (Figure 4). The difference in deuterium uptake for each peptide was within statistically determined thresholds (dashed lines ± 0.5 Da for the individual data point differences and solid line ± 1.1 Da for the sum of differences in grey bars). The deuterium uptake profiles support similarity in tertiary structures between SB5 and the reference product.
Figure 4.
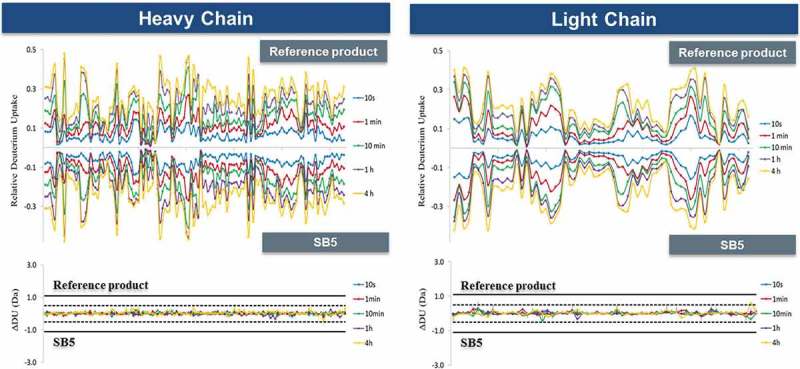
Comparison for deuterium uptake profiles of SB5 and the reference product.
Comparison of deuterium uptake over time (10 seconds to 4 hours) by SB5 and the reference product.
Carbohydrate structure and composition
Carbohydrate structure and composition were determined through identification of N-linked and O-linked glycosylation sites, glycan structures, and their quantitative profiles.
N-linked glycosylation sites were determined by LC-ESI-MS/MS. The MS/MS spectrum of a sample treated with PNGase F shows unique peaks not present in the spectrum of the corresponding non-treated sample, indicating the presence of glycan-linked Asn. Subsequent treatment with Asp-N produced two peptide fragments, confirming the single site of glycosylation. The results support identical N-linked glycosylation site on both SB5 and the reference product, which is at Asn 301 in the CH2 domain. (Figure 5).
Figure 5.

MS/MS spectra for glycosylation site of SB5 and the reference product.
Fragment peptide number starting with D is enumerated after Asp-N digest. Glycosylated D15 peptide with glycan species. Front digested peptide by Asp-N from deglycosylated D15, D15:1 (upper) and rear digested peptide by Asp-N from deglycosylated D15, D15:2 (lower) of SB5 and the reference product.
To determine the structures of the N-glycans, the N-glycans were released, separated chromatographically, and finally analyzed by MS (LC-ESI-MS/MS). Experimentally, the released N-glycans were precipitated with ethanol and labelled with procainamide to enhance ionization. They were then separated chromatographically by using UPLC Glycan BEH, detected by fluorescence, and finally analyzed by MS/MS.
N-glycan species were identified by hydrophilic interaction liquid chromatography (HILIC) with a fluorescence detector, and each species showed an identical mass within 30 ppm. A total of 13 N-glycan species were detected in SB5, and each species showed an identical retention time compared to the reference product. With the reference product, 14 N-glycan species were identified, 13 of them matching with those seen in SB5. The one species that was not detected in SB5, mannotetraose (M4), was in very low abundance even in the reference product; their presence is considered to be inconsequential to the product quality.
Using 2-AB labelled N-glycan method, the N-glycan species of SB5 and the reference product and its contents were analyzed (Figure 6). N-glycosylations are categorized into three groups: 1) the sum of the afucosylated glycans and high mannosylated glycans (%Afucose+%HM), 2) galactosylated glycans (%Gal), and 3) charged glycans (%Sialylation). Levels of Afucose+ HM, Afucose, and HM, respectively, have a positive correlation with biological activities such as FcγRIIIa binding and antibody-dependent cell-mediated cytotoxicity (ADCC) in adalimumab. Sum of %Afucose and %HM (%Afucose+%HM) showed higher correlation with the biological activities than %Afucose or %HM alone (Figure 7). The %Afucose+%HM was classified as a CQA due to the high correlation with FcγRIIIa binding and ADCC activity in adalimumab. The min/max range of %Afucose+%HM for SB5 (8.7–11.9%) met the similarity range of reference product (5.6–12.2%). The %Gal and %Sialylation was classified as non-critical quality attributes (CQAs) based on a result of risk assessment, historical data, and SAR study results.
Figure 6.
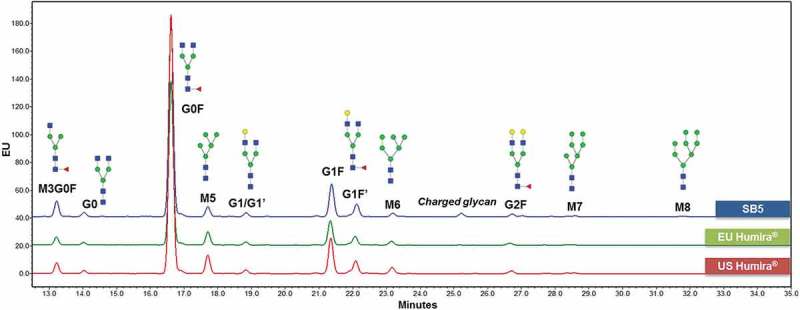
N-glycan comparison of SB5 and the reference product.
Figure 7.
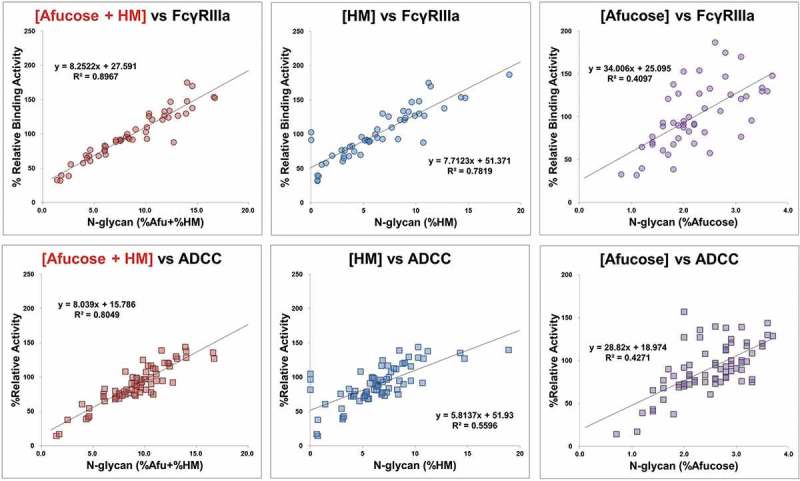
Correlation between N-glycan species and biological activities of SB5 and the reference product.
Correlation between FcγRIIIa binding activity and level of Afucose+ HM, Afucose, and HM, respectively (upper panel) and correlation between ADCC activity and level of Afucose+ HM, Afucose, and HM, respectively (right panel).
Regarding sialylation, the presence of N-glycolylneuraminic acid (NGNA) structures, one of the sialic acid types, was accessed by two liquid chromatographic methods: LC-ESI-MS/MS analysis of procainamide-labelled samples and HILIC-UPLC of 2-AB labelled samples. Both methods confirmed that only N-acetylneuraminic acid (NANA) was present. NGNA, which is related to immunogenicity, was not detected in SB5 and the reference product by these methods as well as by total sialic acid (TSA) analysis.
Additionally, O-glycan glycosylation sites can be identified by two mass-spectrometric methods: intact mass analysis and peptide mapping. Both methods confirmed the absence of O-glycans in SB5 and the reference product. To determine if O-glycan was present, deglycosylated and reduced SB5 and the reference product were used to identify O-glycan due to the heterogeneity of N-glycan species. Heavy and light chain of SB5 and the reference product do not contain any O-glycan core unit (GalNAc corresponding to 203 Da of residual mass) or larger units. Based on this intact mass result, SB5 and the reference product do not carry O-glycan species on either the heavy or light chains. For more sensitive and specific detection, peptide mapping analysis was used to identify O-glycan species.18 The data showed that any serine or threonine residues on SB5 and the reference product did not contains any O-glycan species.
Size heterogeneity
The size-related impurities/variants were determined by size exclusion–high-performance liquid chromatography (SE-HPLC) and capillary electrophoresis-sodium dodecyl sulfate (CE-SDS). The %contents of high molecular weights (%HMWs) were determined by SE-HPLC. SB5 and the reference product exhibited low levels of HMW aggregates (Figure 8A). In addition, %HMW content in SB5 and the reference product met established similarity ranges (≤ 0.5%) (Figure 8B). The results were confirmed by orthogonal analyses using SEC-coupled multi-angle laser light scattering and sedimentation velocity analytical ultracentrifugation (SV-AUC).
Figure 8.

HMW comparison of SB5 and the reference product by SE-HPLC.
(A) Overlaid SE-HPLC profile (left) and enlarged view (right). (B) HMW contents of SB5 and the reference product were within the similarity range (red dotted line). The results from 13 batches of SB5, 46 lots of EU Humira®, and 45 lots of US Humira® are presented as box plot with min/max whiskers.
The %contents of low molecular weights (%LMWs) were determined by CE-SDS, with reduced samples and non-reduced samples (Figure 9). %IgG and %2H1L by non-reducing CE-SDS and %Main (%LC+%HC) by reducing CE-SDS in SB5 and the reference product met established similarity ranges. Although SB5 has slightly different non-glycosylated heavy chain (NGHC) levels compared to the reference product, the difference had no significant clinical impact.19,20
Figure 9.
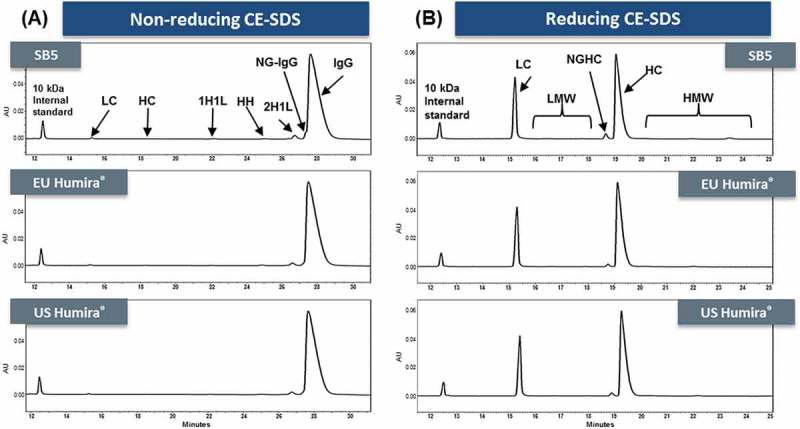
CE-SDS electropherograms comparison of SB5 and the reference product.
(A) SB5 (1st panel) and the reference product (2nd and 3rd panel) under non-reducing conditions. (B) The same products under reducing conditions.
Charge heterogeneity
The majority of recombinant monoclonal antibody (mAbs) products contain charge variants.21 To assess the similarity of charge variant between SB5 and the reference product, imaged capillary isoelectric focusing (icIEF) and cation exchange–high-performance liquid chromatography (CEX-HPLC) analyses were performed.
The percentage of acidic variants in SB5 based on the side-by-side analysis was different from the reference product, although the main proportion of SB5 was within the similarity range. The increase in acidic variants is accompanied by significantly lower levels of basic variants in SB5. These results have been confirmed by orthogonal analytical methods, icIEF and CEX-HPLC (Figures 10 and 11, respectively). The charge heterogeneity was investigated not only for the %contents of the variants, but also for the structural identities. The variants were found to contain identical structures, although the %contents showed difference.
Biological activities
The primary MOA of adalimumab is its specific binding to soluble and transmembrane TNF. TNF binding to TNFR (TNFR1 and TNFR2) activates a range of intracellular signaling pathways and induces proinflammatory cytokine production, resulting in inflammation.22 By binding to and neutralizing TNF, adalimumab blocks the ability of TNF to bind to TNFR, thereby neutralizing TNF-dependent signaling pathways. SB5 and the reference product were compared in terms of their soluble TNF (sTNF) binding ability and TNF-neutralizing potency.
The binding activity of SB5 and the reference product to sTNF was determined by a fluorescence resonance energy transfer (FRET)-based competitive inhibition assay. Relative sTNF binding activities for SB5 and the reference product were within the established similarity range, demonstrating highly similar sTNF binding activity (Figure 12A).
Figure 12.
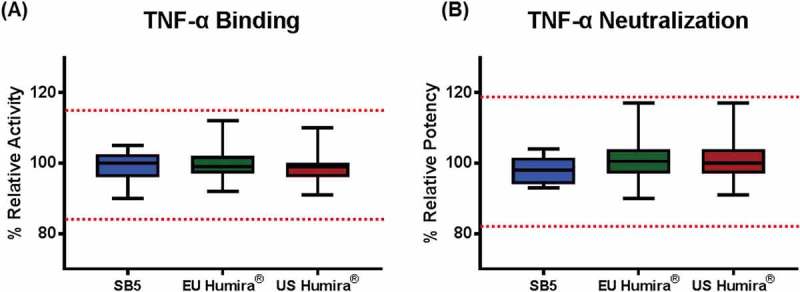
Biological activities comparison of SB5 and the reference product with similarity range.
(A) TNF binding; Results from 13 batches of SB5, 41 lots of EU Humira®, and 40 lots of US Humira® are presented as mean ± 1SD. (B) TNF neutralization; Results from 13 batches of SB5, 40 lots of EU Humira®, and 35 lots of US Humira® are presented as box plot with min/max whiskers.
Potency was determined by a cell-based luciferase reporter gene assay. The assay used a 293-NF-κB-Luc cell line, which contains a NF-κB binding sequence upstream to the luciferase reporter gene. In this system, binding of adalimumab to TNF neutralizes TNF, resulting in inhibition of NF-κB pathway and thus reduced luciferase gene expression. Relative neutralizing activities for SB5 and the reference products were within the established similarity range, demonstrating high similarity in potency (Figure 12B).
Structure-activity relationship study
A SAR study is used to demonstrate the relationship between a physicochemical quality attribute and related biological activity. SAR studies are useful to demonstrate whether a quality attribute is critical or not. Results from SAR studies can be used to justify criticality of a quality attribute to evaluate the similarity and the difference between a biosimilar and its reference product. In the case of SB5 and the reference product, SAR studies were performed for two kinds of variation, NGHC and charge variants.
The reducing CE-SDS method showed that NGHC level was slightly higher in SB5 than in the reference product. This finding was in alignment with non-reducing CE-SDS, which demonstrated higher levels of non-glycosylated IgG (NG-IgG) in SB5 than in the reference product. In addition, the different level of NGHC was confirmed by peptide mapping analysis. The effect of the NGHC content on biological activities was evaluated by conducting FcRn binding, TNF binding, FcγRIIIa binding, and ADCC assays. Experimentally, varying levels of NGHC (%NGHC) were attained by mixing PNGase F-treated samples with untreated samples at different proportions. %NGHC was measured by reducing CE-SDS. The small difference in %NGHC between SB5 and the reference product would not cause any meaningful difference in biological activity, based on the SAR study results on FcRn binding, TNF binding, FcγRIIIa binding, and ADCC activities (data not shown).
Charge variants of SB5 and the reference product were fractionated by CEX-HPLC (Figure 13), and each fraction was analyzed by biological assays such as TNF binding activity and CDC activity. The results showed that there were no significant differences in the biological assays among all fractions (Figure 14). The major difference between main peak and basic peaks was identified as the lysine variants on C-terminus of the heavy chain. Through comparative CEX-HPLC and icIEF studies using carboxypeptidase B (CPB), confirmed that the difference in charge variant profiles is mainly due to differences in sialic acid and C-terminal lysine variants (Figures 10 and 11). The most substantial difference between the charge variants of SB5 and the reference product was observed in basic variants, caused by different level of C-terminal lysine variant. In vitro removal of the C-terminal lysine (Lys) with CPB elucidated that the difference in basic profile between SB5 and the reference product was primarily due to the extent to which the C-terminal Lys had been removed through the production process. The removal of C-terminal Lys, however, has been reported to not affect effector function, at least in vitro.23,24 In order to verify elimination of C-terminal Lys reside after CPB treatment, peptide mapping using LC-MS/MS was performed on SB5 and the reference product. Both SB5 and the reference product contained C-terminal Lys residue below the detection limit after the treatment of CPB (Table 4). To evaluate the effect of the C-terminal Lys heterogeneity on biological activities, TNF binding, FcRn, and ADCC assays were performed (Figure 15). The biological activities of SB5 and the reference product variants with or without C-terminal Lys were not significantly different. It can be concluded that C-terminal heterogeneity has no effect on the biological activity of both SB5 and the reference product.
Figure 13.

Fractionation profile of SAR study for charge variants.
Fractionated peaks of SB5 (upper panel) and the reference product (lower panel) by CEX-HPLC.
Figure 14.
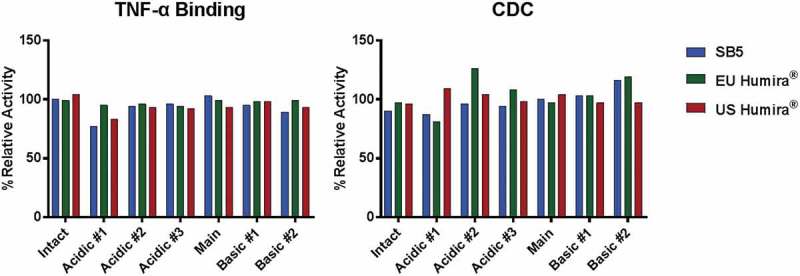
Biological activities comparison of fractionated SB5 and the reference product.
TNF binding activity per fractions for charge variants of adalimumab (left) and CDC activity per fractions for charge variants of adalimumab (right). Results from 1 batch of SB5, 1 lot of EU Humira®, and 1 lot of US Humira® are presented.
Figure 10.
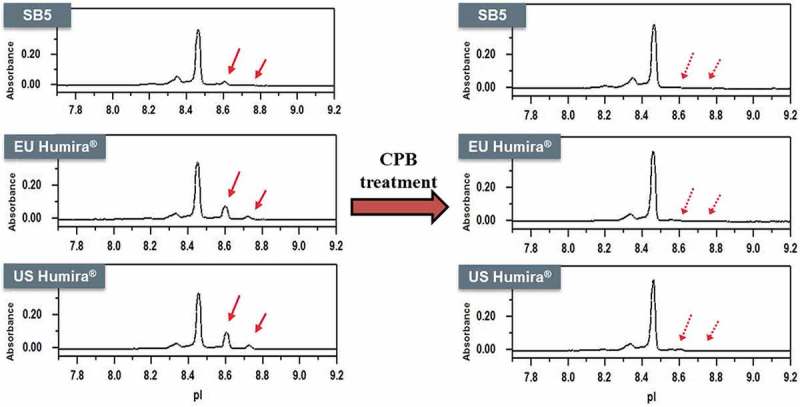
Charge variant comparison of SB5 and the reference product by icIEF.
Intact (left) and CPB treated (right) CEX profile of SB5 and the reference product. Red arrows show the removal of the C-terminal Lys with CPB treatment.
Figure 11.
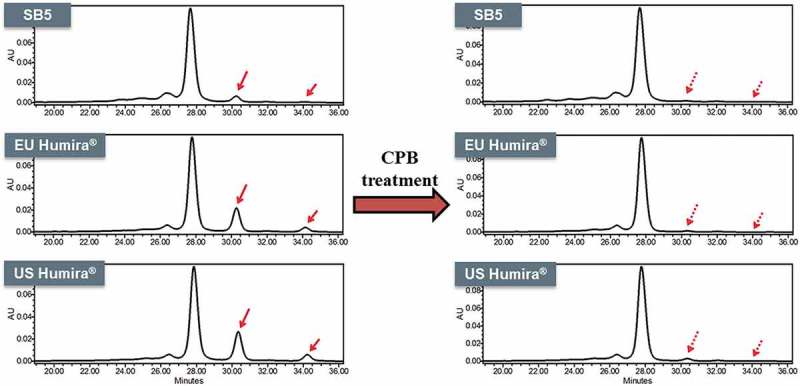
Charge variant comparison of SB5 and the reference product by CEX-HPLC.
Intact (left) and CPB treated (right) CEX profile of SB5 and the reference product. Red arrows show the removal of the C-terminal Lys with CPB treatment.
Table 4.
Detected masses and relative levels of C-terminal peptide for CPB with/without samples.
| Sample | Lys Deleted C-terminus (SLSLSPG) |
Intact C-terminus (SLSLSPGK) |
|||
|---|---|---|---|---|---|
| Detected Mass (Da) | %Relative Areaa | Detected Mass (Da) | %Relative Areaa | ||
| SB5 | CPB (-) | 659.35 | 98.2 | 787.44 | 1.8 |
| CPB (+) | 659.35 | 100.0 | N/Db | N/Ac | |
| EU reference product | CPB (-) | 659.35 | 92.4 | 787.44 | 7.6 |
| CPB (+) | 659.35 | 100.0 | N/D | N/A | |
| US reference product | CPB (-) | 659.35 | 94.2 | 787.44 | 5.8 |
| CPB (+) | 659.35 | 100.0 | N/D | N/A | |
a The relative level of each peptide was determined by calculating the percentage area of integrated intensity for expected mass of each variant. b Not detected. Lower limit of detection. c Not applicable.
Figure 15.

Biological activities comparison of CPB or SA treated SB5 and the reference product.
TNF binding activity of CPB or SA treated adalimumab (left) and FcRn binding activity of CPB or SA treated adalimumab (right). Results from 3 batches of SB5, 2 lots of EU Humira®, and 2 lots of US Humira® are presented as mean ± 1SD.
Discussion
SB5 is a biosimilar product to the reference product of adalimumab (Humira®). Similarity of SB5 has been established in a comprehensive characterization study. The CQAs for similarity were established based on risk assessment in terms of safety, efficacy, immunogenicity, and PK/PD.6,7 Extensive characterization analyses were conducted on representative batches of EU and US sourced Humira®, and SB5 to demonstrate both head-to-head comparisons and within the predefined similarity ranges.
In-depth characterization analysis was conducted for comparison with 120 samples tested, which included the reference products and the SB5 materials. The SB5 materials and the reference products were evaluated for similarity between SB5 and the reference product by various analytical methods for primary and higher-order structures, post-translational modifications (PTMs), glycosylation, heterogeneities associated with structure, physicochemical properties, and biological properties. The similarity between SB5 and the reference product was assessed based on the similarity range of critical quality attributes, and these ranges were statistically established with multiple lots of the reference product.25 Most of the structural, physicochemical, and biological characterization results from suitable analytical methods demonstrated that SB5 is highly similar to the reference products and within the predefined similarity range.
In terms of primary structure, amino acid sequence and modification were demonstrated by intact mass and peptide mapping analysis using mass spectrometry. It was confirmed that the primary amino acid sequence was identical, and modifications were similar between SB5 and the reference product. SB5 contained the same N-glycan species, but lacked M4. To determine 3-dimensional structural similarity, the butterfly plots of H/DX-MS showed that SB5 and the reference product were highly similar in terms of solvent accessibility. CD, FTIR and DSC results also showed similar profiles between SB5 and the reference product. These results demonstrated a high degree of higher order structural similarity. The %HMW impurities as determined by SE-HPLC were shown to be highly similar between SB5 and the reference product. The %IgG and %Main were determined by CE-SDS, with non-reduced samples and reduced samples, respectively. The purity, %IgG and %Main by CE-SDS, are highly similar between SB5 and the reference product. The highest impurity by non-reducing CE-SDS, %2H1L was also similar between SB5 and the reference product.
A few differences in quality attributes were observed between SB5 and the reference product (e.g., differences in NGHC levels and differences in charge heterogeneity). The results of SAR studies showed that these differences do not negatively influence the key indicators of biological activities of the biosimilar.
It is known that different charged species variants of adalimumab are present in Humira® and its biosimilars.26–28 One of the approved Humira® biosimilars reported higher acidic and lower basic variants levels than those of Humira®.29,30 SB5 also showed a slightly higher acidic variants level and a lower basic variants level compared to the reference product.
In order to assess the impact of the differences between SB5 and the reference product, the variants present in the fractions of different charged species were identified and studied for biological activity as part of the SAR studies. For identification of the charged variants, samples can be fractionated using liquid phase isoelectric focusing (IEF) and CEX-HPLC; however, biological assays are not possible with IEF fractions, due to the reagents for the analysis, such as 8M urea and SDS. CEX-HPLC was conducted to fractionate and investigate the charge heterogeneity of SB5 and of the reference product. Each fraction was analyzed using intact mass and peptide mapping analysis. Intact mass analysis was performed to determine glycation, C-terminal lysine variant, and other PTMs including fragmentation. Peptide mapping was performed to determine sialylation, oxidation, deamidation, α-amidation, N-terminal pyro-E, and C-terminal lysine variant. Results from intact mass analysis showed that identical molecular weight of the intact form was observed in all fractions of SB5 and the reference product, considering assay variability. Results from peptide mapping showed that similar levels of oxidation, deamidation, and N-terminal pyro-E form were observed in all fractions of SB5 and the reference product, considering assay variability. There is no significant difference between fractions of SB5 and reference products in terms of the level of those PTMs.
Lysine on C-terminus of the heavy chain was identified as the main difference in the basic fractions. SAR study results for the lysine variants showed that the basic variants have no effect on the biological activities of both SB5 and the reference product.
In the acidic fraction, samples were identified as containing sialylated N-glycan peptides using LC-MS/MS. In alignment with SAR study results for acidic charge variant, %Charged glycan (%sialylation) level by 2-AB labelled N-glycan analysis in SB5 (2.3–3.5%) was slightly higher than that in the reference product (0.2–0.7%). It was concluded that this result was caused by the terminal sialic acid on N-glycan species. It is known that terminal sialic acid increases serum half-life of such sialylated serum glycoproteins.31 Sialylated Fc glycans of antibodies have been shown to negatively influence proteolytic resistance and Fc-specific effector functions.32 As a result, antibodies with terminal sialic acid can cause a negative impact on ADCC activity, due to either reduced FcγRIIIa binding on natural killer cells or lower affinity binding to cell-surface antigens.33 However, a SAR study was performed to rule out any negative effects of the difference in charged on the efficacy of adalimumab. The results demonstrated that there was no difference in FcRn binding, TNF binding, and ADCC activity between sialylated and non-sialylated adalimumab prepared by SA treatment (Figure 15). It can be concluded that %Charged glycan has no effect on the biological activities of both SB5 and the reference product. In summary, the minor differences in acidic variants and basic variants would not be expected to affect the efficacy and safety of SB5 and the reference product.
Finally, SB5 showed similar efficacy in terms of TNF binding and neutralizing potency. TNF-induced inflammatory signaling has been implicated as a major driver of inflammation in diseases for which adalimumab is indicated. The main MOA of adalimumab, binding to TNF, as well as TNF-neutralizing potency, were found to be highly similar between SB5 and the reference product.
In conclusion, the analytical similarity between SB5 and the reference product has been extensively addressed in accordance with the relevant regulatory guidelines. The similarity studies addressed the primary, secondary, and tertiary structures, post-translational modifications, purity/impurity profile, as well as biological activity. Some differences in quality attributes were observed, these differences have, however, been sufficiently discussed and justified not to be of clinical relevance. The results described herein are a part of the totality of evidence concerning the overall similarity in quality, clinical efficacy, and safety of SB5 that has been approved by the EC and MFDS under the brand names of Imraldi® and Hadlima®.
Materials and methods
Materials
More than 100 lots of Humira® (40 mg/0.8 mL pre-filled syringe, Abbvie Inc.), sourced from the EU and the US were procured and stored according to the manufacturer’s instructions. For similarity ranges, 6 to 46 EU-Humira® and 5 to 45 US Humira® were used. The EU-, US-, and KR-Humira® were also used as side-by-side test samples and the reference standard for the bioassays. The reference products used for side-by-side test and SAR study were not included in establishment of the similarity ranges. All available batches of SB5 at time of testing were used for the similarity assessment.
Statistical analysis
Comparisons between groups were performed using the pre-defined similarity ranges for the quality attributes assessed in the study. The similarity ranges were established with the available analysis results from the reference products by appropriate one sided or two-sided statistical tolerance interval approach (mean ± kSD) covering a specified confidence level and proportion of population. Depending on the test item, different numbers of Humira® lots were used to establish the similarity ranges of each of EU and US Humira®. The similarity assessments for some quality attributes used raw data/graphical comparison, not the established similarity ranges.
Peptide mapping
To achieve denaturation and reduction, each sample (200 µg) was mixed with 8 M urea and 2 µL of 1 M dithiothreitol (final volume, 200 µL). The sample was digested with trypsin (Roche, 11,047,841,001) or Lys-C (Roche, 11,047,825,001). For N-glycosylation site analysis, deglycosylation of samples with PNGase F (NEB, P0704L) were subsequently digested with Asp-N (Roche, 11054589001). For the disulfide analysis, the reducing step was not performed, and the non-reduced sample was digested with trypsin.
The digestion products underwent reverse-phase UPLC-MS using a BEH300 C18 column (Waters, 186003687/1.7 µm, 2.1 mm × 150 mm) at 60°C. Peptides were eluted by a linear gradient of 0%-35% of mobile phase B (mobile phase A, 0.1% formic acid in water; mobile phase B, 0.1% formic acid in acetonitrile) at a flow rate of 0.3 mL/min for 100 minutes and analyzed by the Synapt-G2 system. Data were collected and processed by MassLynx (Waters) v4.1 and/or BiopharmaLynx (Waters) v1.2.
Circular dichroism spectroscopy
10 mM sodium citrate buffer was used to dilute the far-UV CD samples. Formulation buffers for SB5 and the reference product were used to dilute their respective near-UV CD samples. CD measurements were performed using a Jasco CD Spectrophotometer with 0.1 cm path length cells for far-UV and 0.5 cm path length cells for near-UV. The observed CD data in ellipticity for each sample was blank-subtracted and average of the triplicate scans was smoothed and used to make the CD plot. CDNN algorithm was used to fit the CD data for prediction of secondary structure.
Fourier transform infrared spectroscopy
Each sample was applied to the attenuated total reflectance (ATR) crystal. The FTIR spectra were recorded on a Nicolet 4700 FTIR (Thermo Scientific) equipped with a Smart Orbit diamond attenuated total reflectance (ATR) accessory. The OMNIC software package was used for spectrometer control and data analysis. Sample spectra were partitioned into peak areas according to structural contribution, and the results averaged over three replicates per sample.
Differential scanning calorimetry
Nano DSC (TA Instrument) was used to analyze the melting temperature of samples. The sample and the corresponding buffer were heated from 15°C to 105°C (heating rate of 1.5°C/min). The μ-DSC cell was pressurized to prevent boiling during heating. Samples were diluted to a concentration of ~ 0.5 mg/mL in the placebo buffer prior to the run. To determine the baseline value, reference and sample cells were filled with water and scanned twice from 15°C to 105°C to build the thermal history of the µ-DSC cells. Subsequently, the sample was analyzed, with the reference cell filled with formulation buffer and the sample cell filled with the formulation. The baseline value was subtracted from each measurement. Thermal data were normalized for protein concentration. The Tm of the protein was determined from the heating scan. Data were analyzed by TA instrument NanoAnalyze software.
Hydrogen/deuterium exchange-mass spectrometry
H/DX-MS was adapted to compare higher order structure between samples. Samples were dialyzed in 25 mM sodium phosphate and 100 mM NaCl, pH 6.3, and brought to a concentration of 2.5 mg/mL. H/DX-MS was initiated by a 1:10 dilution of sample in D2O buffer at intervals of 10 seconds, 1 minute, 10 minutes, 1 hour, and 4 hours before quenching and injecting into the mass spectrometer. Peptides were digested on an immobilized pepsin column, and the trapped peptide fragments were eluted by a gradient of 5% to 95% acetonitrile in 15 minutes. Mass spectra were collected in MSE mode, and data were analyzed by ProteinLynx Global Server™ (PLGS, Waters) to identify peptides and by DynamX software (Waters) to calculate deuterium uptake and to generate butterfly and difference plots.
Glycosylation profile by 2-AB labelling and HILIC-UPLC analysis
For quantitative determinations, 100 μg of sample was denatured in sodium dodecyl sulfate and dithiothreitol, and treated with PNGase F for about 10 min to release N-glycans. They were precipitated in cold ethanol, and the supernatant was dried. The precipitated N-glycans were then labelled with 2-AB for 3 hours. Samples were injected onto a UPLC BEH glycan column (2.1 mm × 150 mm, 1.7 μm). The labelled N-glycans were separated at a flow rate of 0.5 mL/min with mobile phase A (50 mM ammonium formate) and mobile phase B (100% acetonitrile). The signal was detected by a fluorescence detector at an excitation wavelength of 330 nm and an emission wavelength of 420 nm.
Detection and quantitation of total sialic acids
The TSA, including N-acetylneuraminic acid (NANA) and N-glycolylneuraminic acid (NGNA), in each sample was evaluated by ion exclusion chromatography. Each standard of NANA and NGNA was analyzed separately alongside the carbohydrate sample. The sample was hydrolyzed by adding 0.1 N sulfuric acid at 80°C for 1 hour. NANA and NGNA were isocratically separated on a Rezex RHM-monosaccharide column (00H-0130-K0/300 × 7.8 mm) and were monitored with a UV detector (SHIMADZU; λ = 206 nm) using Empower™3 software with integration capabilities. The amounts of NANA and NGNA were calculated on the basis of the calibration curves generated from data for NANA and NGNA standards and were presented as the molar total sialic acid amount per mole of a polypeptide chain.
Size-exclusion chromatography
Sample (100 µg) was directly injected onto a TSK-GEL G3000SWXL analytical column (Tosoh, 008541, 5 µm/7.8 mm × 300 mm) at 25°C, which was connected to a Waters HPLC system; monitoring was done by ultraviolet (UV) detection (λ = 280 nm). A mobile phase consisting of 100 mM sodium phosphate and 200 mM sodium chloride, pH 6.8, was used. The flow rate was 0.5 mL/min, and monomer and impurities were detected at a UV wavelength of 280 nm. Data were acquired and processed by Empower™3 (Waters) software.
Capillary electrophoresis-sodium dodecyl sulfate
Reducing and non-reducing CE-SDS analyses were conducted with a high-performance capillary electrophoresis system (PA 800 plus Pharmaceutical Analysis System; Beckman coulter). For the reducing condition, sample (200 µg) was mixed with 2 µL of a 10 kDa internal standard, 91 µL of SDS-MW sample buffer (Beckman coulter, A10663), and 5 µL of 2-mercaptoethanol and then boiled at 70°C for 5 minutes. For the non-reducing condition, 2-mercaptoethanol was replaced with iodoacetamide. The sample was electrokinetically introduced onto a capillary (Beckman Coulter, bare fused-silica capillary, 50 µm/30.2 cm) by applying voltage at −5 kV for 20 seconds and was separated in the capillary cartridge. Electrophoresis was performed at a constant voltage with an applied field strength of −497 volts and monitored by UV detection (λ = 220 nm) through the capillary window and aperture (Beckman Coulter, 144712, 100 × 200 µm). Data were acquired and processed by 32 Karat software with integration capabilities.
Imaged capillary isoelectric focusing
Each 60 µg of sample was mixed with 4 µL of pharmalyte 3–10, 8 µL of pharmalyte of pH 8–10.5, 70 µL of 1% methyl cellulose, 115 µL of distilled water, 1 µL of pI 6.61 marker, and 2 µL of pI 9.5 marker. 201.2 µL among total mixture were loaded onto ICE3 icIEF instrument using capillary cartridge at 4°C. 0.08M H3PO4 and 0.1M NaOH were used as an anolyte and a catholyte, respectively. Data were acquired and processed by Chrom Perfect software.
Cation exchange chromatography
CEX analysis was used as an orthogonal method to icIEF for the assessment of charge variants. CEX analysis was performed with a MAbPac SCX-10 (ThermoScientific, 4.0 mm × 250 mm) connected to a Waters HPLC/UV system. A 50-µg sample was digested by SA and/or CPB (if needed) and then injected. The flow rate was 0.8 mL/min, UV detection was carried out at a wavelength of 280 nm. UV detection was carried out at a wavelength of 280 nm. Data were acquired and processed by Empower™3 (Waters) software. Results were reported as relative percent charge variants (e.g., % of acidic variants, % of main peak, and % of basic variants).
TNF binding assay
TNF binding activities of adalimumab samples were determined by FRET-based competitive inhibition binding assay. Adalimumab was labeled with fluorescent Europium chelate (PerkinElmer) and TNF was labeled with Cy5 fluorophore. A dilution series of unlabeled adalimumab sample competed against Europium-labeled adalimumab binding to Cy5-labeled TNF, inhibiting the signal of fluorescence. After incubation at ambient temperature with moderate agitation, the assay plate was read by a microplate reader using time-resolved fluorimetry (EnVision™, PerkinElmer). Measured fluorescence was inversely proportional to the binding of unlabeled adalimumab samples. Data were analyzed using Parallel Line Analysis (PLA) software (Stegmann Systems).
TNF neutralization assay
Inhibitory activity of adalimumab samples on the soluble TNF signaling pathway was measured through the TNF neutralization assay using a 293-NF-κB-luc cell line. The 293-NF-κB-luc cell line was engineered to contain NF-κB response element upstream to the luciferase reporter gene. Mediated by TNF binding to cell surface receptor, signal cascade activating NF-κB in turn promoted the expression of the luciferase reporter gene. Serially diluted samples were pre-incubated with TNF (National Institute for Biological Standards and Control, UK) at ambient temperature in a white 96-well plate. Following incubation, cells were transferred to wells in the assay plate, and were incubated for 24 hours. TNF neutralization potency was determined by a luminescent signal using the Steady-Glo® Luciferase Assay System (Promega) on a microplate reader (EnVision™, PerkinElmer). Data were analyzed using PLA software (Stegmann Systems).
FcγRIIIa binding assay by Alphascreen®
FcγRIIIa binding activity of adalimumab samples were determined by the AlphaScreen®-based binding assay. AlphaScreen® acceptor beads were coated with human IgG1 mAb and donor beads were coated with reduced glutathione (GSH) (PerkinElmer). FcγRIIIa was tagged with Glutathione-S-Transferase (GST). Serially diluted adalimumab samples were incubated with GST-tagged receptor solution, GSH donor beads and IgG1-conjugated acceptor beads at ambient temperature for 2 hours with moderate agitation. Luminescent signal, which is inversely proportional to Fc binding activity, was measured on a microplate reader (PerkinElmer). Data were analyzed using Parallel Line Analysis (PLA) software (Stegmann Systems).
Neonatal Fc receptor (FcRn) binding assay by Alphascreen
FcRn binding activities of SAR study sample were determined by the AlphaScreen®-based binding assay. AlphaScreen® acceptor beads were coated with hIgG1 and donor beads were coated with streptavidin (PerkinElmer). FcRn were labeled with biotin. Serially diluted samples were incubated with biotin-FcRn solution, streptavidin donor beads and IgG1-conjugated acceptor beads at ambient temperature for 1.5 hours with moderate agitation. Luminescent signal, which is inversely proportional to FcRn binding activity, was measured on a microplate reader (Perkin Elmer). Data were analyzed using Parallel Line Analysis (PLA) software (Stegmann Systems).
Antibody-dependent cell-mediated cytotoxicity
ADCC activities of adalimumab samples were determined using 3T3-mTNF (Biogen) as a target cell line and NK92-CD16 (Biogen), a human natural killer cell line expressing CD16, as an effector cell line. Serially diluted samples were incubated with 3T3-mTNF cells and NK92-CD16 cells for 4 hours. Following incubation, a luminescent signal using the CytoTox-Glo Cytotoxicity assay (Promega) was measured on a microplate reader (EnVision™, PerkinElmer). Data were analyzed using Parallel Line Analysis (PLA) software (Stegmann Systems).
Complement-dependent cytotoxicity
CDC activities of SAR study samples were determined using a Jurkat-mTNF cell line (Kyushu University), which overexpresses human tmTNF. Serially diluted samples were incubated with Jurkat-mTNF cells and human serum for 4 hour. Following incubation, a luminescent signal using the CytoTox-Glo Cytotoxicity Assay (Promega) was measured on a microplate reader (EnVision™, PerkinElmer). Data were analyzed using Parallel Line Analysis (PLA) software (Stegmann Systems).
Acknowledgments
This work was funded by Samsung Bioepis Co., Ltd. We are grateful to Jaewoong Hwang and Jae-il Lee (Samsung Bioepis) for sharing pearls of wisdom through internal review of the manuscript.
Disclosure statement
Published with license by Taylor & Francis Group, LLC © Samsung Bioepis. This is an Open Access article distributed under the terms of the Creative Commons Attribution-Non-Commercial License (http://creativecommons.org/licenses/by-nc/3.0/), which permits unrestricted non-commercial use, distribution, and reproduction in any medium, provided the original work is properly cited. The moral rights of the named author(s) have been asserted.
Abbreviations
- 2-AB
2-aminobenzamide
- ADCC
antibody-dependent cell-mediated cytotoxicity
- CD
circular dichroism
- CDC
complement-dependent cytotoxicity
- CE-SDS
capillary electrophoresis-sodium dodecyl sulfate
- CEX-HPLC
cation exchange–high-performance liquid chroma-tography
- CPB
carboxypeptidase B
- CQA
critical quality attribute
- DLS
dynamic light scattering
- DSC
differential scanning calorimetry
- EC
European Commission
- EMA
European Medicines Agency
- EU
European Union
- FDA
Food and Drug Administration
- FRET
fluorescence resonance energy transfer
- FTIR
Fourier transform infrared spectroscopy
- HC
heavy chain
- H/DX
hydrogen/deuterium exchange
- HIC
hydrophobic interaction chromatography
- HILIC
hydrophilic interaction liquid chromatography
- HM
high mannose
- HMW
high molecular weight
- HPLC
high-performance liquid chromatography
- icIEF
imaged capillary isoelectric focusing
- KR
Korea
- LC
light chain
- LC-ESI-MS/MS
liquid chromatography-electrospray ionization-tandem mass spectrometry
- LC/MS
liquid chromatography-mass spectrometry
- LMW
low molecular weight
- LTα
lymphotoxin α
- MALLS
multi-angle laser light scattering
- MFDS
Ministry of Food and Drug Safety
- MFI
micro-flow imaging
- MOA
mode of action
- MS
mass spectrometry
- MS/MS
tandem mass spectrometry
- mTNF
membrane-bound tumor necrosis factor
- NANA
N-acetylneuraminic acid
- NGNA
N-glycolylneuraminic acid
- pyro-E
Pyroglutamate
- SA
sialidase A
- SAR
structure-activity relationship
- SE-HPLC (SEC)
size exclusion–high-performance liquid chromatography
- SPR
surface plasmon resonance
- SV-AUC
sedimentation velocity analytical ultracentrifugation
- TNF
tumor necrosis factor
- TNFR
tumor necrosis factor receptor
- TSA
total sialic acid
- UPLC
ultra-performance liquid chromatography
- US
United States
- UV
ultraviolet
References
- 1.Weise M, Bielsky MC, De Smet K, Ehmann F, Ekman N, Narayanan G, Heim H-K, Heinonen E, Ho K, Thorpe R, et al. Biosimilars-why terminology matters. Nat Biotechnol. 2011;29:690–693. doi: 10.1038/nbt.1936. [DOI] [PubMed] [Google Scholar]
- 2.Beck A, Wurch T, Bailly C, Corvaia N.. Strategies and challenges for the next generation of therapeutic antibodies. Nat Rev Immunol. 2010;10:345–352. doi: 10.1038/nri2747. [DOI] [PubMed] [Google Scholar]
- 3.US Food and Drug Administration Biologics price competition and innovation [Internet]. Silver Spring (MD): US Food and Drug Administration; [accessed 2016. January 20]. http://www.fda.gov/downloads/Drugs/GuidanceComplianceRegulatoryInformation/ucm216146.pdf. [Google Scholar]
- 4.European Medicines Agency, Committee for Medicinal Products for Human Use Guideline on similar biological medicinal products containing biotechnology-derived proteins as active substance: quality issues (revision 1) [Internet]. London (UK): European Medicines Agency; [Updated 2014. May 22; accessed 2016 Feb 05]. http://www.ema.europa.eu/docs/en_GB/document_library/Scientific_guideline/2014/06/WC500167838.pdf. [Google Scholar]
- 5.European Medicines Agency, Committee for Medicinal Products for Human Use Guideline on similar biological medicinal products [Internet]. London (UK): European Medicines Agency; [Adopted on 2014. October 23; accessed 2016 Feb 05]. http://www.ema.europa.eu/docs/en_GB/document_library/Scientific_guideline/2014/10/WC500176768.pdf. [Google Scholar]
- 6.European Medicines Agency Human medicines European public assessment report (EPAR): imraldi [Internet]. London (UK): European Medicines Agency; [Available on 2017. June 22; accessed 2017 Aug 31]. http://www.ema.europa.eu/ema/index.jsp?curl=pages/medicines/human/medicines/004279/human_med_002147.jsp&mid=WC0b01ac058001d124. [Google Scholar]
- 7.European Medicines Agency Committee for Medicinal Products for Human Use. Summary of opinion: imraldi [Internet]. London (UK): European Medicines Agency; [Available on 2017. June 22; accessed 2016 Jun 23]. http://www.ema.europa.eu/docs/en_GB/document_library/Summary_of_opinion_-_Initial_authorisation/human/004279/WC500229906.pdf. [Google Scholar]
- 8.Tracey D, Klareskog L, Sasso EH, Salfeld JG, Tak PP.. Tumor necrosis factor antagonist mechanisms of action: A comprehensive review. Pharmacol Ther. 2008;117:244–279. doi: 10.1016/j.pharmthera.2007.10.001. [DOI] [PubMed] [Google Scholar]
- 9.AbbVie Inc HUMIRA (adalimumab) injection, full prescribing information. [accessed 2017]. http://www.rxabbvie.com/pdf/humira.pdf.
- 10.International Conference on Harmonisation of Technical Requirements for Registration of Pharmaceuticals for Human Use. ICH Tripartite Guideline Specifications: test procedures and acceptance criteria for biotechnological/biological products Q6B [Internet]. [Recommended for adoption on March 10, 1999 accessed 2016. January 20]. http://www.gmp-compliance.org/guidemgr/files/3-1-17.pdf.
- 11.US Food and Drug Administration Guidance for industry: quality considerations in demonstrating biosimilarity of a therapeutic protein product to a reference product [Internet]. Silver Spring (MD): US Food and Drug Administration; [Available April 2015; accessed 2016 Jan 20]. http://www.fda.gov/downloads/drugs/guidancecomplianceregulatoryinformation/guidances/ucm291134.pdf. [Google Scholar]
- 12.Schiestl M, Stangler T, Torella C, Cepeljnik T, Toll H, Grau R. Acceptable changes in quality attributes of glycosylated biopharmaceuticals. Nat Biotechnol. 2011;29(4):310–312. doi: 10.1038/nbt.1839. [DOI] [PubMed] [Google Scholar]
- 13.European Medicines Agency, Committee for Medicinal Products for Human Use Guideline on similar biological medicinal products [Internet]. London (UK): European Medicines Agency; [Adopted on 2014 Oct 23; accessed 2016. February 05]. http://www.ema.europa.eu/docs/en_GB/document_library/Scientific_guideline/2014/10/WC500176768.pdf. [Google Scholar]
- 14.Liu H, May K. Disulfide bond structures of IgG molecules: structural variations, chemical modifications and possible impacts to stability and biological function. mAbs. 2012;4(1):17–23. doi: 10.4161/mabs.4.1.18347. [DOI] [PMC free article] [PubMed] [Google Scholar]
- 15.Li CH, Nguyen X, Narhi L, Chemmalil L, Towers E, Muzammil S, Gabrielson J, Jiang Y. Applications of circular dichroism (CD) for structural analysis of proteins: qualification of near- and far-UV CD for protein higher order structural analysis. J Pharm Sci. 2011;100(11):4642–4654. doi: 10.1002/jps.22695. [DOI] [PubMed] [Google Scholar]
- 16.Thiagarajan G, Semple A, James JK, Cheung JK, Shameem M. A comparison of biophysical characterization techniques in predicting monoclonal antibody stability. mAbs. 2016;8(6):1088–1097. doi: 10.1080/19420862.2016.1189048. [DOI] [PMC free article] [PubMed] [Google Scholar]
- 17.Houde D, Berkowitz SA, Engen JR. The utility of hydrogen deuterium exchange mass spectrometry in biopharmaceutical comparability studies. J Pharm Sci. 2011;100:2071–2086. doi: 10.1002/jps.22432. [DOI] [PMC free article] [PubMed] [Google Scholar]
- 18.Varki A, Cummings R, Esko J, Freeze H, Hart G, Marth J, editors. Essentials of Glycobiology, 3rd edition. (Chapter 10). Cold Spring Harbor Laboratory Press; 2017. [PubMed] [Google Scholar]
- 19.Shin D, Lee Y, Kim H, Körnicke T, Fuhr R. A randomized phase I comparative pharmacokinetic study comparing SB5 with reference adalimumab in healthy volunteers. J Clin Pharm Ther. 2017. December;42(6):672–678. doi: 10.1111/jcpt.12583. [DOI] [PubMed] [Google Scholar]
- 20.Weinblatt ME, Baranauskaite A, Dokoupilova E, Zielinska A, Jaworski J, Racewicz A, Pileckyte M, Jedrychowicz-Rosiak K, Baek I, Ghil J. Switching from reference adalimumab to SB5 (adalimumab biosimilar) in patients with rheumatoid arthritis: fifty-Two-Week Phase III Randomized Study Results. Arthritis Rheumatol. 2018. June;70(6):832–840. doi: 10.1002/art.40444. [DOI] [PMC free article] [PubMed] [Google Scholar]
- 21.Leslie AK, Sirj G, Ryan H, Kwong ZW, Yang J, Wang X, Yao Z, Sreedhara A, Cano T, Tesar D, et al. Charge variants in IgG1. mAbs. 2010;2(6):613–624. doi: 10.4161/mabs.2.6.13333. [DOI] [PMC free article] [PubMed] [Google Scholar]
- 22.Tracey D, Klareskog L, Sasso EH, Salfeld JG, Tak PP. Tumor necrosis factor antagonist mechanism of action: A comprehensive review. Pharmacol Ther. 2008;117:244–279. doi: 10.1016/j.pharmthera.2007.10.001. [DOI] [PubMed] [Google Scholar]
- 23.Kaschak T, Boud D, Lu F, Derfus G, Kluck B, Nogal B, Emery C, Summers C, Zheng K, Bayer R, et al. Characterization of the basic charge variants of a human IgG1. mAbs. 2011;3(6):577–583. doi: 10.4161/mabs.3.6.17959. [DOI] [PMC free article] [PubMed] [Google Scholar]
- 24.Antes B, Amon S, Rizzi A, Wiederkum S, Kainer M, Szolar O, Fido M, Kircheis R, Nechansky A. Analysis of lysine clipping of a humanized Lewis-Yspecific IgG antibody and its relation Fc-mediated effector function. J Chromatogr B. 2007;852:250–256. doi: 10.1016/j.jchromb.2007.01.024. [DOI] [PubMed] [Google Scholar]
- 25.Howe WG. Two-sided tolerance limits for normal populations-some improvements. J Am Stat Assoc. 1969;64(326):610–620. [Google Scholar]
- 26.Paul WT, Amy V, Michael N, Jerry C, Jaap V. Consistency of quality attributes for the glycosylated monoclonal antibody Humira® (adalimumab). mAbs. 2015;7(5):805–811. doi: 10.1080/19420862.2015.1073429. [DOI] [PMC free article] [PubMed] [Google Scholar]
- 27.Laurent M, Angelo P, Christele F, Fabio D, Mariagrazia T, Mara R, Laurent C. Demonstration of physicochemical and functional similarity between the proposed biosimilar adalimumab MSB11022 and Humira®. mAbs. 2017;9(1):127–139. doi: 10.1080/19420862.2016.1259046. [DOI] [PMC free article] [PubMed] [Google Scholar]
- 28.Gabbani T, Deiana S, Bagnoli S, Annese V. Development, safety, and efficacy of biosimilar adalimumab: thedata so far. Biosimilars. 2016;6:1–7. [Google Scholar]
- 29.Jennifer L, Tamer E, Cynthia L, Shawn C, Scott K. Assessing Analytical Similarity of Proposed Amgen Biosimilar ABP 501 to Adalimumab. BioDrug. 2016;30:321–338. doi: 10.1007/s40259-016-0184-3. [DOI] [PMC free article] [PubMed] [Google Scholar]
- 30.US Food and Drug Administration, FDA Briefing Document Arthritis advisory committee meeting: BLA 761024, ABP 501, a proposed biosimilar to Humira (adalimumab). [accessed 2016. July 12]. https://www.fda.gov/downloads/advisorycommittees/committeesmeetingmaterials/drugs/arthritisadvisorycommittee/ucm510293.pdf.
- 31.Stockert RJ. The asialoglycoprotein receptor: relationships between structure, function and expression. Physiol Rev. 1995;75(3):591–609. doi: 10.1152/physrev.1995.75.3.591. [DOI] [PubMed] [Google Scholar]
- 32.Raju TS. Terminal sugars of Fc glycans influence antibody effector functions of IgGs. Curr Opin Immunol. 2008;20(4):471–478. doi: 10.1016/j.coi.2008.06.007. [DOI] [PubMed] [Google Scholar]
- 33.Scallon BJ, Tam SH, McCarthy SG, et al. Higher levels of sialylated Fc glycans in immunoglobulin G molecules can adversely impact functionality. Mol Immun. 2007;44(7):1525–1534. doi: 10.1016/j.molimm.2006.09.005. [DOI] [PubMed] [Google Scholar]


